USDCAD | 1H | SELL NOW Hey there my friend 🫡
SIGNAL ALERT
SELL USDCAD / 1,44588 > 1,44871
🟢TP1: 1,44369
🟢TP2: 1,43955
🟢TP3: 1,43159
🔴SL: 1,45310
RISK REWARD - 2,00
please don't forget to like 🙏🏻
Thanks to everyone who supports my analysis with likes. 💙💙💙
Trend Line Break

GOLD → Strong consolidation. What could happen?FX:XAUUSD is consolidating in the range of 2926 - 2890. The market is generally bullish, but there is a high probability of a short / long-squeeze before the strong news, which will be on Wednesday.
Markets are waiting for data on inflation and employment in the U.S., which may affect the Fed's decisions. Despite a weaker dollar and expectations of monetary easing, Fed chief Jerome Powell remains cautious.
Gold demand is supported by China, which is increasing purchases, as well as growing fears of stagflation in the US. However, traders are keeping an eye on new economic data and the impact of Chinese tariffs on US goods
Technically, the focus is on 2926 - 2890. The ideal scenario in a bull market would be a false break of the support at 2893 - 2890 and further growth due to the change of imbalance in the market after liquidation and liquidity capture. But, based on the current situation (strong range) there is a high probability of short-squeeze or long-squeeze.
Resistance levels: 2926, 2942
Support levels: 2893, 2890
At the moment the emphasis is on 2926. Formation of pre-breakout consolidation, further breakout and price consolidation above the resistance can provoke a bullish impulse.
But the difficulty is that the support has not been tested yet. If the price approaches 2926 very quickly, a false breakout could be made and in that case the price could go down to 2890 to retest the liquidity zone before storming 2926 for further upside.
Regards R. Linda!

SOLVUSDT → Retest of resistance in a bearish trendBINANCE:SOLVUSDT is strengthening within a neutral range, which is formed amid a downtrend. Cryptocurrency market quickly sells off potential after Sunday's news
Bitcoin is back to the selling zone, under the 90K area. A subsequent decline in the flagship could negatively impact the entire market.
SOLV is forming a range of 0.044 - 0.0292. The price is strengthening and tends to the zone of interest and liquidity. Against the background of key preconditions (downtrend, weak market, absence of driver, falling bitcoin) we can assume that the coin has no potential for further growth and the current maneuver may end up with a false break of resistance followed by a fall.
Resistance levels: 0.0436, 0.0439, 0.0494
Support levels: 0.0369, 0.0345
From the opening of the session, the daily ATR will be exhausted by the time resistance is reached, thus there will be no potential for resistance breakout. High probability of a bounce from 0.0436-0.0439 with the purpose of further fall to the key zones of interest located below.
Regards R. Linda!

Alibaba - This Chart Is Pretty Beautiful!Alibaba ( NYSE:BABA ) is perfectly respecting structure:
Click chart above to see the detailed analysis👆🏻
With a rally of about +80% within a couple of weeks, Alibaba is clearly showing signs of bulls completely taking over. This pressure was not unexpected though after we perfectly witnessed the major trendline breakout a couple of months ago and a retest of the confluence of support.
Levels to watch: $140, $110
Keep your long term vision,
Philip (BasicTrading)

GBPAUD → Correction to strong support before continuing growthFX:GBPAUD is forming a range with a consolidation target after breaking the base of the ascending triangle. The pound is correcting due to the dollar
Technically, on the daily timeframe we have a strong bullish structure, the price is trying to accelerate after breaking the trend resistance, but against the background of the dollar correction the pound sterling is also making a small pullback. There are no strong fundamental changes and the general direction may continue.
At the moment the focus is on ob, located in the zone of 2.0285, as well as the liquidity zone, which is located below 2.0285 + weekly low - 2.015, which also hides a huge pool of liquidity that can be tested.
Resistance levels: 2.05088
Support levels: 2.0285, 2.0151
On the background of the uptrend and the correction to the support after the update of the maximum, we can consider the strategy - false breakdown of the support with the purpose of continuation of the growth. Emphasis on 2.0285 - 2.015
Regards R. Linda!

BITCOIN → The fall continues... 82K → 76K → 73KBINANCE:BTCUSD is in a sell zone. Trump's comments on the federal reserve, crypto summit failed to impact the crypto market other than a global shakeup and liquidation...
The market has failed to see a proper bullish driver, so far. Trump's comments on the Fed ended in a global shakeup (liquidation). Yesterday's summit went so far as to prevent the cryptovalt market from turning green.
Technically. Global growth is temporarily halted, the flagship is moving into a deep correction phase, with 73K still the primary target. The market needs liquidity, as it will not be possible to grow at the expense of buyers and only bullish leverage all the time.
Price is forming a 90K - 82K range in the short zone after exiting the global consolidation. False break of 91K resistance ( global consolidation support ) ended with a fall, which may continue to both 82K and 73.5K.
Resistance levels: 89400, 91K, 93K
Support levels: 82K, 78K, 73K
The key zone of interest and liquidity is 73-66K. The price is working on a false break of resistance, the imbalance of forces in favor of bears, thus the first stop may happen in the zone of 82K ( lower boundary of the range ). Further it is necessary to observe the reaction to the support. Consolidation, breakdown and consolidation below 82K will provoke a fall to lower targets.
Regards R. Linda!

TESLA'S FALLI am seeing continuation to the downside of TESLA with all the market sentiment of Tariffs. TESLA has touched a previous order block as expected on the downward movement, closing with a support on the $252/255 area. I am awaiting 2 possible situations depending on Monday's ORB movement.
1- That TESLA will move up to the $384/382 area to retest Trendline and continue to liquidate orders down to the next order block which is in the range of $212/215 to commence a bounce to recovery.
2- Tesla will continue to drop from current range towards to the lowest order block to $212/215 for a bounce back.
Looking forward to possible news to validate sentiments in order to make these moves happen.
So far on prediction 23/0 so I am confident this is the markets intention for now.

MRF Ltd. – High Potential Trade Setup & Market Analysis🚀 MRF Ltd. – Monthly Chart Analysis 📊
🔍 Key Observations:
📌 Current Price: ₹107,202.95 📉
The stock is down almost 67% from all time high
📌 Trade Setup:
🎯 Target Price: ₹151,110.25 (+60.72%)
⚠️ Stop Loss: ₹83,228.20 (-11.46%)
💡 Risk/Reward Ratio: 5.3 (Highly favorable setup!)
📌 Best Buying Range:
📍 Highlighted Zone: ₹91,230 - ₹94,060 (Perfect Accumulation Area)
🔥 Golden Opportunity for Smart Investors!
📌 Technical Structure:
📈 Uptrend Potential: If the price holds above ₹98,100, it could shoot up towards ₹151,110! 🚀
🛑 Strong Support Levels: ₹91,230 & ₹83,228 (Stop-Loss Zone)
📊 Key Resistance Levels: ₹107,200 & ₹151,110 (Breakout Zones)
📌 Market Sentiment:
📢 Stock is trading near a crucial buying zone!
🔥 A bullish breakout could lead to new all-time highs! 🚀
❗ If it falls below ₹91,230, expect a bearish reversal.
---
🎯 Conclusion & Strategy:
✅ For Long-Term Investors:
💰 Buying near the best buying range (~₹91,230 - ₹94,060) could be a smart wealth-building strategy!
✅ For Swing Traders:
📊 Entry confirmation is needed with strong volume & momentum indicators.
✅ For Risk Management:
⚠️ A strict stop-loss of ₹83,228 is a must to protect capital!
---
🚨 Disclaimer: I am NOT a SEBI-registered adviser. All levels & price targets are for educational purposes only. 📢 Stock market investments carry risks! Please do your own research or consult a SEBI-registered financial expert before making any investment decisions. ,👍up if you really like this idea.
📌 Trade Safe & Stay Profitable! 💹✨

GOLD → Consolidation ahead of NFP. What can happen?FX:XAUUSD is heading for resistance after a false breakdown of 2895. The market continues to test 2926 with the aim to break this zone. There is news ahead and the risks of increased volatility are growing.
Markets remain jittery over Trump's tariff plans, which supported gold demand. Trade tensions and mixed U.S. jobs data are adding to inflation risks, which could weaken the dollar. All eyes are on the NFP report.
Based on the analysis of the last few reports, a rough conclusion is that on average in the first 15 minutes, weak data led gold to rise 60 points and strong data led gold to fall 50 points
However, other factors such as inflation and data revisions may dampen the market reaction. The final effect depends on investors' assessment of the Fed's future policy.
Resistance levels: 2926, 2942
Support levels: 2912.5, 2909.5, 2895
Before the news, the price may test 2926 with a false breakout (MM trap for liquidity) and roll back to the nearest support.
But further prospects depend on the news. Gold is in consolidation 2926 - 2895. On the background of possible weak data gold may overcome 2926 and accelerate to ATH. Strong data may provoke profit taking and correction to 2895 - 2875
Regards R. Linda!

AUDUSD → Retest of the imbalance zone before growth FX:AUDUSD on the back of strong dollar decline has all chances for further growth, but today, Friday, the risks are quite high, as NFP is ahead...
The currency pair is forming a local uptrend, in tandem with the falling dollar the Aussie may continue its strengthening course.
On the 4H a local correction to the imbalance zone is forming, where a rather strong support line 0.63 is just passing. The price is forming a false breakout and after capturing liquidity is trying to consolidate higher. If the bulls can keep the defense above 0.63 - 0.633, the price will be able to continue the growth phase in the short and medium term.
Support levels: 0.63, 0.6255
Resistance levels: 0.633, 0.6363
Consolidation above 0.63, subsequent rise and consolidation above 0.633 is an ideal scenario that could confirm the bulls' intentions to go higher. But, NFP and other news are ahead. Risks are rising and we should expect high volatility in the markets
Regards R. Linda!

SAIL📊 Price Action & Trend Analysis
Analyzing market trends using price action, key support/resistance levels, and candlestick patterns to identify high-probability trade setups.
Always follow the trend and manage risk wisely!
Price Action Analysis Interprets Market Movements Using Patterns And Trends On Price Charts.

BHARTI AIRTEL give Shorting Opportunityif BHARTI AIRTEL create today candle is Hanging Man so we have a create shoring trade. add in your watchlist.

Gold - A Bullish Close Would Be Insane!Gold ( TVC:GOLD ) has to close bullish now:
Click chart above to see the detailed analysis👆🏻
Just since the end of 2022, Gold rallied about +80% which is simply unbelievable looking at the already significant market cap of the precious metal. However this bullrun does not seem to be over and if Gold confirmes the trendline breakout, another rally of +40% will follow soon.
Levels to watch: $4.000
Keep your long term vision,
Philip (BasicTrading)

GOLD → Consolidation v. 2921. Ready for a breakthroughFX:XAUUSD continues to strengthen on the background of growing economic risks and also on the background of aggressive fall of dollar. The metal is at resistance at 2921 and is preparing to go even higher....
The dollar breaks the bullish structure on the background of comments of the U.S. Ministry of Finance on the reduction of rates. The verbal intervention as manipulation is affecting the markets quite aggressively. Further decline in gold is unlikely due to trade war risks and expectations of soft Fed policy.Additional impetus to gold may be given by weak ADP employment data and PMI data
Gold has two important liquidity zones. 2913 and 2903, the closest area has already been tested (liquidity zone reached) and now all eyes are on 2920.7. If it holds, gold will return to 2913-2903 support, if resistance is broken, momentum will be formed.
Resistance levels: 2920.66, 2942, 2954
Support levels: 2913, 2903, (0.5) fibo)
Gold is testing 2913.34 at the moment, a rebound is forming due to the liquidity collected. In the short term, the focus is on 2920.7. Breaking the level and fixing the price above the trigger will most likely provoke the continuation of growth to 2942-2954
Regards R. Linda!

CAKEUSDT → False breakout of resistance. Return to the trendBINANCE:CAKEUSDT is forming a false breakdown of key resistance as part of a bullish rally. Further altcoin decline may be influenced by bitcoin's decline, the flagship looks rather weak
Technically, the move in Cake looks like a counter-trend maneuver to gather liquidity before a further, possible fall. The altcoin market is weak and most coins continue to look for a bottom, while bitcoin is consolidating but with a hint of a decline to 91-90K.
CAKEUSDT is focusing on 2.6144 - 2.7288. If the bears keep the price below these zones, the coin could head down in the short to medium term
Resistance levels: 2.6144, 2.7288, 2.2964
Support levels: 2.420, 2.0634
Statistically, a false breakdown provokes the strongest movements, often even trend changes. In this case, it is a counter-trend movement and if the price reverses locally, the coin will be under the pressure of the trend again. A price fixing below 2.6144 may strengthen the fall to 2.42, 2.06, 1.04.
Regards R. Linda!

GBPUSD → Correction before bullish trend continuationFX:GBPUSD has been rising for the last month and a half as the market sentiment and the behavior of the dollar, which is gradually updating lows.
The tariff war by trump is just in full swing. The dollar continues its correction on the back of US politics as well as inflation data.
GBPUSD at this time is trading in the bullish zone, above the support at 1.262 - 1.2576. Thus, within the framework of the correction, which has been observed since the opening of the European session, the price may test the liquidity area before further growth.
Resistance levels: 1.2718, 1.2678
Support levels: 1.262, 1.2576
The local trend is bullish and the price is forming a local correction. In this case, it is worth looking for strong support zones with the purpose of rebound and continuation of growth. Targets in this case are intermediate highs: 1.2718, 1.2811
Regards R. Linda!

Meta - The Breakout Is About To Be Confirmed!Meta ( NASDAQ:META ) is attempting the breakout:
Click chart above to see the detailed analysis👆🏻
Over the past couple of months, we have been witnessing an incredible rally of about +750% on Meta. Looking at the long term reverse triangle pattern, this rally was not unexpected and such is the breakout. We still need to see confirmation, but then Meta will target the four digit level.
Levels to watch: $700, $1.000
Keep your long term vision,
Philip (BasicTrading)

US DOLLAR: Sell Opportunity after support breakTVC:DXY has broken below a key support zone, indicating a potential shift in momentum. The price is now retesting this zone, which previously acted as support and could serve as resistance, aligning with a potential bearish continuation.
If sellers confirm resistance at this level, the price is likely to decline further toward the 105.800 target , which aligns with a major support level. Conversely, a breakout above the zone could signal further upside.
Before considering short positions, look for bearish confirmation signals such as bearish engulfing candles, strong wicks rejecting the resistance zone, or increased selling volume.
Just my take on support and resistance zones—not financial advice. Always confirm your setups and trade with solid risk management.
Best of luck!

GOLD AssertationNot 100% confident in this trade Based on whats been happening in the market Missing about two confluence to be More Confident But Will See How This Works Out and Learn From my Mistake Even if i Am Right Originally my confidence in this wasnt there So i will dissect That Reason To better Pin Point High Confluence Trades

XRP ShortThe tools that will be considered as part of the forecast are kept secret.
Pay attention: This is not investment advice.

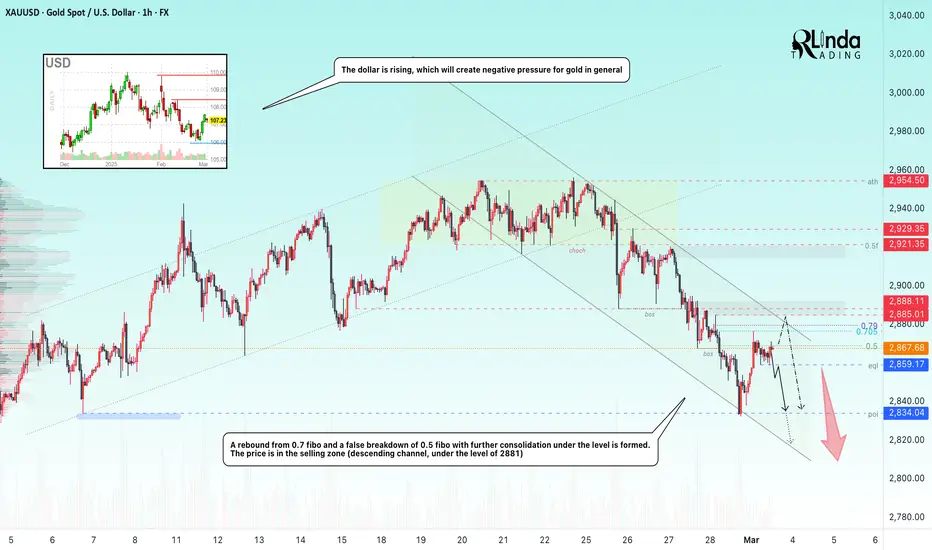
GOLD → Local downtrend, price under bearish pressureFX:XAUUSD has been strengthening since Friday. Standard reaction to the false break of the support at 2834. Price is still in a selling zone and heading for resistance before a possible pullback to the downside.
The $ has strengthened strongly over the past week and looks poised to continue its rise, but it all depends on the tariff war, economic risks and regulatory policy in the US.
Markets are reacting to attempts to regulate the war in eastern Europe. Ahead are Fed statements and US economic data.
On 4H, gold is trading flat 2881 - 2834. Below 2881 gold is under bearish pressure (selling zone). But, due to the liquidity created in the 2878 - 2881 area, gold may test the area of interest before returning to the downside.
Resistance levels: 2869, 2877, 2881
Support levels: 2859, 2834
At the moment consolidation is forming below 2869 (0.5 fibo) after a false breakdown. If the bears keep the price under the level, the decline may start earlier. We also have another trigger - 2859. A breakdown of this support will trigger a sell-off and liquidation, which may lead to a fall to 2834.
Regards R. Linda!
EURCHF → Bears increase pressure to lower the priceFX:EURCHF breaks trend support and overall bullish structure. The rising dollar is putting negative pressure on the forex markets
The fundamental background for the Eurozone is extremely negative due to Trump's policy and the US in general, especially when it comes to the tariff war. The dollar is strengthening, which generally creates a negative background for the markets.
Technically, after breaking the support of the uptrend, the bears are confirming their dominance by keeping the price in the selling zone.
Resistance levels: 0.93807, 0.94179
Support levels: 0.93299, 0.92945
A retest of the reversal zone 0.9400 is possible, but at the moment we can focus our attention on 0.93800. Consolidation of the price under this level will provoke further sell-offs.
Regards R. Linda!

BITCOIN → The “90K” door opened a corridor to $75,000BINANCE:BTCUSD is changing its market structure to bearish after the 90K breakout. A deeper correction is forming and in my opinion this is a logical and technically correct structure for a healthy market
I think it is a wrong siutation when the market is only going up and solely due to buying (injecting huge amount of funds on a HYIP).
A bitcoin correction or even a trend reversal can bring a drop of life to this market.
Fundamentally, traders have not waited for any active support for cryptocurrencies from the US as stated in Trump's election campaign. Crypto exchange hacks, scam coins and bitcoin dominance are negatively affecting altcoins.
Bitcoin's current decline and possible drop to 75-73K could give fundamentally valuable altcoins a chance, provided the flagging dominance index also starts to decline. As the simultaneous flow of funds from bitcoin to altcoins and bitcoin's rise from strong support could renew the chances of an altcoin season
Resistance levels: 88150, 90700
Support levels: 75К, 73570, 66830
A small correction to resistance 88.1 - 90.7 is possible before price starts its decline. BTC may try to go deeper, but based on the situation with the market imbalance, lack of driver and support, the price may descend in the medium term and reach the zone of interest and liquidity 75-73.5K.
Regards R. Linda!
