ETH is lagging behing / Still holding BTC intead of ETH.Since 2022 Etherum has underperform BTC. We just broke a major trendline on the weekly.
We can expect more downside to more support level
At this stage, it is still better to hold BTC than ETH
Trend Line Break

XLMUSDT → Attempt to change the local trendBINANCE:XLMUSDT is entering the correction phase after attempting to forge an uptrend. Price is breaking support due to the change in market nastreonium and bitcoin correction.
Bitcoin is moving into a correction, which is generally creating pressure for the already weak altcoin market. The reason is disappointment from the cryptocurrency community due to the lack of hints about cryptocurrencies in the new President Trump's speech. The market is trying to digest this fact as part of a correction.
XLM is technically breaking the ascending support inside the global descending channel, meaning that the pressure on the market from the bears is still present.
Support levels: 0.4177, 0.3896
Resistance levels: 0.460, 0.4955
The focus is on the previously broken channel boundary and the support level at 0.4177. The price may still test the previously broken channel boundary before falling further. But, a breakdown and consolidation of the price below 0.4177 may provoke sales.
Regards R. Linda!

SUI → The coin is coming out of an uptrend. Capitulation?BINANCE:SUIUSDT is breaking the bullish structure and testing a trigger that could trigger a strong fall. Yesterday's speech by President Trump Disappointed the cryptocurrency community. The main question is whether a correction is possible?
A correction is possible and there are several reasons for that: bitcoin is making a false breakout and generally hinting at a possible price correction after Trump's post-inauguration speech yesterday, where not a word was said about cryptocurrency. Some felt cheated. But, in this context, actions are important, if Trump moves to fulfill his promises, we may have a bullish driver.
At the moment, technically, the price is leaving the uptrend and testing the 4.250 trigger. It is a strong enough level, a break of which could make the bulls panic, which could lead to capitulation and price decline.
Resistance levels: 4.489, 4.84, 5.12
Support levels: 4.25, 4.00
A retest of the resistance or the previously broken channel boundary is possible, but a break below 4.25 may trigger a fall. A pre-breakdown consolidation is forming around this level. Watch the coin!
Regards R. Linda!

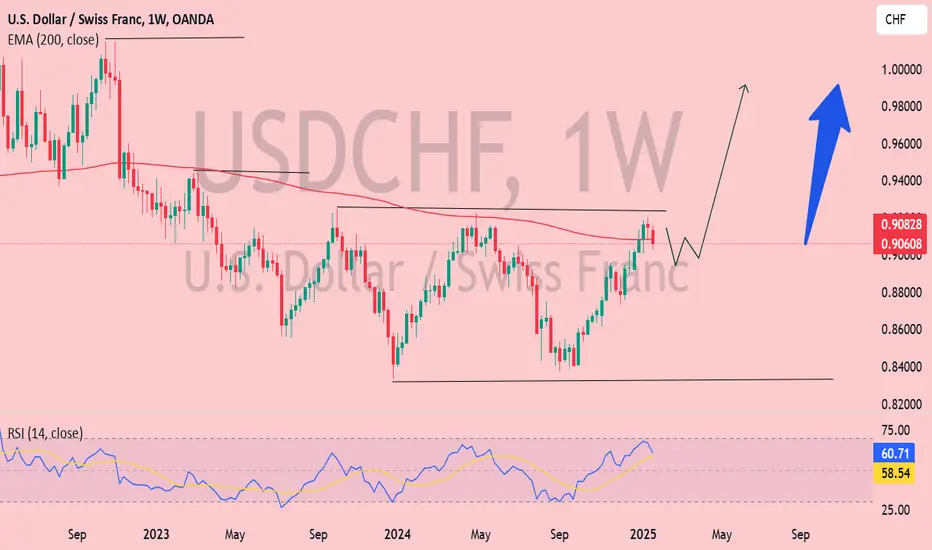
USD/CHF Poised for a Bullish Breakout: Path to Parity Bullish Scenario 🚀📈
1. Breakout Above the EMA (200) 🔺:
If the price closes above the 200-week EMA (0.9082), it could confirm a long-term bullish trend reversal.
A strong push may target key levels like 0.9500 and eventually 1.0000 (parity) 🎯, as shown by the projection arrow.
2. RSI Support 💪:
The RSI above 50 indicates that buyers are gaining momentum.
If RSI trends toward 70, it signals even stronger bullish momentum ✅📊.
3. Higher Highs and Higher Lows 📶:
The chart is forming higher highs and higher lows, a classic signal of an uptrend.
This pattern supports a move toward higher price levels 🚀.
🔥 Key Takeaway: A breakout above the EMA could spark a powerful rally, with parity (1.0000) as a major psychological target.
USD/JPY Market Update: Support Holds and Resistance Levels AheadUSD/JPY has held firm at the support level and is now returning to a buy zone. Currently, the market is at 156.500, with the next resistance level set at 159.000.
I’ve explained the market clearly in my chart analysis for easier understanding.
If anyone has questions, feel free to ask in the comments or send me a message in my inbox.
Thank you for your support—like, comment, and follow for more updates!

EURUSD → price confirms trend changeEURUSD breaks the trend. The price comes out of consolidation, updating the highs confirms the final change of trend. Now the struggle in the market will be for the resistance zones...
The dollar correction, the main motives of which are politics and geopolitics, gives chances to the forex market. EURUSD has been strengthening for a month and is beginning to hint at good prospects if the dollar continues its correction in the meantime. This week all eyes are on the Fed rate and inflation meeting, which may support the current movements.
Technically, the focus is on the support at 1.0448. If the bulls hold the defense above this zone, the price will reach 1.06 - 1.07 in the short to medium term.
Resistance levels: 1.053, 1.0607
Support levels: 1.0448
The price has already tested the area of 1.0448. Another false breakdown may be formed, the purpose of which will be the capture of liquidity, after which the currency pair will continue its growth according to the intentions of buyers, who have finally awakened interest in the euro.
Regards R. Linda!

GOLD → Ahead of ATH. How can price react to resistance?FX:XAUUSD is updating its highs and is gradually approaching ATH. Before the last spurt consolidation or correction may be formed, but chances of reaching ATH are quite high.
Gold price continues its bull run amid uncertainty in Trump's trade policy and expectation of PMI data in the US. Market participants are seeking protection in gold due to global growth fears related to trade conflicts and rate policy. The hawkish stance of the Bank of Japan and dollar weakness also support the metal. However, a pullback is possible on Friday due to profit taking ahead of US GDP data and the Fed decision.
Technically, there is a strong resistance zone at 2790 - istric high ahead. A false break of the resistance may trigger a profit-taking and subsequent correction.
Resistance levels: 2790
Support levels: 2770, 2762, 2750
Before reaching the ATH, the price may form a retest of the support at 2762. But, the main focus is on the historical maximum. The chance of reaching the target is very high, but watch the price reaction to the resistance. False breakdown may provoke a deep correction.
Regards R. Linda!

GBPJPY → The CBJ has raised rates. What's in store for the pair?FX:GBPJPY experienced an attempt to break through resistance and rise, but failed to realize the intention as traders do not believe in bullish movement due to the actions of the Central Bank of Japan
The Central Bank of Japan raised the rate by 0.25% to the highest since 2008. The bank sees accelerating inflation, a slowing economy and is likely to raise the rate further if inflation continues to rise.
Fundamentally, the situation may trigger a fall in the currency pair, but it may be restrained due to the Pound's strength against the Dollar. Nevertheless, I assess the situation regarding a false break of resistance from the technical part, and from the fundamental part from the Japanese action, as they are targeting the medium term.
Resistance levels: 193.00
Support levels: 192.00, 190.55
Another attempt to retest resistance before a further drop is possible. Traders are starting to build up longs on the Yen, which may lead to a bearish correction of the currency pair.
Regards R. Linda!

USDJPY → Japan's central bank is about to raise ratesFX:USDJPY cannot continue its uptrend yet. Rumors about possible actions from the central bank of Japan will appear. The dollar in the meantime continues to rise....
158.46 is a rather strong resistance formed by the bears, who continue to put pressure on the market. This week, we expect active actions from the Central Bank of Japan, namely - raising interest rates. In general, this phenomenon is quite rare, but it can support the currency pair very well. If the Japanese decide to take such actions, the currency pair may continue the correction from 0.5 - 0.7 fibo. Priority targets in this case may be the zones of interest at 153.24, 151.94.
Resistance levels: 156.56, 157.22
Support levels: 155.1
Price fixing below 0.5 Fibo or below 155.95 may provoke aggressive selling. The decision on rates in Japan will take place on Friday, until then the price may be in consolidation....
Regards R. Linda!

Auto1: buying high and selling higher opportunityAuto1 is currently in a bullish trend, making it an attractive opportunity for momentum traders. The price action suggests a 'buy high, sell higher' scenario, where the stock's upward momentum could continue to deliver gains. Traders may consider entering now to capitalize on this trend, as the stock seems poised to reach new highs in the short to medium term. However, keeping an eye on key support and resistance levels will be crucial to managing risk effectively

GOLD → bulls are aiming for ATH. The odds are high...FX:XAUUSD is in a rally phase aiming for ATH. Based on geopolitical data, we have a pretty good chance. The focus is on 2750. From this point the northbound train can continue its journey.
Trump's policies are putting quite a bit of pressure on geopolitics due to creating trade problems for major nations like China, EU, Canada, BRICS countries. Chinese Vice Premier Ding Xuexian has warned of the negative effects of a trade war, which has further increased demand for safe havens like gold and the US dollar. Gold is also facing pressure because of the Fed, but the dollar correction is becoming another driver for the metal.
Technically, the price is trying to consolidate above a rather important level. 2749. If the bulls manage to keep the defense above 2750, the metal may continue its growth in the short and medium term
Resistance levels: 2759
Support levels: 2750, 2737, 2732
Emphasis on 2750. If the bulls keep this area under their control, the gold will go higher. But, I do not exclude a retest of 0.5 Fibo liquidity zone or 2732 before further growth.
Regards R. Linda!

Bollinger Bands — Enhanced Classic Tool for Technical AnalysisBollinger Bands — Enhanced Classic Tool for Technical Analysis
Bollinger Bands are a classic technical analysis tool designed to identify short-term trends and gauge market volatility. We’ve upgraded their functionality to make them even more intuitive and precise for trading decisions.
What’s New in Our Bollinger Bands:
Color-Coded Trend Identification
The band color automatically shifts with short-term trend reversals. This allows traders to quickly spot trend direction and decide when to enter trades.
Band Width
Reflects current volatility levels and price momentum. Narrow bands signal consolidation (accumulation/distribution), while wide bands indicate high volatility and potential trend initiation.
Dynamic Support & Resistance Levels
The outer bands, calculated as standard deviations from the moving average, act as dynamic reference points for entry and exit levels.
Gradient Zones
The bands are divided into four gradient zones, highlighting optimal areas for position sizing. Buy near the lower zones, sell near the upper zones—simple yet effective.
How to Use Bollinger Bands in Trading:
1. Identify Short-Term Trends
Bullish Trend: Green bands signal a bullish market.
Bearish Trend: Red bands indicate bearish sentiment.
2. Assess Volatility & Choose Strategies
Wide Bands: High volatility, strong trend initiation. Consider breakout strategies.
Medium Bands: Range-bound markets. Trade bounces from band boundaries.
Narrow Bands: Consolidation (accumulation/distribution), often preceding strong price impulses.
Pro Tip: A sharp band contraction often precedes explosive price movements.
Volatility Assessment Examples
High Volatility + Trend:
Wide band expansion signals a strong bullish trend (green bands).
Medium Volatility + Range:
Moderate band width and frequent color shifts suggest choppy markets—ideal for boundary bounce trades.
Low Volatility + Breakouts:
A narrow band breakout (green bands) confirms a strong bullish impulse.
Trading Bounces from Band Boundaries
Prices tend to revert to the moving average (midline). This makes Bollinger Bands a powerful tool for swing traders:
Lower Band (Support): Oversold zone—consider long positions.
Upper Band (Resistance): Overbought zone—consider short positions.
Bounce trades work best in sideways markets or unclear trends. Avoid bounce strategies during band expansion (new trend formation).
Example Trades
Short on Upper Band Rejection:
Price stalls at the upper band in a bearish macro trend, offering a high-probability short entry.
Long on Lower Band Rebound:
Price bounces from the lower band in a bullish macro trend, confirming a long opportunity.
Additional Confirmation Tips
Combine Bollinger Bounce signals with:
Midas Multi-Indicator: Whale activity detection, trend ribbon reversals.
Oscillator Overextension: RSI, Stochastic, or MACD divergence.
Price Momentum: Volume spikes or candlestick patterns.
Refine entries by aligning band signals with broader market context and multi-timeframe analysis.

52 week low1) Yesterday, stock created a 52-week low today given the surprise move.
2) 363 its lower level and get a bounce from these levels
3) Closely observe this chart 📊 and take notes 📝 on volume buildups.
4) very low volume in stock during its bearish mode call downtrend
5) Now look at today's volume, looking like a rocket filled with ⛽ fuel to reach the target 🎯 today only. (I'm not recommending, just expressing what I look for in a chart.)
EMA 21 395
EMA 50 416
EMA 200 503
EMA 9 394

EURUSD → An attempt to change the trend could be successfulFX:EURUSD gets a chance for a bullish run. The currency pair breaks the prolonged downtrend and consolidates for a chance to continue the upward movement
The global trend is downtrend and at the moment it is too early to talk about a change of trend, as the price is under pressure from the strong resistance at 1.044. BUT! A pre-breakout base is forming around this area, so if the dollar continues its corrective course, EURUSD will have a chance to confirm the trend change. If the bulls are able to overcome 1.0448 and consolidate above this level, we will have a chance to rise to 1.06 and possibly higher....
Resistance levels: 1.0448, 1.0607
Support levels: 1.033, 1.0222
Technically, the focus is on the nearest trigger at 1.0448. A breakout and consolidation of the price above this zone may provide a convenient entry point to open long positions.
Regards R. Linda!

BITCOIN → Correction before further flight to 112-120KBINANCE:BTCUSD surprises everyone again with this week's rally. After retesting the panic and risk zone, when many started selling, the price turned around and flew 18% in a few days....
One week old idea: BITCOIN → Retest of key support. What can happen?
There could be several factors behind the gains that have been forged over the past 3 days:
New reports point to increased activity from major players, including institutional investors,
Trump's upcoming inauguration, the crypto community is expecting the new president to take active steps. And overall, the bullish three-day run is a combination of macroeconomic factors, technical breakdown and fundamental confidence in the future of cryptocurrencies. All of this created a strong bullish momentum that attracted new buyers and increased institutional investor interest.
From a technical perspective, the 100K and 102.5K area plays an important role for me. If the bulls can keep the price above this zone, the growth will continue in the medium term.
Support levels: 102.5K, 100K
Resistance levels: 103.6K, 105.7K, 107.5K
Technically, at the moment, a pre-breakdown situation is forming on H1 against the support at 102.8. Accordingly, bitcoin may form a correction to both 100K and 97.5K. But, if the fall will quickly recover or the bulls will keep the defense above 100-102.5K, then further we can count on growth up to 108-112K.
Regards R. Linda!

GOLD → Correction after a false breakout. What's next?FX:XAUUSD reaches a key resistance that stops a strong rally. A false breakdown triggered a correction, which could be a chance for comfortable buys.
The gold price stabilized around $2,725 after a three-day climb, remaining under profit taking pressure. Strong data on China's economy failed to inspire the market as real estate concerns and possible U.S. tariffs dampened optimism.
Expectations of Fed rate cuts continue to support gold despite mixed data on the US labor market and retail sales. The Fed chief's statements about possible rate cuts in the first half of the year are adding support to the metal.
Next week, traders' attention will be focused on US housing and industrial production data.
Support levels: 2700, 2697
Resistance levels: 2712, 2721
Global and local trend is bullish. Counter-trend correction is being formed. Technically, the correction may reach the zone of interest 2700 - 2697, from which we should expect a rebound, for example, to 2712, or even the recovery of the bullish trend.
Regards R. Linda!

NZDUSD → The bearish trend may get its continuationFX:NZDUSD failed to realize the chance when the dollar went into correction. Buyers do not believe in the realization of the bullish scenario at the moment. The price continues to succumb to pressure
On the weekly timeframe the price approached the strong support level 0.5545 - 0.55. Accordingly, a reaction in the form of a small correction is possible. Small, because the dollar continues its bull run, and Trump's policy allows to keep this scenario in the medium term.
On H4, the price continues to test the support at 0.5588 and a local descending triangle is forming amid pressure from the bears. Possible retest of the channel resistance before further decline.
Resistance levels: 0.563, 0.567
Support levels: 0.5588, 0.5511
Technically, a breakdown and consolidation of the price below 0.5588 will provoke further sales against the background of the current local and global downtrend.
Regards R. Linda!

Looking for a break of this upper trendline on RIOT! Sound on!🔉
📣Make sure to watch fullscreen!📣
Thank you as always for watching my videos. I hope that you learned something very educational! Please feel free to like, share, and comment on this post. Remember only risk what you are willing to lose. Trading is very risky but it can change your life!

GOLD → Realization of consolidation and retest of resistanceFX:XAUUSD is testing a rather important resistance, a break and consolidation above which will open the way to 2721 - 2726. Technically, gold has entered the buying zone, and the fundamental background supports it
Gold was supported by weak US inflation data, dollar correction and adjusted expectations of Fed rate cuts, as well as hopes for stimulus in China.
Traders' attention shifts to December retail sales and jobless claims in the US. These data will help clarify the Fed's monetary policy outlook. Weakened dollar and lower bond yields support the current growth of gold.
Technically, all eyes are currently on the uptrend and resistance at 2697.8
Resistance levels: 2697.8, 2700
Support levels: 2690, 2678
If gold can consolidate above 2697-2700 and the bulls hold the defense above this zone, we should expect growth in the short and medium term. But do not forget about the news that will be published later.
Regards R. Linda!

XLMUSDT → High readiness for a bull run to 0.6100BINANCE:XLMUSDT is ready to move into the realization phase after coming out of a strong accumulation. The market is struggling for a strong buying zone.
The coin, technically, is ending its correction. The price is gradually updating highs and breaking intermediate resistance levels, but the key factor is the exit from the medium-term consolidation and breaking the resistance of the descending channel formed on H4.
If the bulls hold the defense above the key support zone 0.46 - 0.452, we can expect growth in the medium term. In addition, the rising bitcoin and the approaching Trump inauguration can be good drivers for the cryptovalt market.
Resistance levels: 0.486
Support levels: 0.4605, 0.4522
Thus, the focus is on the consolidation of 0.486, 0.46.
A break of resistance will activate the rally. False break of support and consolidation above the level will also be a good signal that the bulls are quite aggressive.
Regards R. Linda!

GOLD → Uptrend, price depends on CPIFX:XAUUSD continues to form an uptrend on the local and medium-term timeframe. The price is again testing strong resistance on H4-D1 and is showing signs of readiness to rise to 2700-2750.
The PPI report was a bit of a surprise and a small driver for the markets, including gold, as the dollar moved into correction. CPI is ahead and bets are high on the report as it could change the market's assessment of the prospects for a Fed rate cut this year. A strong CPI could add pressure on gold, while a weak report would support the bulls.Hawkish Fed rates are supported by the premise that Trump, who begins his second term next week, is likely to fuel inflation with his protectionist policies.
Technically, there is an area of volume density and order block ahead, which could trigger a small pullback to support from which upside could continue.
Support levels: 2678, 2674, 2669
Resistance levels: 2690, 2697, 2703
But, in the short (mid) term everything depends on the news. CPI is ahead and with weak data gold may go on a bull run, but strong data may stop the growth and turn the metal around. Focus on key levels!
Regards R. Linda!

EURJPY → The fall may continue after the correctionFX:EURJPY is under pressure. The currency pair is breaking the local uptrend. Technical and fundamental background is weak, which in general can put pressure on the market.
Globally, the currency pair has no trend and is trading within the range of 166 - 156. The last growth attempt was unsuccessful, the price could not approach the intermediate maximum and facing a strong bear the price turned around and fixing below the SMA headed to the lower boundary of the flat.
Locally, the change of character to bearish is confirmed, but before further fall the price may form a correction, for example, to 0.5 Fibo (imbalance zone), or to local zones of interest, but in the medium term the fall may continue.
Resistance levels: 162.3, 163.1
Support levels: 160.9, 159.8
A false breakdown of local support is formed, which may lead to correction, but since we have confirmation that the market is bearish, after the correction the fall may continue.
Regards R. Linda!

SOLANA → Will a false breakdown be the cause of the rally?BINANCE:SOLUSDT is testing a previously broken downtrend boundary as part of a correction. Bulls are employing aggressive methods to keep defenses above key support ahead of Trump's inauguration, keeping hopes high
On the weekly timeframe, the market is supported by SMA50 support indicating a strong uptrend. The focus is on two strong levels: 204.75 and 175. These are the boundaries of the current range. A breakdown of any of the boundaries will play a key role in further price movement. But I consider the realization of resistance as a priority.
On D1 yesterday a false break of strong support was formed in the form of previously broken downtrend resistance. This indicates that the market is still in a bullish plane and on the background of upcoming important news this could have a favorable impact for the coin.
Resistance Levels: 203-204
Support levels: 183, 175
If the price starts to retest the support at 175 and form a consolidation with a gradual downward compression, the risk of breaking the bullish pattern will increase.
But, based on fundamental data, I expect a consolidation above 183 and further growth
Regards R. Linda!
