NZDCHF - Bullish - BUYCALL BULLISH INDICATIONS:
1- Market currently in consolidation phase with in a down channel
2- market has bounced back from good support level
3- if the market break the last LH / neckline, we can enter into the market with
a TP of R:R of 1:1 and the Stoploss slightly below the LL or the Support level.
Trendlineset

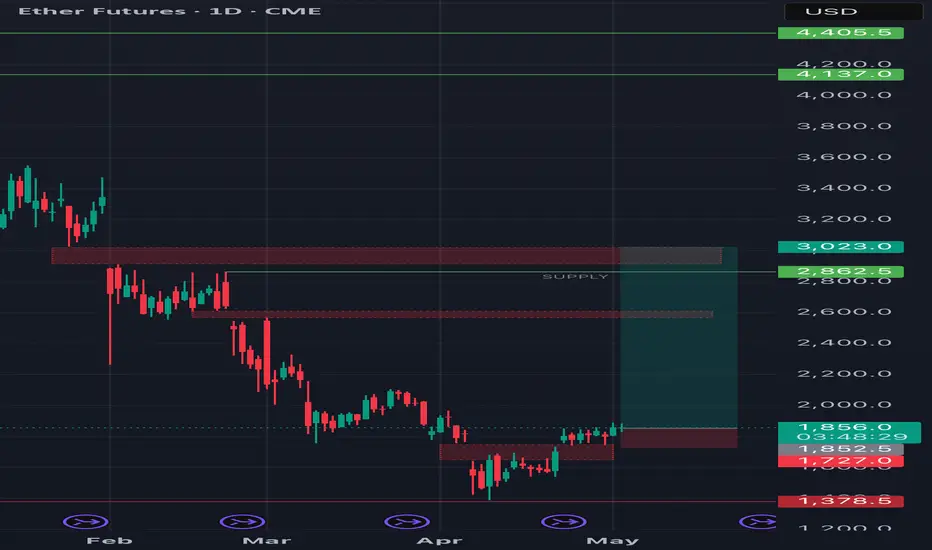
ETH/USDT - Daily Analysis Position: Long | Entry: 1850 | Target:Price has reclaimed the 1800–1850 demand zone with strength after multiple rejections, and is now aiming higher. If the breakout above 1900 sustains, momentum could drive price towards the next key supply zone around 2860–3020, with intermediate resistance near 2600.
I’m currently holding a long from 1850 with a high-leverage setup (50x), targeting 2600.
Risk is elevated due to leverage, but the structure supports bullish continuation as long as we stay above 1800.
A daily close below 1800 would invalidate the setup and trigger stop reassessment.
Watch levels:
• Support: 1800 – 1850
• Resistance: 2600 / 2860 / 3020
• Invalid if closes below: 1700

ETH Weekly chart - do you get the pattern?Well, my friends,
This is the CRYPTOCAP:ETH with the weekly chart.
Following my other Chart using the #GANN Fan, I now drawed the triangle for you.
Like that you can see how the #ETHERUM behaves and when we will see it imo in a few months.
This is almost the beginning of the #ALTSEASON.
The #ETH still has some work to do.
We need to see a clear break of the last high at 2924$ and then based well above 3000$.
After that, we shall start attacking the 3400$ area and we will have to watch the retest of that area.
Once we are done with those technical areas, we will be able to push to the 4000$ and #ATH
What is missing now, is the MA13 MA30, and MA55 Slopes, I want to see them turn positive and to see MA13 cross MA30 and then MA30 cross MA55, this should be MEGA BULLISH and we are on the way there.
NFA
DYOR

How to determine trend line in trading?Determining a trend line in trading is a fundamental skill used to identify the direction and strength of a price trend. Here's a step-by-step guide to drawing and interpreting trend lines:
1. Understand the Basics of a Trend Line
A trend line is a straight line that connects two or more price points on a chart, extending into the future to act as a line of support or resistance.
Uptrend Line: Connects higher lows in an upward trend (acts as support).
Downtrend Line: Connects lower highs in a downward trend (acts as resistance).
Sideways/Ranging Market: Price moves horizontally, and trend lines may not be as effective.
2. Identify Key Price Points
For an uptrend, identify at least two higher lows (swing lows) and draw a line connecting them.
For a downtrend, identify at least two lower highs (swing highs) and draw a line connecting them.
The more times the price touches the trend line without breaking it, the stronger and more valid the trend line is.
3. Draw the Trend Line
Use a charting platform to draw the line manually.
Connect the swing lows for an uptrend or swing highs for a downtrend.
Ensure the line is not too steep or too flat; it should reflect the natural slope of the price movement.
4. Validate the Trend Line
A valid trend line should be touched by price at least three times. The more touches, the more reliable the trend line.
If the price breaks the trend line significantly, it may indicate a potential trend reversal or weakening of the current trend.
5. Use Trend Lines for Analysis
Support/Resistance: In an uptrend, the trend line acts as support. In a downtrend, it acts as resistance.
Breakouts: A break below an uptrend line or above a downtrend line may signal a trend reversal or continuation, depending on the context.
Trend Strength: A steep trend line may indicate a strong trend, while a shallow one may suggest a weaker trend.
6. Combine with Other Tools
Use trend lines in conjunction with other technical indicators (e.g., moving averages, RSI, MACD) to confirm trends and potential entry/exit points.
Look for volume confirmation: Increased volume during a breakout or bounce off the trend line adds validity to the signal.
7. Adjust as Needed
Trend lines are not static. As new price data comes in, you may need to redraw or adjust the trend line to reflect the current market conditions.
Example:
BTC has touched the line that I've drawn multiple time so It is a reliable Bullish Trend line. The next Possible connection can be around 93.5k! the line also acts as a support.
By mastering trend lines, you can better identify potential trading opportunities and manage risk effectively. Always practice on historical data and use proper risk management techniques.

Further FIb levels for nifty after budgetResistance sell opportunity 1st level 23673
Resistance sell opportunity 2nd level 24025
Support Buy on dip level 23124
📢 Disclaimer:
This post is for educational purposes only. Investments in the stock market are subject to market risks. Please consult a financial advisor before making any trading decisions.

XAU-USD (Gold)The gold pair moves in a vertical upward price channel and gives respect to their upper and lower trendlines. If the market loses its momentum on the ATH level of gold then it's a chance to move down and some retracement it. There is a big zone on the ATH T.F of gold that is 2400-2430. And if the market respects that zone then we see to reject price to lower trendline at 2380.

XAU-USD (Gold)The gold pair moves in a vertical upward price channel and gives respect to their upper and lower trendlines. If the market loses its momentum on the ATH level of gold then it's a chance to move down and some retracement it. There is a big zone on the ATH T.F of gold that is 2400-2430. And if the market respects that zone then we see to reject price to lower trendline at 2380.

User Using different timeframes for analysisDrawing trendlines and channels is a fundamental aspect of technical analysis when trading GBP/USD or any other financial instrument. Here's how traders can effectively draw trendlines and channels on GBP/USD charts:
**Drawing Trendlines:**
1. **Identify Trend Direction:** Before drawing trendlines, determine the direction of the trend on the GBP/USD chart. Trends can be upward (bullish), downward (bearish), or sideways (range-bound).
2. **Connect Swing Lows or Highs:** For an upward trend, draw an ascending trendline by connecting successive swing lows (the lowest points in price between upward movements). For a downward trend, draw a descending trendline by connecting successive swing highs (the highest points in price between downward movements).
3. **Use Multiple Points:** Aim to draw trendlines that touch as many price points as possible without violating the overall trend direction. The more points the trendline touches, the stronger it is considered.
4. **Validate the Trendline:** Once drawn, validate the trendline by observing how price reacts to it. In an upward trend, price should bounce off the trendline and continue higher. In a downward trend, price should respect the trendline as resistance.
**Drawing Channels:**
1. **Identify Trend Direction:** Similar to drawing trendlines, determine the direction of the trend on the GBP/USD chart.
2. **Draw Parallel Lines:** After drawing the main trendline, extend it in both directions. Then, draw a parallel line that connects the highs (for a downward trendline) or lows (for an upward trendline) that are not connected by the main trendline.
3. **Adjust the Channel:** Ensure that both lines of the channel contain significant price movements within them. Adjust the channel if necessary to encompass as many price swings as possible.
4. **Interpretation:** In an upward channel, traders may look for buying opportunities near the lower trendline and take profit near the upper trendline. In a downward channel, selling opportunities near the upper trendline and taking profit near the lower trendline may be considered.
5. **Validation:** Confirm the validity of the channel by observing how price interacts with the trendlines. Price should generally respect the boundaries of the channel, bouncing off the upper trendline in a downward channel and the lower trendline in an upward channel.
By mastering the skill of drawing trendlines and channels on GBP/USD charts, traders can effectively identify trend directions, potential reversal points, and trading opportunities in the market.

MACY'S Weekly Technical AnalysisM weekly - No RECOMMENDATION or ADVICE Status / EDUCATIONAL only - Support, Resistance, Trend Lines, Confluence, Cluster, Modified Schiff Pitchfork, Fibonacci Extension - Hope it Helps, Good Luck
DISCLAIMER - This communication is not trading or investment advice, recommendation or solicitation to buy, sell or hold any investment product is provided for informational, educational and research purposes only. All illustrations, forecasts or hypothetical data are for illustrative purposes only. The author or persons involved in the conception, production and distribution of this material cannot be held responsible for transactions or any financial loss or damages resulting directly or indirectly from the use or application of any concepts or information contained in or derived from this material. Past performance is not indicative of future results. Any person who chooses to use this information as a basis for their trading assumes all the liability and risk for themselves.

S&P 500 Daily Technical AnalysisSP 500 Daily - No RECOMMENDATION or ADVICE Status / EDUCATIONAL only - Support, Resistance, Trend Lines , Parallel Channel, Cluster, Confluence, Pitchfork, Fibonacci Extension - Hope it Helps, Good Luck
DISCLAIMER - This communication is not trading or investment advice, recommendation or solicitation to buy, sell or hold any investment product is provided for informational, educational and research purposes only. All illustrations, forecasts or hypothetical data are for illustrative purposes only. The author or persons involved in the conception, production and distribution of this material cannot be held responsible for transactions or any financial loss or damages resulting directly or indirectly from the use or application of any concepts or information contained in or derived from this material. Past performance is not indicative of future results. Any person who chooses to use this information as a basis for their trading assumes all the liability and risk for themselves.

S&P 500 Daily Technical AnalysisES (SP 500) Daily - No RECOMMENDATION or ADVICE Status / EDUCATIONAL only - Support, Resistance, Trend Lines , Parallel Channel, Cluster, Confluence, Pitchfork, Fibonacci Retracement / Extension - Hope it Helps, Good Luck
Chart unchanged, just a refresh from July 2023, no update required.
DISCLAIMER - This communication is not trading or investment advice, recommendation or solicitation to buy, sell or hold any investment product is provided for informational, educational and research purposes only. All illustrations, forecasts or hypothetical data are for illustrative purposes only. The author or persons involved in the conception, production and distribution of this material cannot be held responsible for transactions or any financial loss or damages resulting directly or indirectly from the use or application of any concepts or information contained in or derived from this material. Past performance is not indicative of future results. Any person who chooses to use this information as a basis for their trading assumes all the liability and risk for themselves.

Bitcoin technical analysis_2023-12-12Short position
After breaking the support formed at the price of 41360
Entry 41100
The loss limit is 42200
Risk Free 40000
The profit limit is 38800

Houston, We Have a Problem!yes, we have a problem with this trendline...
......................................................................................................................
We are not registered or licensed in any jurisdiction whatsoever to provide investing advice or anything of an advisory or consultancy nature.
and are therefore are unqualified to give investment recommendations.
Always do your own research and consult with a licensed investment professional before investing.
This communication is never to be used as the basis of making investment decisions, and it is for entertainment purposes only.

Crowdstrike Holdings Testing Support, Whats next?Hi guys! This is a Technical Analysis on Crowdstrike Holdings (CRWD) on the 1 Week Timeframe.
Since this is a WEEKLY chart, its important to note that the current candle is not yet confirmed and closes end of trading Friday, 08/11/2023
Lets take our attention to the Orange circle highlighting current price action.
We have reached a critical SUPPORT zone.
A place where 2 SUPPORT levels converge
1. BLUE LINE - the 21 W EMA
2. BLACK SUPPORT TRENDLINE - 6 month support trend line
Currently we have "WICKED" or bounced from this convergence of supports.
It is crucial that we close this weeks candle ABOVE this zone.
Critical also to stay above the 21 W EMA, as doing so indicates BULLISH TREND.
Confirming BELOW would indicate BEARISH Trend.
*** If we see confirmation of SUPPORT
-> this can be an ENTRY ZONE for a potential trade/bounce back up.
*** How ever its a little too soon to tell
We are also currently BELOW another TRENDLINE thats labeled "Support turned RESISTANCE".
It be nice to see PRICE get ABOVE this, come end of week.
Notice also the RED CIRCLE that shows our REJECTION from a convergence of RESISTANCE.
Here we have 2:
1. being the ORANGE horizontal resistance line
2. Slanted BLACK LINE
Take a look also at the LARGE UPPER WICK and how multiple candles have LARGE UPPER WICKS.
This indicates SELL PRESSURE and that this area is a tough area to break to the UPSIDE.
It can give off further bearish momentum to the downside.
We also have GOLDEN CROSS of the:
1. 21 EMA
2. 50 SMA
BUt this alone is not enough for the BULLISH CASE.
We need to have price stay ABOVE for it not to be short lived and become a FAKEOUT.
Worst case scenario for now if we CANNOT maintain SUPPORT at our current area.
ANd we end up breaking below 21 EMA & 6 MONTH SUPPORT LINE.
Look to the 50 SMA as a SUPPORT level, it is currently pointed down so where ever it converged with price action at the time if a hypothetical price decline.
If that fails, look to the ORANGE " Previous Resistance Trend from TOP" line. That would actually be a wonderful zone, provided we maintain SUPPORT.
-> This would be another zone to enter POSITIONS for a trade.
Now lets take a look at our Indicators.
1. RSI -> We printed a Lower High, with RSI going BELOW the BLACK Moving Average.
If you look LEFT, there is evidence that when we do this, price tends to drop. So be alert.
2. STOCH RSI is also in the process of printing a BEARISH CROSS. If this happens BEARISH moment will enter, leading to the probability of further price DECLINE.
-> If you look LEFT, everytime we point down, it has coincided with price DECLINES.
3. MACD, with the printing of light GREEN histograms that are small in size, this also is an indication of waning of BULLISH momentum. If we see a CROSS between blue/orange lines where BLUE goes under the ORANGE -> this will lead to an injection of BEARish momentum and further price DECLINES.
CONCLUSION:
CRWD has reached a critical SUPPORT zone, for us to start our descent back to the all time highs we need to maintain SUPPORT here. Some signs point to bullishness where others give off signs of continuation of a DECLINE from our REJECTION zone. But the first thing that needs to get done is confirming SUPPORT above the mentioned zones. Important to see what price action and the indicators do come end of the week.
Stay tuned for more updates on CRWD in the near future.
Thank you for taking the time to read my analysis. Hope it helped keep you informed. Please do support my ideas by boosting, following me and commenting. Thanks again.
If you have any questions, do reach out. Thank you again.
DISCLAIMER: This is not financial advice, i am not a financial advisor. The thoughts expressed in the posts are my opinion and for educational purposes. When trading always spend majority of your time on risk management strategy.

S&P 500 Daily Technical Analysis (UPDATED)ES (SP 500) Daily - No RECOMMENDATION or ADVICE Status / EDUCATIONAL only - Support, Resistance, Trend Lines , Parallel Channel, Cluster, Confluence, Pitchfork, Gap, Fibonacci Retracement / Extension - Hope it Helps, Good Luck
DISCLAIMER - This communication is not trading or investment advice, recommendation or solicitation to buy, sell or hold any investment product is provided for informational, educational and research purposes only. All illustrations, forecasts or hypothetical data are for illustrative purposes only. The author or persons involved in the conception, production and distribution of this material cannot be held responsible for transactions or any financial loss or damages resulting directly or indirectly from the use or application of any concepts or information contained in or derived from this material. Past performance is not indicative of future results. Any person who chooses to use this information as a basis for their trading assumes all the liability and risk for themselves.

Big bitcoin resistance So ignoring everything on the chart apart from the thick green with arrows indicating support and resistance touches.
This has been a major resistance line for BTC since January 16th. High volatility whenever we break or get rejected from this line.
Anyone else been watching this one?

GBPAUD I Pull back and strong resistance aheadWelcome back! Let me know your thoughts in the comments!
** GBPAUD Analysis - Listen to video!
We recommend that you keep this pair on your watchlist and enter when the entry criteria of your strategy is met.
Please support this idea with a LIKE and COMMENT if you find it useful and Click "Follow" on our profile if you'd like these trade ideas delivered straight to your email in the future.
Thanks for your continued support!

NAVINFLUOR-WEEKLY SUPPORT-RETESTNSE:NAVINFLUOR
Stock has given breakout from 4450 level on April 1st week.
Currently stock is trying to take support on the same level.
It’s good entry with small SL, Target as per your Risk.
Please note that I’m already long in it from 4485 levels.
This is only for educational purpose, please manage your risk accordingly.

Oracle Rebound & technical analysis According to this chart we are riding the 8 and 20 day. Price bounced off of the 50 after the earnings sell off and broke out from a double bottom.
If this plays out in a perfect world this will blow past 127 from the news run up. Not to mention everything AI is running and we are currently in an AI baby bubble.
I would trade this carefully since it is making new highs and can fall from a sell off and profit taking.
Let’s see how high this goes. Congrats if you were like me and bought around 115 after the earnings sell off.
Trade Responsibly.
#TradeTheWave

Swing trade in Intellect DesignGood buy from this position as trendline support + consolidation.
Targets may go from 557 + , 567+ & 609.
Expecting a good move this week since good volumes + increase in promoter holding!
Lets hope for the best!

📈 Fibonacci Power in Uptrends📍 What Are Fibonacci Retracement Levels?
Fibonacci retracement levels—stemming from the Fibonacci sequence—are horizontal lines that indicate where support and resistance are likely to occur.
Each level is associated with a percentage. The percentage is how much of a prior move the price has retraced. The Fibonacci retracement levels are 23.6%, 38.2%, 61.8%, and 78.6%. While not officially a Fibonacci ratio, 50% is also used.
The indicator is useful because it can be drawn between any two significant price points, such as a high and a low. The indicator will then create the levels between those two points.
📈 To effectively trade Fibonacci retracements during an uptrend and strategically enter the market during pullbacks, follow these steps:
🔷Identify the uptrend: Determine the presence of a clear upward price movement.
🔷Apply Fibonacci tool: Utilize the Fibonacci retracement tool to identify potential retracement levels within the uptrend.
🔷Focus on pullbacks: Wait for the price to experience a pullback or retracement within the uptrend.
🔷Assess Fibonacci levels: Analyze the price's interaction with key Fibonacci levels, such as the 61.8% or 65% zone, to identify potential support or resistance areas.
🔷Higher highs confirmation: Look for the formation of higher highs after the price touches a Fibonacci level, indicating a continuation of the uptrend.
🔷Entry opportunity: Consider entering the market after a pullback when the price resumes its upward movement, using appropriate risk management strategies.
By combining the power of Fibonacci retracements, recognizing pullbacks in uptrends, and waiting for higher highs, traders can position themselves to capitalize on the potential profit opportunities offered by the market.
👤 @QuantVue
📅 Daily Ideas about market update, psychology & indicators
❤️ If you appreciate our work, please like, comment and follow ❤️

XAU/USD Swing Trade PlanHello Guys.
Hope you have good times and great trades too!
Today i'm going to explain why GOLD will fall to at least 1930 in coming days.
First of all as you can see in my chart we see a strong Bearish Divergence Between
RSI and price in Daily TF , that i show them with white lines.
Next , We can see a Evening Star Pattern in this strong Resistance level(2050 $).
After that we pass through 20 and 50 MA 's and according to Pullback to MA50 ,
I personally predict we can continue downside.
as you can see we have a trendline base don the pervious two bottoms.
And this Trendline Overlap with MA100(Green line).
So i think this is the first Target for the price in the way of going down.
For later happenings we should follow chart and see what candles shape in this area.
But Don't forget to SET a Good Stoploss in Lower timeframe , if you want to catch this Fish :)
Hope you Enjoy my opinion and
PLEASE
Share me your idea in comments , Let me Learn something from you.
THANKS all my friends.
Good Luck.
