BTC ideal long term accumulation plan!These are my ideal marked ranges to accumulate for bull run, however I will start accumulating before these levels (following my mentor's plan!)
Marked zones are: 12073 - 11030, 9900 - 8820, 6000 - 5000, 3592 - 3000
Trendlineset

RVN broke out falling wedge pattern#RVN/USDT
$RVN broke out from long term falling wedge pattern.
now price is inside long tern resistance zone.
🐮 breaking out from this resistance zone that is the same with ascending resistance will increase price to upper resistances and final target of this pattern can be around $0.2.
🐻 break down from ascending support will invalidate this analysis.

SHIB trend lines#SHIB/USDT
$SHIB had a great reaction to trend lines and S&R zones of previous analysis.
price broke down from ascending trend line and now it is at support zone between 0.5 and 0.618 fib level of last swing high.
🐻 break down from this support zone will drop price to next support zone which is the same with 0.786 fib level.
🐮 holding this support zone and breaking out from descending trend line can increase price to resistance around $0.000015 or even next resistance around $0.00002.

bullish flag can make another leg up for ETC#ETC/USDT
$ETC had more than 140% increase since my analysis from 6/12/2022 and broke out from descending trend line.
🐮 now price shaped a bullish flag pattern and we just need a confirmation of the weekly candle to close above the channel.
so if we have this confirmation price can increase toward 1.618 fib level of last swing high (which is between upper trend lines) to complete flag Pattern and also it can be AB=CD pattern that can be complete.

CHZ 4h head and shoulders#CHZ/USDT
$CHZ bearish scenario
price broke down from the neckline of the head and shoulders pattern, and did the pullback to the broken zone.
🐻 so if bears hold the resistance zone, price can drop to the long-term support zone around $0.13 to complete the H&S pattern.

MEGHMANI ORGANICS, jaldi breakout de, hamko panvel nikalna haimeghmani organics, gave a good start returns around its IPO time, earnings are good, and a small cap multibagger company.

FLOW trend lines#FLOW/USDT
$FLOW trend lines show price is inside ascending channel.
🐮 close the daily candle above descending trend line will confirm the continuing bullish trend.
and break out from ascending trend line that now acts as resistance will increase price toward upper ascending trend lines.
🐻 break down from the lowest ascending trend line that acts as support very well will invalidate this scenario.

Gold Daily Chart Measured Move
*Gold Daily Chart Horizontal Market Structure and MM (Measure Move)
*Suitable for H4 and H1 Swing Trade and Finding Short term Bias

TRB trend lines and fib levels#TRB/USDT
$TRB touched 0.5 fib level of weekly swing down and dropped to support zone which is the same with support zone around $20.
🐮 holding above this support zone, and after several days of sideways move between $30 and $20, it can head up to descending trend line which is the same with 0.5 fib level again.
break out from this level will increase price to resistance zone around $60.
🐻 breaking down from support zone will drop price to descending support around $3!!

GOLD - TRADERS WHO USE TRENDLINE, WHERE YOU GUYS AT?BUY POSITION ON GOLD
I have seen this setup with the help of RSI, Trendline, and as well as Multi-TF Analysis.
We have seen the price has bounced off on 1730 key support level yesterday and we took advantage of the bounce play in which we've made 100+ pips.
I have put the SL just below the trendline in case price makes a u-turn.
This is a quick play since my overall bias with gold is still bearish. TP on the retest of our 200EMA (our indicator for long term trend)
1.21RR

TRENDLINE TRADING | Advanced trading lesson Hello traders 👋
Today im sharing my trading strategy with trendlines. It's my first education post, so maybe a lot of mistakes. Please don't take it the wrong way, thank you.
Let's talk about lesson
What are Trend lines?
Trend lines are diagonal lines that are drawn on charts in the financial markets trading. Trend lines are used to highlight , visualize , and make price action easier to analyze on different instruments and assets in the financial market.
How to trade And Use Trend Lines + basic supports.
1. Wait for touch ⌛
When drawing a trendline, the first thing price is check the three times or more. If the price is not checked three times or less, can't draw trendline.
2. Draw ✏️
To draw a trend line, you must choose a time frame. I'm use always bigger than 1 hour timeframe . This is because you want to find the price action for a longer period and not just some light movement.
3. The Basics of Support and Resistance + key levels ✔️
When trading with trend lines, the concept is applied in order to maximise the chances of winning trades.
4. Looking for entry + risk management 💰
Always wait for confirm example; trend line break + price making lower low + pullback + add indicators
🤲 If you like my strategy, Please like and comments. 🤲
Thank you!

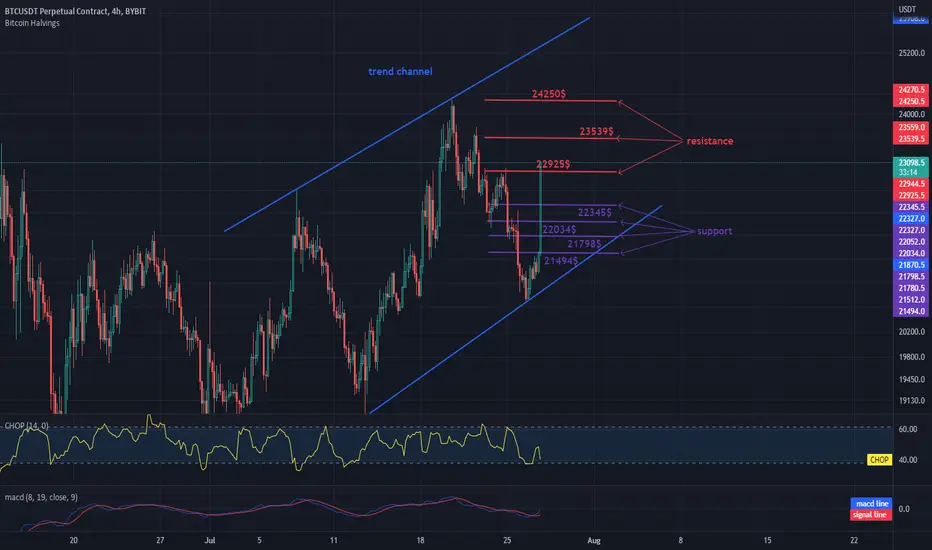
BTC SHORT 4HHello everyone, let's take a look at the BTC to USDT chart over the 4 hour timeframe. As you can see, the price is moving in the uptrend channel.
Let's start with the designation of the support line and as you can see the first support in the near future is $ 22,345, if the support breaks down, the next support is $ 22,034, $ 21,798 and $ 21,494.
Now let's move from the resistance line as you can see the first resistance is $ 22,925, if you can break it the next resistance will be $ 23,539 and $ 24,250.
Looking at the CHOP indicator, we can see that in the 4-hour interval most of the energy has been used, and the MACD indicator shows that we are in a local uptrend.
HOW TO USE TRENDLINE FOR ENTRYIn this video i showed you how to use Trendline for entry in the easiest and simple way.
What do you think about this?
I would like to hear your view, drop your comment.

MATICUSDT trend analysis and potential movementAfter breaking the weekly downtrend (the grey one), MATIC managed to reach the $1 resistance zone with a strong move. Even though it was not quite able to touch $1 and started a correction, I think we are going to see another try to reach there next week.
If you ask how long the current correction can continue, I think it is bound to fall a little more with the break of the 4-hour orange trendline, but this will not last long and the price may start to move up again around $0.72.
DO YOUR OWN ANALYSIS.
DO NOT FORGET MONEY MANAGEMENT.
You might also like:
- Trend Key Points Indicator have been used to draw important key levels and key points.
- You can use Big Moves Indicator to be aware of major moves on the chart by marking them and getting alert for them.

BITCOIN long position 🚀Hello 🐋
Based on the chart, the price is close to important support area and the green trend lines that act as a support for the price ✔️
if
the price does not break the green trend line to the downside, we will see more gain to the upside from our support area like the chart at least to the first resistance are on the chart 📖🚀
our
important support areas are $19700 and $18700
Please, feel free to share your point of view, write it in the comments below, thanks 🐋

Nzdusd technicalanalysis + long termNzdusd technicalanalysis + long term
Elliotwaveanalysics
Supplyanddemand
Wychoff
All are involve

Silver CFD Analyzehello everyone
i think we reach to 38.2% fibo level and also a trendline.
we see two candlestick patterns too.
one bullish engulfing pattern
and one morning star pattern.
so maybe we could grow to 200MA and then correct again.
if you open a position dont forget too set your SL under this trendline
and early bottom u see in chart.
(!!!NOTE!!!
my posts are just my own opinion and you must trade and invest in your own strategy.
be careful and protect your capital first.)
thank you all for your supports

JICPT| HSI Bullish pullback setup on the dailyHello everyone. It's been days to revisit of Hang Seng index.
On the daily chart, we can clearly see that downtrend has been terminated with serious of higher highs and higher lows. As HSI has been down for almost 3 year, it is probably the worst performing stock index in the market. An economic recovery of mainland, as well as inspection completion of the tech giants may attract buyers come in. The valuation looks really attractive. In addition, mean reversion is another reason that I'm bullion on the index.
Technically, index may revisit the uptrend line which is coincided with a nice demand zone.
What do you think? Give me a like if you're with me.


[H4 Signal] ETHUSDT - Consolidation Technical ReversalBINANCE:ETHUSDT
Timeframe: H4
Direction: Long
Technical Confluences for Trade:
- Price action at Multi-Year Horizontal Support Trendline
- Stochastic Oversold momentum
- Widening of the EMAs
- Fib Channel shows Price action at 0.786 Channel level
Suggested Trade:
Entry @ Area of Interest 1400 - 1500
SL: 1371
TP1: 1680 (move SL to Entry level once TP1 is achieved)
TP2: 2000
RR: Approx. 5.69 (Depending on Entry Level)
May the pips move in our favor! Good luck! :D
*This trade suggestion is provided on an advisory basis. Any trade decisions made based on this suggestion is a personal decision and we are not responsible for any losses derived from it.

[Signal] EURJPY: Safe Haven PlayFX:EURJPY
Timeframe: H1
Direction: Short
Technical Confluences for Trade:
- Price action at Resistance of Ascending Channel
- Stochastic Overbought momentum
- Widening of the EMAs
Fundamental Confluences for Trade:
- There is some risk with EUR spiking higher due to the rising inflation situation in Europe but at the same time, global inflation pressure is starting to leave a drag on growth. Risk assets may continue to take a beating and may see some safe haven plays.
- Inflationary pressure is starting to pick up in Japan; may see a change in BOJ's monetary stance (reducing the yield differential between the US and Japan)
Suggested Trade:
Entry @ Area of Interest 139.70 - 140.50
SL: 140.92
TP1: 139.25 (move SL to Entry level once TP1 is achieved)
TP2: 137.85
RR: Approx. 3.30 (Depending on Entry Level)
May the pips move in our favor! Good luck! :D
*This trade suggestion is provided on an advisory basis. Any trade decisions made based on this suggestion is a personal decision and we are not responsible for any losses derived from it.

EURGBP Buy!Hey traders,
Just wanted to let you know I am bout to post some setups, since some of you requested it :)
Keep in mind, this is not my GOLDEN strategy. Let's see if things work out correctly on EURGBP long.
Daily/weekly charts are in consolidation areas, while the 4H states an upward direction. Always trade according the trend.
If you like the input, don't forget to comment, follow or anything. If you feel not comfortable with this, that's totally okay.
Wish you guys all the best at trading!
Entry 0.84958
Exit: 0.84858
TP: 0.85849
SL = 10 pips
TP = 89 pips.
1.8 R:R.

CME gap 9 may 2022Hello friends.
are you okay?
thanks god...
because crypto market open green in monday we can still see it bullish for mid time.
and we have some factors that show this opinion and strenghen our analyze
lets look at them :
1-we can see two important levels of fibo retracement around CME gap.
these levels are 38.2% and 61.8%.
so we have an overlap area here.
2-we have a gap in CME from 9 may 2022.
because of weak momentum market couldnt fill it until now.
but if we breakout this pattern that i illustrate in chart we can fill it!
3-we have an old trendline that can be act as an resistance level there.
4-moving average 55 is here just around levels that cme gap occured.
5-and in the end i see increase in volumes in lower levels of this pattern
and it could be showing that we have good supports in this levels.
.
.
.
dont forget to manage your capital and risk.
.
.
.
if you take a trade you must set a good stoploss.
(NOTE!!! this article is my own opinion and its not a trade advice.
please tarde on your own opinion and use others opinion to improve your
analyze.)
.
.
.
so i will do that.please support me and i wish use your experience
and you can help me to improve my abilities.
thank you all.have good days.
