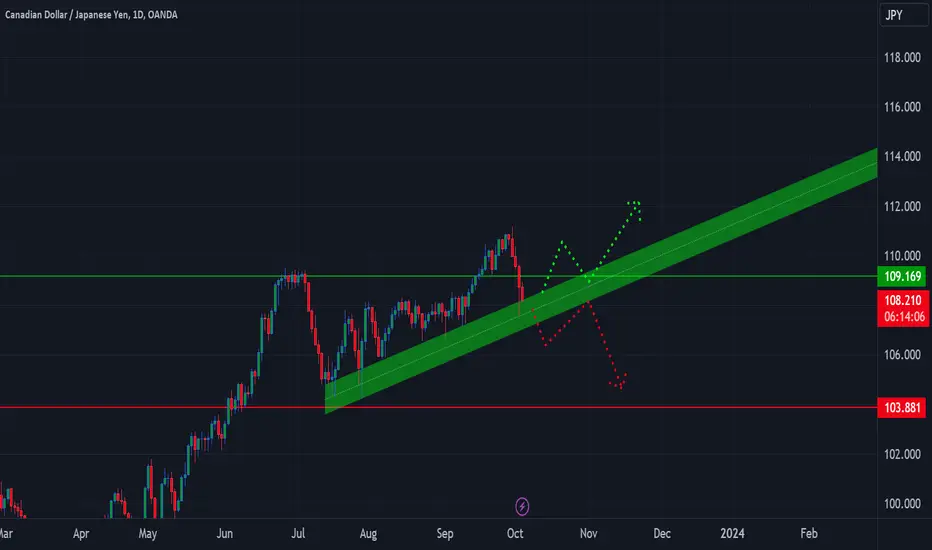
CADJPY: The diagonal line is absolutely important! Hello traders,
Take care of the diagonal line! It's important and we will not short until it's broken. However, 109.200 is also an important line for long trades.
Trendpattern
[INTRADAY] #BANKNIFTY PE & CE Levels(04/10/2023) Today will be gap down opening in BANKNIFTY . After opening if banknifty start trading below 44450 level then possible downside rally of 400-500 points upto 44050 Level. Any Major upside only expected in case banknifty starts trading above 44550 level. also possible Reversal upside 44050 level.

A Reversal Patterns!The candlestick formation pattern indicates the end of the existing downtrend pattern with RSI conforming to the candlestick pattern due to fresh buying on ADVENTA. Yet, the result in volume is not yet significant.
The MACD indicator indicates a reversal pattern towards the uptrend pattern.
Let's save ADVENTA in WL and watch out for significant price movement with the result in volume towards a new peak price.
R 0.500
S 0.400

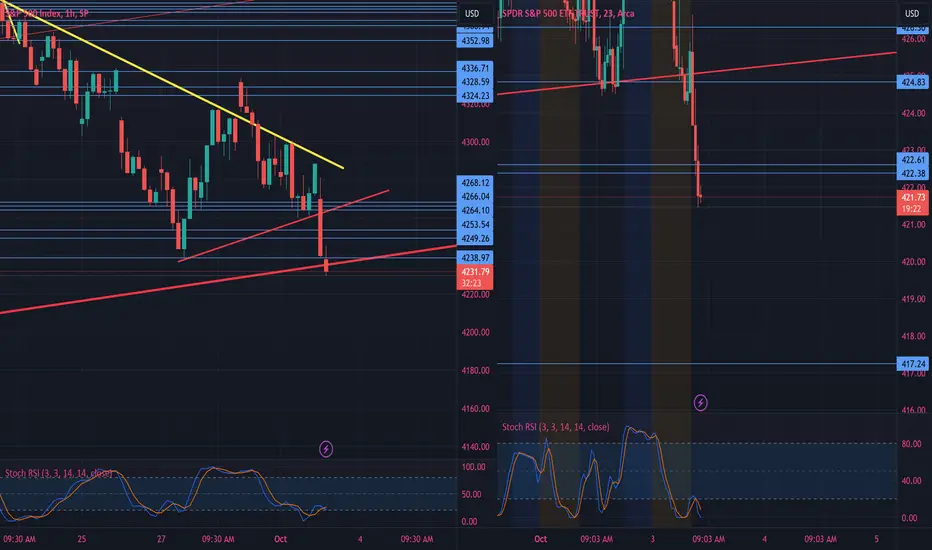
spyThe next real support level on MY charts is that $417 range. However, there is an upward trendline that the entire sp500 spx is just now hitting that goes back to the lowest wick of the bottom that started this Bullish uptrend move months ago. We may very well bounce short term from here and go back retest the drop if the spx can hold the line. In the bigger picture im using pops to load puts for another move down this month before we think about a bigger move back up to test the R's.
Falling Wedge Pattern Reversal in AMBUJACEMAMBUJA CEMENT LTD
Key highlights: 💡⚡
📊On 1Day Time Frame Stock Showing Reversal of Falling Wedge Pattern.
📊 It can give movement upto the Reversal target of Above 440+.
📊There have chances of Breakout of Resistance level too.
📊 After Breakout of Resistance level this stock can gives strong upside rally upto above 485+.
📊 Can Go Long in this stock by placing stop loss below 400- or last swing Low.

Broadening Wedge Pattern breakout in INDIGOINTERGLOBE AVIATION LTD
Key highlights: 💡⚡
✅On 1Hour Time Frame Stock Showing Breakout of Broadening Wedge Pattern.
✅ Strong Bullish Candlestick Form on this timeframe.
✅It can give movement up to the Breakout target of 2475+.
✅Can Go Long in this stock by placing a stop loss below 2380-.

GBPJPY selling opportunityHey there traders,
After last week market shows us nice pattern of selling pressure. Let's see
##Daily
Market broke the strong support zone...
and made retest and shows us a nice rejection candle at the previous support zone.
Bias = Down
##Hourly
Market shows us a nice support zone....
trying to break that zone several times.....but did not
In Monday we expect nice and awesome breakout of that support zone......
After the breakout market will fall nicely....
Good Luck
Follow money management

Bitcoin Weekly Analysis- Sell Signal Below Resistance Trend Line
- Squeeze between EMA 144 and 233
- RSI Picking Up
- MACD Neutral/Descending
Looking back to 2020 we can see a similar pattern.
What this mean?!?....
Well, it can repeat the same pattern that seems more sensible to me or in case of breaking the EMA 233 we will see a continuation of the downtrend towards the $10,000 region.
It was like this throughout September, squeeze between the two EMAs.
We will definitely have a lot of volatility this month and perhaps until the end of the year.

BTC Fib Extensions Cycle to Cyclebare minimum 3.618 pump from cycle to cycle.
Linked my other views on the coin.
Check it out!
NFA
do your own DD

$AMD falling wedge to end today's action. Good signGood sign on NASDAQ:AMD with that falling wedge on the 15 min.
When a stock's been hammered for no reason at all except market volatility, we usually try to look for bullish reversals or bullish signs to enter on a swing.
Closing in a falling wedge is good. Doesn't ALWAYS pay off, but if you are swinging it likely means 4-12 weeks anyway, so it's relatively safe here.
Also looking on the Daily chart, it's right on the bottom of the flag trendline:
Follow for more insights.

Ascending Triangle breakdown in CANFINHOMECANFIN HOMES LTD
Key highlights: 💡⚡
✅On 1Hour Time Frame Stock Showing Breakdown of Ascending Triangle Pattern .
✅ Strong bearish Candlestick Form on this timeframe.
✅It can give movement up to the Breakdown target of 736-.
✅Can Go short in this stock by placing a stop loss above 770+.

Rising Wedge Pattern Reversal in TATACOMMTATA COMMUNICATION LTD
Key highlights: 💡⚡
📊On 1Day Time Frame Stock Showing Reversal of Rising Wedge Pattern.
📊 It can give movement upto the Reversal target of Above 2018+.
📊There have chances of Breakout of Resistance level too.
📊 After Breakout of Resistance level this stock can gives strong upside rally upto above 2325+.
📊 Can Go Long in this stock by placing stop loss below 1785- or last swing Low.

AR/USDT 1-day potential long setupBINANCE:ARUSDT
AR/USDT 1-day potential long setup
The price of AR/USDT broke the previous resistance level of 4.36 and touched 4.60, but failed to sustain the momentum and retreated. It has since consolidated in the range of 4.22 to 4.48, but is now compressed between 4.00 and 4.17. The price has been accumulating in this zone for the past 7 days, suggesting that there is a strong buying interest at these levels.
A long position is now expected in this area, with a target of 4.60 and a stop loss below 4.00. Bullish divergence is also present on the 4-hour chart, which confirms the bullish outlook.
Key technical indicators:
Price: 4.15
Support: 4.00
Resistance: 4.76
Target: 5.20
Stop loss: Below 4.00
Disclaimer: This is not financial advice. Please do your own research before making any investment decisions.

Reversal Rising Wedge pattern in AXISBANKAXIS BANK LTD
Key highlights: 💡⚡
📈 On 1week Time Frame Stock Showing Reversal of Rising Wedge Pattern.
📈 It can give movement upto the Reversal Final target of Below 958-.
📈 There have chances of breakdown of Resistance level too.
📈 After breakdown of Resistance level this stock can gives strong downside rally upto below 680-.
📈 Can Go short in this stock by placing a stop loss Above 1080+.

Accumulated Phase!The candlestick downtrend has probability ended with a fresh buyer which results in volume cross above the MA line.
The MACD and RSI indicate a positive momentum with the price action.
Let's save TEXCHEM in WL and watch out for significant price action movement with a result in volume.
R 0.97
S 0.85

EURCAD ↗️ ↘️ Analysis (double Bottom ) Hello Everyone 🙋🏽♂️
As we could see at the end of the descending channel,
we had Double bottom and the most recommended movement after the This move is a ascending trend, so we had two scenarios her as we could se on the chart,
1️⃣ first one is the ascending trend which is the most common move to this pattern after testing the price 1.43900
2️⃣the second one is the descending move in the rectangle which is it possible movement after the price change the channel movement 1.42700
We are not responsible of any losses for anyone, our trades are profitable more for long terms and we take losses as everyone,
manage your lot size as well and your SL and TP
Don't forget to hit the like bottom and write a comment to support us.
Follow us for more 🙋🏻♂️
Best Regard / EMA Trading .
Disclaimer:
----------------
It's not a financial advise, As everyone we take losses sometime but for long term trading we are profitable traders, so manage your account well with SL and TP and your lot size to keep your account safe and stay in the market .

High PE ratio Kennametal India Ltd. was incorporated in 1938 and is a 75% subsidiary of Kennametal Inc. It manufactures carbide tools and special-purpose machines for automotive, defense, railways, infrastructure and General engineering segments. The manufacturing unit is in Bengaluru.
1) header and shoulder pattern in stock
2) 2680 support for this stock
3) 3450 is target level
4) volume in stock
5) fundmental good stock
6) HIGH PE
No recommendation for buy and sell
Only pure education purpose only

bearish market but breakout chartSundaram Finance Ltd.
SUNDARMFIN NSE
Chart analysis each week
1) Lifetime chart treading in a gloomy market
2) bullish candle and decent stock value
3) stock down from this level in July 2021
4) stock broke down this level the previous week but was not sustained at level
5) stock is now sustained with value and a bullish candle.
6) With a stop loss of 2580, the next target is 4000.
7) SMA 50 is 2600
8) SMA 100 is 2424
9) SMA 200 is 2065
10) There is no buy-and-sell advice.

Others 1W (Crypto Total Market Cap) until end of 2023Sideways until the end of November between 101B and 124B. In December Others Market Cap may jump up to 137B - (false)breakout? Followed by (probably unsuccessful) retest in the second half of December (end of January 2024) falling down to 124B or even lower to 106B.
To be updated in January 2024...

USD/CAD - Key levels to watchTechnical analysis
The price is currently in a downtrend, please see the chart marks and the technical explanation below.
30-minute chart
On the 30-minute chart, USD/CAD is currently in a downtrend. The price is below the 200-period moving average, and the relative strength index (RSI) is below 50. This suggests that momentum is to the downside.
4-hour chart
On the 4-hour chart, USD/CAD is also in a downtrend. The price is below the 200-period moving average, and the RSI is below 50. This suggests that momentum is to the downside on this timeframe as well.
Daily chart
On the daily chart, USD/CAD is in a consolidation phase. The price is between the 50-period and 200-period moving averages, and the RSI is around 50. This suggests that there is no clear direction for the price on this timeframe.
Conclusion
Overall, USD/CAD is in a downtrend on the 30-minute and 4-hour charts, but in a consolidation phase on the daily chart. This suggests that the price is likely to continue to move lower in the short term, but there is no clear direction for the price on the longer term.

Ascending Triangle pattern breakout in AUBANKAU SMALL FINANCE BANK LTD
Key highlights: 💡⚡
✅On 1Day Time Frame Stock Showing Breakout of Ascending triangle Pattern.
✅Strong Bullish Candlestick Form on this timeframe.
✅It can give movement up to the Breakout target of 800+.
✅Can Go Long in this stock by placing a stop loss below 730-.

#NIFTY Intraday Support and Resistance Levels - 20/09/2023Nifty will be gap down opening in today's session. After opening nifty start trading below 20100 level and then possible downside rally up to 19980 in today's session. in case nifty trades above 20140 level then the upside target can go up to the 20260 level.

CADCHF SCALP BUYLast week's weekly candle closed bullish. Looking forward to a continuation up to 0.66700 and a maybe a little higher. I'm also noticing somewhat of a shark pattern on the monthly timeframe which could indicate a larger move up. Stay tuned. Let's have a great week.
