XAU/USD Daily Chart Analysis! Detailed ExplainationMarket Overview:
Gold (XAU/USD) is currently trading around $2,910, showing a slight decline of -0.05% on the daily timeframe. The market has been in a strong uptrend, breaking previous structures and forming higher highs and higher lows. However, the current price action suggests a potential pullback before another bullish continuation.
Key Technical Observations:
1. Resistance & Strong Resistance Zone ($2,950 - $3,000+)
The price has reached a strong resistance zone near the $3,000 psychological level, where selling pressure is evident.
A weak high has been marked, indicating that buyers may attempt to break this level, but sellers could push the price down before any significant breakout.
If price successfully closes above this resistance, it could trigger further bullish momentum towards $3,100 or higher.
2. Support and Demand Zone ($2,750 - $2,800)
The demand zone between $2,750 and $2,800 has historically acted as a strong support level.
This zone aligns with previous price accumulation and a key structural support level.
A pullback to this area could present buying opportunities, as institutional buyers may step in.
3. Market Structure and Breaks of Structure (BOS) & Change of Character (ChoCH)
Multiple Change of Character (ChoCH) points have been noted, signaling shifts in momentum.
The Break of Structure (BOS) suggests a continuation of the prevailing bullish trend, with minor corrections along the way.
The most recent ChoCH indicates a potential short-term bearish retracement before a continuation to the upside.
4. Strong Low and Potential Support Levels ($2,500 - $2,600)
The strong low is marked below $2,500, which acts as a long-term support zone.
If the demand zone at $2,750 - $2,800 fails, the next major support area lies around $2,600.
However, given the overall bullish trend, a drop to these levels would likely be short-lived unless macroeconomic factors shift significantly.
Potential Price Scenarios:
🔵 Bullish Scenario (Primary Outlook)
Price may retrace towards the $2,750 - $2,800 demand zone.
If buyers defend this level, we can expect a bullish reversal towards $2,950 - $3,000 resistance.
A strong breakout above $3,000 would likely trigger further upside momentum towards $3,100+.
🔴 Bearish Scenario (Alternative Outlook)
If sellers take control and push price below the $2,750 support, further downside could follow.
In this case, the next major support levels would be $2,600 - $2,650, where buyers may re-enter.
A breakdown below $2,500 would signal a shift in long-term market structure, invalidating the bullish trend.
Trading Plan & Strategy:
✅ For Long Entries:
Look for bullish price action (e.g., pin bars, bullish engulfing candles) in the $2,750 - $2,800 demand zone.
Target $2,950 - $3,000 as the first take-profit level.
If price breaks above $3,000, hold positions for a move towards $3,100 or higher.
❌ For Short Entries:
If price struggles to break above $3,000, short positions can be considered with stop losses above resistance.
Targets for short trades: $2,800 (first TP), $2,650 (second TP).
Final Thoughts About Trend:
Gold remains in a strong bullish trend, but a short-term retracement could be expected before the next rally. Traders should focus on key levels like $2,750 - $2,800 support and $3,000 resistance to confirm the next move. Watch for confirmation signals before entering trades. 📊🚀
Trendpattern

BTC/USDT UpdateBitcoin is back to our $85-$86 support level.it is an importantlevel due to the 200 day Ema and trendline support.
another key level is the 200-day MA support,which also aligns with te SBR FOMO low $81.5k

GBP/USD - Institutional Backed Long Setup📌 Trade Execution & Technicals
Pair: GBP/USD
Timeframe: 15M
Trade Type: Long Position
Entry: 1.2816 – Price rejected key Fibonacci retracement level (0.62 Fib) after a liquidity sweep
Stop Loss: Below 1.2800
Take Profit Levels:
TP1: 1.2862 (-0.27 Fib extension) ✅ Target
TP2: 1.2883 (-0.62 Fib extension) ✅ Target
Technical Confluence:
Fibonacci Retracement Levels: Price bounced off the 0.62 retracement (1.2816)
Market Structure: Higher low formation confirmed bullish continuation
Institutional Liquidity Grab: Price swept sell-side liquidity before reversing bullish
📊 Trade Outcome
✅ High-Probability Long Setup
Both TP1 & TP2 levels hit with strong bullish momentum
Risk-to-Reward Ratio (RRR) > 1:3
Price action confirmed bullish institutional positioning
🌍 High-Impact News That Influenced GBP/USD
UK S&P Global Services PMI (Actual: 51.0 vs Forecast: 51.1) – Slightly weaker, but still expansionary
US ADP National Employment (77K vs Forecast: 140K) – Weaker than expected, USD pressured
BoE Treasury Select Hearing (Hawkish Bias) – Supporting GBP strength
US ISM Manufacturing Prices & Business Activity Upcoming – Expected to increase USD volatility
💡 News Summary:
Weaker-than-expected US jobs data pressured the USD, providing momentum for GBP/USD upside
GBP remained resilient despite mixed PMI data, benefiting from USD weakness
📈 Volatility & Liquidity Insights
🔍 Prime Market Terminal Key Data:
GBP/USD Average True Range (ATR):
1-week ATR: 0.81%
1-month ATR: 0.86%
Institutional Liquidity Insights:
High liquidity buildup in the 1.2800-1.2820 range, acting as support
Strong order flow pushing GBP/USD higher post-US employment data release
🏦 Institutional Positioning & Market Flow
📊 Commitment of Traders (COT) Data & Smart Money Insights:
Dealer Positioning:
GBP Net Positioning: +56,707 contracts (Bullish institutional sentiment)
USD Net Positioning: -11,542 contracts (Bearish outlook on USD)
Open Interest & Retail Sentiment:
Retail Short Bias: 72% Short, 28% Long – Potential short squeeze
Smart Money Accumulation Zone: 1.2800-1.2820
📌 Conclusion
🔹 Why This Trade Worked:
✔ Liquidity Grab Below 1.2816 Before Reversal
✔ Institutional Positioning Confirmed Bullish Momentum
✔ Weaker US Jobs Data Weighed on USD, Pushing GBP/USD Higher
🚀 Next Steps:
Monitoring 1.2860 for continuation towards 1.2900 key level
Watching upcoming US ISM data for potential volatility spike
🔥 What’s your outlook on GBP/USD? Comment your thoughts below!

EURGBP at major support zone: Bullish Rebound ExpectedOANDA:EURGBP is approaching a significant support zone, highlighted by previous price reactions and strong buying interest. This area has historically acted as a key demand zone, increasing the likelihood of a bounce if buyers step in.
The current market structure suggests that if the price confirms support within this zone, we could see a bullish reversal. A successful rebound could push the pair toward the 0.83350 level, a logical target based on past price behavior and structural confluence.
Just my take on support and resistance zones—not financial advice. Always confirm your setups and trade with solid risk management.
Best of luck!

USDJPY - at potential Buy SetupOANDA:USDJPY is nearing a significant support area that has reversed bearish trends into bullish momentum. This support level aligns with prior price reactions and represents a strong foundation for potential upward moves.
If buyers confirm their presence with bullish price action, such as long lower wicks or bullish engulfing candles, I expect the price to go toward 151,100. Also, a break below this support could signal further bearish continuation.
Just my take on support and resistance zones—not financial advice. Always confirm your setups and trade with solid risk management!

$CRM short setup part two. $280 target.Check out my recent post on $CRM. This name is down from it’s highs already 11% or so but 20% is correction territory so I can see this name hitting $280 area. $280-$285. Multi day put swing.
WSL

CAD JPY Entry Setup 30 mins timeframe.CAD JPY has formed a bullish break and retest pattern that also align with Fib Retracement level.
Now we wait for entry confirmation.

IS THIS FINALLY THE END OF BREAKDOWN VINE TO THE MOON..IS THIS FINALLY THE END OF THE BREAKDOWN VINE TO THE MOON..
Vine did break down hugely.. but it still has possibles to return.. is this going to happen from this bottom?
We are going to follow it.
We expect there can come a moment when this vine will find the break up $0,06

$INTU calls for retest, B+ setupNASDAQ:INTU — looking really good here, green close on the daily and a green closing candle on the weekly.. I see a retest of $600 coming I think before earnings next week 2/25 I think it is. I like calls for this. Very nice setup.

To fade or not to trade? (Example: EUR/USD)There is a correction taking place in the US dollar uptrend. Do we trade against the prevailing trend, or sit on our hands and do nothing? To fade or not to trade, that is the question.
On a surface level, the current environment is a trading range - following a long downtrend.
When a strong major trend has been in place for around 3 months - sometimes sooner - sometimes later (we have observed 3 months as a good benchmark) something has to change - either there is a significant correction or the trend reverses.
The challenge lies in distinguishing between the two. Reacting too early risks fighting momentum, while reacting too late means missing an opportunity.
After years of trading, I’ve realised the goal is not to guess – but to follow a structured trading system that tilts the odds in our favor. The system doesn’t work every time of course but it gives you a way to approach the market.
Let me outline now - a system using Fractals & the 30-Week Moving Average to help you decide which way to trade the market
1. Identify the Primary Trend
Use the 30-week moving average (30 WMA) as the trend filter.
Uptrend: Price is consistently above the 30 WMA, and the slope is rising.
Downtrend: Price is consistently below the 30 WMA, and the slope is falling.
A strong trend remains in place as long as price respects the 30 WMA. A violation suggests a shift is possible.
2. Look for Fractal Confirmation of a Shift
In an uptrend, a higher low followed by a higher high confirms continuation.
In a downtrend, a lower high followed by a lower low confirms continuation.
* The key fractal to watch for a potential bottom after a downtrend – is the first higher low after a downtrend correction that made a higher high (potential bottom)
* The key fractal to watch for a potential top after an uptrend – is the first lower high after an uptrend correction that made a lower low (potential reversal)
So, how about what’s happening now?
The weekly chart shows a base has formed at 1.02 in EUR/USD.
Price closed last week right at support-turned-resistance around 1.05.
A ‘higher high’ was formed followed by a ‘higher low’ as demonstrated by the green and red fractals accordingly.
However, the price remains below the 30-week moving average.
We can see the setup better on the daily chart as a shallow downtrend line.
The pattern beneath the trendline is a messy inverse head and shoulders. As such, should the trendline break to the upside it is a bullish signal. And if the trendline holds, it signals the trend is still just consolidating before a continuation lower.
We think there’s a good chance this trendline breaks given the alignment of the weekly fractals.
So fade the downtrend or ignore the move upwards?
To answer that it helps to think about the next step. If the price does break higher, how high is it likely to go? There is resistance at 1.06 from the late November and December peaks. Then the 50% Fibonacci retracement and the 30-week moving average come in around 1.07.
The reason fading a trend has a lower probability of success vs trading with the trend is because there is so much nearby resistance (in the case of trading a bottom).
You can absolutely fade this trend but our experience tells us the price often fails at a nearby resistance level, capping the risk:reward potential on long positions- and simultaneously offering a nice opportunity for short positions.
But - as always - that’s just how the team and I are seeing things, what do you think?
Share your ideas with us - OR - send us a request!
Drop us a comment!
cheers!
Jasper

USDJPY - Demand Ready for Lift-Off (Technical Analysis)As it stands we're currently holding short positions on USDJPY since last week.
The current short term still suggests that this pair is bearish -
We have seen lower lows and institutional manipulation to the upside as well, so we will continue holding our shorts until we see a reversal on the lower time frames.
Previous Analysis:
We traded down to the Daily demand levels (which price has now reached).
The current price cycle indicates it's still distributing but now is the time to watch for potential bullish reversals - more-so when we combine this with our DXY analysis as well as current Geopolitical moves, we could definitely see a bullish surge in the next few days.
Trading Considerations:
All signs point to a pending bullish reversal, don't engage without considering the LTF trend, we would ideally like to see it reverse first.
Trade what you see, not what you think you might.
Disclaimer: This analysis is for informational purposes only and does not constitute financial advice. Trading involves substantial risk and may not be suitable for all investors. Conduct your own research and consult with a financial advisor before making any investment decisions.
OANDA:USDJPY TVC:DXY

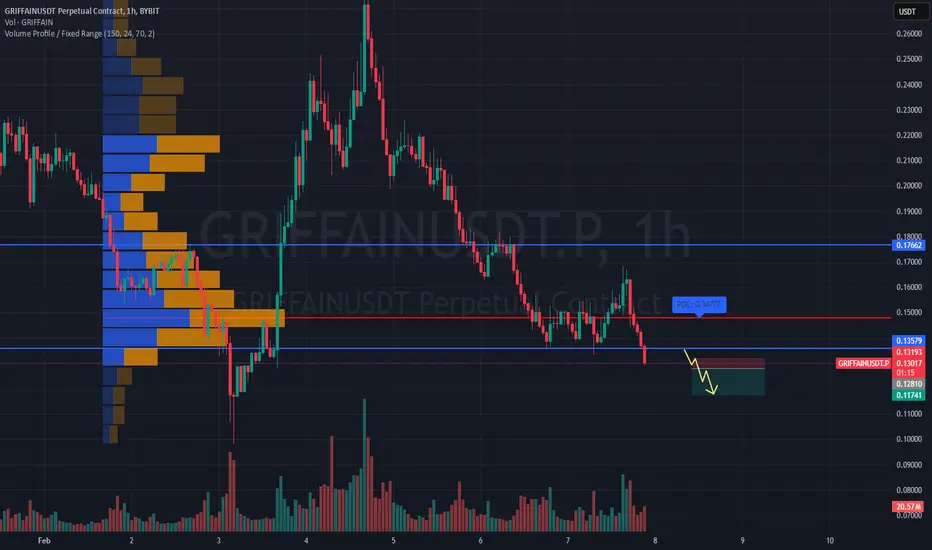
SHORT #GRIFFAINUSDT expecting further downside📉 SHORT BYBIT:GRIFFAINUSDT.P from $0.12810
🛡 Stop loss $0.13193
⏱ Timeframe: 1H
✅ Overview:
➡️ BYBIT:GRIFFAINUSDT.P is showing weakness after reaching a local high, rejecting from a resistance zone.
➡️ POC (Point of Control) at 0.13193 acts as a key volume area with significant trading activity.
➡️ Price action suggests seller dominance, indicating a potential continuation of the downtrend.
➡️ If the 0.12810 support level breaks, expect an increase in bearish momentum.
⚡ Plan:
➡️ Short entry upon confirmation of a breakdown below 0.12810.
➡️ Increased selling volume will confirm the continuation of the bearish trend.
➡️ Holding the position with dynamic monitoring until the first Take Profit level.
🎯 TP Targets:
💎 TP 1: 0.11741 – first target based on the nearest support level.
📢 BYBIT:GRIFFAINUSDT.P is showing bearish signs, but volume and pullback dynamics should be monitored.
📢 A break below 0.12810 could trigger a deeper decline.
📢 If buyers show strength, watch 0.13193 as a possible reversal point.
🚀 BYBIT:GRIFFAINUSDT.P maintains bearish momentum — expecting further downside!
#BILLYUSDT expecting further decline!📉 SHORT BYBIT:BILLYUSDT.P from $0.00367
🛡 Stop Loss: $0.00390
⏱ 1H Timeframe
📍 Overview:
➡️ BYBIT:BILLYUSDT.P continues to trend downward, forming new local lows. After retesting the $0.00387 zone, the price failed to hold and dropped again, confirming seller dominance.
➡️ POC (Point of Control) at $0.00475 shows the highest liquidity area, positioned above the current price. This confirms a bearish market sentiment, as major trading activity is still concentrated at higher levels.
➡️ A breakdown of support at $0.00367 strengthens the downtrend, opening the way toward $0.00336, where buyers previously showed interest.
➡️ If the price holds below $0.00367 , further downside movement is likely, with increasing sell pressure.
⚡ Plan:
➡️ Enter short after confirming a breakdown below $0.00367 , signaling further downside.
➡️ Risk management through Stop-Loss at $0.00390 , placed above the nearest resistance zone.
➡️ Primary downside target – $0.00336, where buyers may step in.
🎯 TP Targets:
💎 TP 1: $0.00336
🚀 BYBIT:BILLYUSDT.P remains weak — expecting further decline!
📢 BYBIT:BILLYUSDT.P remains in a strong downtrend with no signs of buyer recovery. If the $0.00367 level is broken with increasing volume, the decline may accelerate.
📢It's crucial to watch the reaction at $0.00336—if significant buying interest appears, a short-term bounce is possible.
📢However, in the long term, there are no clear reversal signals yet, and long positions should be approached with caution.

USDJPY - SHORT - 02/02/25On the daily timeframe, USDJPY is still on a retracement. This idea is based off of looking to continue with this trend and reach the daily tf FVG marked.
On the 30min, price has been reaching higher towards a 30min Order Block. This order block meets the criteria: 1.Swept Liquidity 2. Break of Structure 3. Prescence of Structural Liquidity.
The target being the previous structural low, with hopes of price continuing further down.

Earnings BreakoutI love the earnings season. During earnings season we see great setups that are tradable almost every day.
This is also the case today with RCL . Breakout under enormous volume and high relative strength. NYSE:RCL

GBPUSD - Bullish Break + Demand ZoneHello traders
GBPUSD broke the daily trendline that was holding it in a downtrend. After this break, GU is looking bullish. But please note that this could be a fakeout.
After this break, price left an fvg on the daily timeframe and a demand zone on the 4H.
This is the daily chart with the breakout
I am looking to take a trade on the demand zone expecting price to go up.

Corporate earnings Versus SPXCorporate earnings and stock market getting balanced after 50 years weighted to M2 or money supply. We are entering a bubble territory.

USDILS - At Clear Support Zone. Towards 3.61000?FOREXCOM:USDILS is at a support zone that has consistently acted as a reversal point for bearish trends. The current market structure suggests that this support zone could once again provide a potential buying opportunity—provided that there is clear bullish confirmation.
If buyers confirm their presence with signals like long lower wicks or bullish engulfing patterns, we could see a move toward 3.61000.
However, a break below this support would invalidate the bullish scenario and signal potential for further declines.
Key Levels to Watch:
Bullish Target: 3.61000
Stop Loss: Below the support zone
Patience is crucial—wait for clear bullish confirmation before entering long positions. What’s your view on this setup? Share your thoughts in the comments!

Gold Price Forecast: Key Levels to Watch !!Gold Price Analysis: 🔑 Key Zones and 📉 Potential Reversal at MA200
1️⃣ Resistance Zone 🟥:
The red-highlighted area marks a strong resistance zone. A breakout 🚀 above this level could lead to bullish momentum.
2️⃣ Liquidity Zones 💧:
The "In LQ" region shows where liquidity may be resting, suggesting possible retracements or reversals near this point.
3️⃣ 200 EMA Support 📊:
The MA200 (2,734.059) is a critical support level. A breakdown 🔻 here could send prices lower, testing further support levels.
📈 Potential Scenarios:
🔼 Bullish: Break above resistance 🟥 with higher highs.
🔽 Bearish: Rejection from resistance 🟥 leading to a drop toward the MA200 support 📉.
Watch these levels closely! 🔎

$CRM $340 lagger in AIHello, I like this name for a pickup speed off the new presidency, CEO love and support for Trump and I personally like the technical setup here. $340c short term, 1/31 or out further.
In $2.07.
WALL ST. LOSER

BTC/USDT Analysis: Bitcoin Riding the Waves of Optimism As we dive into this BTC/USDT chart, it’s clear that Bitcoin is not just a cryptocurrency—it’s an art form. The chart showcases a detailed Elliott Wave analysis, complete with corrective W-X-Y patterns and impulsive waves screaming, “I’m going places!” Let’s break it down step by step.
The Elliott Wave Breakdown
Bitcoin has been playing out its Elliott Wave structure with the precision of a virtuoso pianist. Here’s what we’re looking at:
1. Wave (1) to Wave (5): A Symphony of Higher Highs.
2. Wave (1) was the opening act, starting the bullish rally.
3. Wave (2) provided a dramatic correction, retracing as deep as a poet’s feelings on a rainy
day.
4. Wave (3) emerged as the headliner, the longest and strongest wave, with Bitcoin shouting,
“Catch me if you can!”
5. Wave (4), our consolidation buddy, is taking a breather, making sure BTC doesn’t exhaust
itself before the final sprint.
6. Wave (5) looks ready to take the stage and hit the projected target of $128,647.56. The bulls
seem to be prepping their rockets for this one.
2. The W-X-Y Correction
Before the current rally, BTC went through a complex W-X-Y correction. Think of it as Bitcoin saying, “Let me stretch a bit before the next marathon.” This correction has set the stage for the bullish impulses we’re seeing now.
Indicators: The Whispering Bulls
1. Williams %R and Stoch RSI: Hidden Bullish Divergences
Both indicators are practically screaming “hidden bullish divergences” like fans at a rock concert. These signals suggest that the bulls are working behind the scenes, setting the stage for the next big move.
2. RSI: Staying Strong
The RSI remains comfortably above 50, signaling that the bullish momentum is intact. It’s like Bitcoin is cruising down the highway, windows down, music blasting, and no signs of slowing.
The Price Target: To $128,000 and Beyond!
Bitcoin has been known to defy expectations. While $128K might feel like aiming for the moon, let’s not forget—this is Bitcoin, and the moon is just the first stop.
Key Levels to Watch
1. Support Zones
The $80,000 level is a key psychological support. If Bitcoin revisits this area, it could serve as a launchpad for the next leg up.
2. Resistance Levels
The $100,000 mark will likely be a battle zone. Expect bears to put up a fight here, but with the momentum we’re seeing, the bulls might just plow through.
In Conclusion: Strap In, Bulls
Bitcoin is looking bullish on all fronts. The Elliott Wave structure, hidden bullish divergences, and strong RSI readings all point to higher prices in the near future. However, as always, remember that markets love surprises, and it’s always good to keep your risk in check.
For now, though, it looks like Bitcoin is preparing for a grand finale. Let’s hope the bulls keep the momentum going because $128,647 is calling, and Bitcoin seems eager to answer. 🚀
Disclaimer: NOT FINANCIAL ADVISE!

USDZAR - Potential Short from Key Resistance ZoneThe USDZAR pair is currently trading near a significant resistance zone around the 19.10300 level. Historically, this area has acted as a key turning point, where sellers have stepped in to push prices lower. The recent approach toward this resistance suggests a potential bearish scenario if price action confirms a rejection.
A clear rejection pattern, such as bearish engulfing candles, long upper wicks, or other signs of selling pressure, could indicate the start of a downward move. If this scenario unfolds, the price may head toward the 18.62617 target level, aligning with a potential corrective phase in the market.
This setup reflects the broader expectation of a pullback within the existing market structure. Traders should closely monitor price action at the resistance zone for confirmation signals before entering positions.
Feel free to share your thoughts or any additional insights!

"LONG" NIFTY 50 is approaching The "Accumulation Zone" (LTCIG)1. Key observation
Accumulation Zone 🟢
The chart identifies a critical "Accumulation Zone" between 22,600–22,800, highlighted in green.
This area serves as a strong support zone where buyers may step in, halting the current downtrend.
Significance: If NIFTY consolidates here, it could build momentum for a powerful reversal and potentially new all-time highs. 🚀
2. Notes on NIFTY Movement ✍️
"NOTE: NIFTY HAVE TO COME IN THIS ZONE FOR FLY UPWARD NEW HIGH" 🛫
This means for NIFTY to reach new heights, it must revisit and hold this accumulation zone.
Watch for bullish patterns like hammer candlesticks or breakouts in this region to confirm upward movement. 🔥
3. Best Price Range for Investments 💰
"BEST PRICE RANGE TO DO A LONG-TERM INVESTMENT" 🏦
Investors can find opportunities in this zone, with stocks available at significant discounts (40–60% off).
A perfect time for those planning long-term gains as the zone may represent undervaluation. 📈
4. Technical Indicators 🔍
RSI (Relative Strength Index):
Positioned near the oversold zone, indicating the downtrend is losing momentum and reversal is likely. ⚡
MACD (Moving Average Convergence Divergence):
The histogram shows weakening bearish momentum, further supporting the case for a reversal. 🔄
5. Resistance and Breakout Levels 🟡
If NIFTY holds the accumulation zone, key resistance levels to watch:
23,300 and 23,700.
Breaking these could pave the way for new all-time highs! 🌟
6. What to Watch For 👀
Volume Confirmation:
A spike in buying volume around this zone will validate accumulation and signal strong upward momentum.
Price Action:
Look for bullish candlestick patterns like hammers, engulfing, or inside bars.
Conclusion 🏁
NOTE↣ NIFTY 50 is approaching a pivotal moment. The "Accumulation Zone" offers an opportunity for traders and investors alike. 📉➡️📈
If this zone holds, expect a potential reversal with NIFTY aiming for new highs. 🚀🔥
Keep an eye on price action, volume, and RSI to confirm the trend! Happy Trading! 💹
🔴Disclaimer:
I am not a SEBI-registered advisor. This analysis and the suggested levels are for educational purposes only.Investments and securities are subject to market risk. Please carefully assess your risk tolerance before making any decisions.
If you really like this idea please iike,share,subscribe @Alpha_strike_trader
