EURJPY Potential SELL SetupPotential sell setup on EURJPY is in view
This play will probably break the low one more time
Trendpattern

Today trend gold bearishI just analyse the all global data and its, so powerful news come from all around the different countries in fear of USA will be in recession stage. japan maket crash in a single day make low of his history and Taiwan market crash rapidly and India make history low value of Indian currency.
my scenario now market make low lower then low of this bull rally will end i think You take sell position around 2400.00 and make your stock loss around 2420.00 make take profit different level my target 2365.00. if its break definitely its make more low level.
2390.00
2385.00
2375.00
2365.00
Take profit 2 hit then you will move your entry price is your stock loss.
use small lot size on chart market make manipulation so be carefull.

Flag Pattern Alert: Gold's Big Decision!Now that the title got your attention! Take some time to fully digest the market breakdown below where we cover this further in depth!
1. Price Structure:
- Downtrend: The chart shows a significant downtrend from the left side, leading to a series of lower highs and lower lows, which is a classic bearish structure.
- Consolidation/Flag Formation: After a strong bearish move, the price appears to be consolidating within a flag pattern, as indicated by the 15-minute and 1-hour flag formations.
This is typically a continuation pattern, suggesting that the market might continue in the direction of the previous trend (downwards).
2. Key Levels:
- Daily LQZ (2,474.774): This is a higher time frame liquidity zone. Price is currently below this level, indicating that there might be significant resistance here.
- 4HR LQZ (2,459.094): This zone is also above the current price, acting as potential resistance. A move towards this zone might face selling pressure.
- 1HR LQZ (2,445.648): This is a closer resistance level, just above the current price action, within the range of the flag pattern. A breakout above the flag might target this LQZ.
- 15M LQZ (2,415.863): Price is currently hovering around this level, indicating that the market is at a critical point where it could either bounce or break lower.
- 1HR LQZ (2,402.417): If the price breaks down from the current flag, this level could act as the next target/support.
3. Potential Scenarios:
- Bullish Scenario (Green Arrow):
- Breakout of the Flag: If the price breaks out upwards from the flag formation, it could signal a reversal or a correction within the larger downtrend.
- Target Levels: The price might aim for the 1HR LQZ at 2,445.648 first, with potential further movement towards the 4HR LQZ at 2,459.094, and eventually towards the Daily LQZ at 2,474.774 if bullish momentum continues.
- Bearish Scenario (Orange Arrow):
- Breakdown from the Flag: If the price breaks down from the flag pattern, it would confirm the continuation of the bearish trend.
- Target Levels: The immediate target would be the 1HR LQZ at 2,402.417, followed by the next lower Daily LQZ at 2,355.819.
4. Market Phases:
- Impulsive and Corrective Phases:The downtrend before the flag can be considered an impulsive phase, while the flag pattern itself represents a corrective phase. Understanding these phases can help anticipate the next move.
5. Lower High Formation:
- The chart also marks a “Lower High” within the flag formation. This suggests that the bulls are struggling to push the price higher, which is a bearish signal, reinforcing the likelihood of a breakdown.
6. Volume Analysis:
- Volume Support: The volume seems to be lower during the flag formation compared to the preceding downtrend, which is typical in a consolidation phase. A breakout with strong volume would give more validity to the direction.
7. Conclusion:
- Bullish Bias: If the price breaks out of the flag with strong momentum and volume, a short-term bullish move towards the higher LQZs can be expected.
- Bearish Bias: The overall trend and the formation of a lower high suggest a bearish continuation. If the price breaks down from the flag, the bearish scenario could play out with targets towards the lower LQZs.
This breakdown gives you a structured view of the current market conditions on this chart. As always, consider combining this technical analysis with other factors like market sentiment, fundamental analysis, and your risk management strategies.

The doomsday retracementWow, what a week it has been. SPX down 3.5% and up 2.5% the day after.
My thought is this backtrack is going to be the biggest retracement for the drop, just like we saw on bitcoin. APPL seems to have DOJ issues, NVIDIA chip issues in Taiwan... all seems to be lining up for potential lower for longer. My only buy this year will be TSLA. More on that.
Goldilocks is not going to bring us back to pre-pandemic levels, rate cuts are not going to save the market. The narrative has already changed on July 17th when Trump said he didn't want to invade Taiwan, good luck buying after august.


Gold Traders Alert: Crucial Levels to Watch for the Next Trade!Key Components:
Chart Type and Pair:
The chart is a 1-hour (1H) timeframe for the Gold Spot/U.S. Dollar (XAU/USD) pair.
Support and Resistance Levels:
Horizontal Resistance Line at $2,446.18: This is labeled as "1HR LQZ" (1-hour liquidity zone), indicating a significant resistance level where price might face selling pressure.
Horizontal Support Line at $2,347.82: Also labeled as "1HR LQZ," indicating a significant support level where the price might find buying interest.
Trend Lines:
There are descending yellow trend lines drawn, indicating a downtrend. The lower yellow trend line has a label suggesting a "Potential 3rd Touch," which typically indicates a possible point for a bounce or reversal.
Price Action:
The recent price action shows a lower high (LH) formation near $2,446.18, suggesting a downtrend continuation.
Two potential scenarios are sketched on the right side of the chart with different colored lines (orange and green) depicting possible future price movements.
Analysis:
Current Trend:
The overall trend appears to be bearish due to the formation of lower highs (LH) and lower lows (LL).
Support and Resistance:
The price is currently trading between two significant levels ($2,446.18 and $2,347.82). Breaking either level with strong momentum could indicate the next directional move.
The price nearing the lower yellow trend line for a potential third touch suggests a possible bounce. If the price respects this trend line, it could indicate a temporary support.
Potential Scenarios:
Bullish Scenario (Green Path):
If the price finds support at the lower yellow trend line and the horizontal support at $2,347.82, it might bounce back towards $2,446.18. Breaking above this level could lead to a further rise.
Bearish Scenario (Orange Path):
If the price fails to hold the support at the yellow trend line and $2,347.82, it might continue to fall. A break below this support level could lead to further declines, targeting lower support levels not shown in the chart.

Potential GBPUSD Sell setupWe bought GBPUSD during NFP
Today we are seeing a sell setup on GBPUSD
Lets follow the market as it makes data available

New trade setup before USA ISM DATA XAU/USD buy now 2370.00 and TP 1 2375.00 TP 2 2380.00 TP 3 2385.00 TP 4 2395.00 and stock loss around 2355.00 i dont have enough time to update this why the reason just do it.

Falling Wedge pattern breakout in AWLADANI WILMAR LTD
Key highlights: 💡⚡
✅On 1 Day Time Frame Stock Showing Breakout of Falling Wedge Pattern.
✅Strong Bullish Candlestick Form on this timeframe.
✅It can give movement up to the Breakout target of 444+.
✅Can Go Long in this Stock by placing a stop loss below 344-.

Gold Price Explosion? Key Patterns Indicating Major Moves Ahead!Technical Breakdown of XAUUSD
Overview
The chart presents the price action of Gold Spot (XAUUSD). Key technical patterns and significant support/resistance levels are highlighted to provide insights into potential price movements.
Key Patterns and Levels
Descending Channel:
The price previously moved within a descending channel, marked by lower highs (LH) and lower lows (LL), indicating a downtrend.
The breakout from the descending channel suggests a potential shift in momentum from bearish to bullish.
Support/Resistance Levels:
HTF (Higher Time Frame) Support/Resistance: A crucial level providing a foundation for significant price movements, shown with blue lines.
LTF (Lower Time Frame) Support/Resistance: A lower time frame level within the channel, highlighting short-term price actions.
1HR Double Top: A resistance level around 2458.3 where the price is currently facing a decision point.
Bullish Patterns:
3 Touch Flag: A bullish flag pattern with three touches indicating potential continuation if the price breaks above the resistance.
Daily Bull Flag: A larger time frame bull flag pattern suggests a bullish continuation if the price breaks above the upper boundary.
Liquidity Zones:
Weekly LQZ: A liquidity zone around 2484, which acts as a significant resistance level.
Daily LQZ: A zone around 2348.8 providing a major support level.
Current Market Conditions:
The price is currently testing the 1HR double top resistance. A rejection at this level could indicate a potential short position, while a clear break above could confirm a long position.
Trading Strategy:
Wait for Confirmation: Traders should wait for a clear rejection or break above the 1HR double top to determine the direction of their positions.
Monitor Key Levels: Keep an eye on the support/resistance levels and liquidity zones to gauge potential price movements and market sentiment.
Conclusion:
Gold is at a critical juncture with significant patterns indicating possible major moves ahead. Traders should closely monitor the 1HR double top and key support/resistance levels to make informed trading decisions.

Bullish Flag pattern breakout in TATACONSUMTATA CONSUMER PRODUCT LTD
Key highlights: 💡⚡
✅On 1 Hour Time Frame Stock Showing Breakout of Bullish Flag Pattern.
✅Strong Bullish Candlestick Form on this timeframe.
✅It can give movement up to the Breakout target of 1340+.
✅Can Go Long in this Stock by placing a stop loss below 1167-.

This Simple Error Cost Me Big on XAUUSD! Learn From My Mistakes!Key Levels and Zones
Highs and Lows:
HH (Higher High) and LH (Lower High) are marked on the chart.
The chart shows a recent HH and LH indicating a bullish trend with a potential pullback.
Liquidity Zones (LQZ):
4HR LQZ at 2474.891: This zone might act as a significant resistance level.
4HR LQZ at 2432.126 - 2432.046: This zone was previously a resistance level that may now act as support.
4HR LQZ at 2348.453: Another support zone lower on the chart.
Daily Bull Flag:
A daily bull flag is drawn, suggesting a potential continuation of the bullish trend if the price breaks out upwards.
Trading Plan
Identify Key Zones:
Mark key support and resistance levels on your trading platform.
Wait for Confirmation:
Look for confirmation signals (candlestick patterns, volume spikes) before entering a trade.
Set Alerts:
Use trading alerts to get notified when the price reaches key levels.
Risk Management:
Always use a stop loss to protect your capital.
Ensure your risk-reward ratio is at least 1:2.
Review and Adjust:
Regularly review your trades and adjust your strategy based on market conditions.

XAUUSD - 2393 points breaking the trendGold declined near $2,380 per ounce on Tuesday, extending losses from the previous session, as investors look forward to upcoming policy meetings from major central banks this week. The Federal Reserve is anticipated to keep interest rates unchanged on Wednesday, but all eyes will be on any indications of a potential rate cut in September. Meanwhile, the Bank of Japan is expected to lift rates by 10 basis points to 0.1%
Upper border breakout: 2393 - 2400
Lower border breakout: 2376 - 2370
Resistance: 2400 - 2407 - 2412 - 2418
Support: 2376 - 2367 - 2361 - 2353
Price ranges to note:
SELL price range 2417 - 2419 stoploss 2422
BUY price range 2354 - 2352 stoploss 2348
Note: Full TP, SL to be safe and win the market.
GOOD LUCK EVERYONE👍

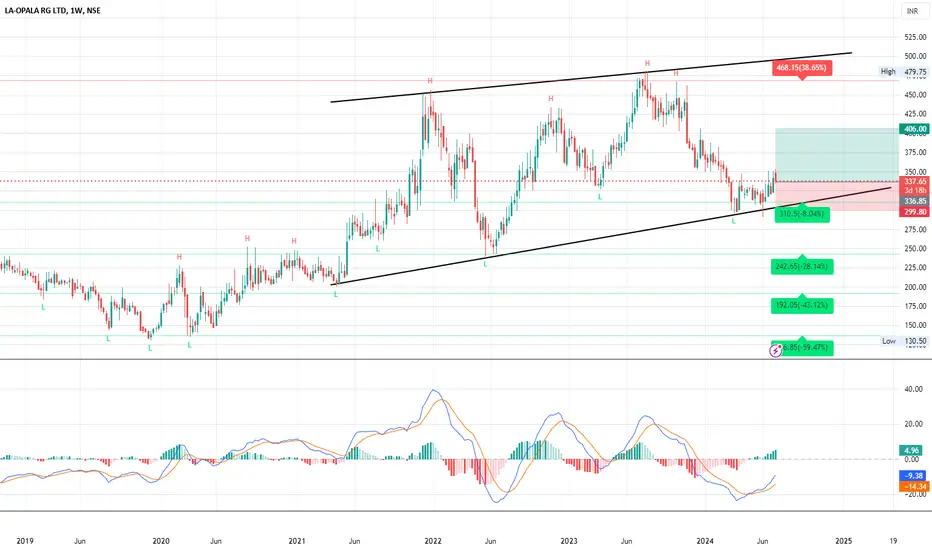
SWING IDEA - LAOPALANSE:LAOPALA seems to be following the pattern as showing in the Chart for the last 3 years now.
There is also a MACD cross which has just happened few weeks back indicating a move upward. This is the only MACD cross after almost 2 long years.
310 is also the current Support level which needs to be maintained in order for this Pattern and Setup to resume its momentum.
Do take this Trade only based on your Risk Appetite.
EURUSDIf current 4 hour candle is closed in green or doji we will buy here because market is ranging since Friday at this level

EURUSDIf current 4 hour candle is closed in green or doji we will buy here because market is ranging since Friday at this level

400 Pips in a Week! Discover the Secret Behind Trading Strategy!Technical Breakdown
Ascending Channel Formation:
The price has been moving within an ascending channel, indicating a bullish trend. The upper and lower boundaries of the channel have provided resistance and support, respectively.
Support/Resistance Level:
A key horizontal level around 2,430 has acted as both support and resistance. This level was tested multiple times, showing its significance in the price action.
Bear Flags:
Two bear flags are identified, one on the 15-minute chart and another on the 30-minute chart. Bear flags typically indicate continuation patterns in a downtrend, suggesting further bearish movement.
Higher High (HH) and Lower High (LH):
The chart shows a higher high (HH) followed by a lower high (LH), indicating a potential shift from a bullish to a bearish trend.
Price Target (TP):
The TP is marked at 2,348, suggesting a potential downside target based on the current technical setup.

NVDA April 26, 2024: An Attempt to Resume the UptrendOn April 26, 2024, The weekly chart of NASDAQ:NDX shows a weekly recovery from the MA-30 week. NASDAQ:NDX closed near the weekly high which is encouraging. The current close is right near the resistance 17,780 which was broken during the week April 15-19.
Looking closer at the daily chart we can see that the resistance is at the same level with both MA-20, MA-50, therefore this is a key level challenging the market next week.
I started to buy a pilot position in NASDAQ:NVDA around the close of April 26. Reasons:
Crossed up MA-20
Crossed up MA-50
Crossed up the small trendline (yellow line on the chart)
This happened before the NASDAQ:NDX did so as described above.

Dodge Coin could boost up a lil bitIDK much but heres an idea I got for dodge coin. what do yall think??

EURUSD Potential sell SetupWill EURUSD drop from this point?
From wave analysis perspective, we are expecting one more drop before a more complex structure.
Confidence is not "This trade will be profitable."
Confidence is "I will be fine if this trade is not profitable

Gold at Crossroads: Breakout or Breakdown? Dont Miss It!Technical Breakdown for XAUUSD
Impulsive Move and Correction:
The price made an impulsive move upwards, indicating strong bullish momentum initially.
After reaching the peak, the price began to form a correction pattern, which typically suggests that the trend might continue in the same direction after the correction is complete.
Descending Channel:
Within the correction, a descending channel formed. This pattern often indicates that once the correction is over, the price may break out in the direction of the original move (downwards in this case).
Liquidity Zones (LQZ):
1HR LQZ / Reversal: The current price is around the 1-hour Liquidity Zone, a critical area where buyers or sellers are likely to step in, potentially causing a reversal or significant price movement.
4HR LQZ: A longer-term liquidity zone that acts as a strong support level, where price may react and change direction.
Daily LQZ: Another significant support level on a daily timeframe that can influence long-term price movements.
Key Observations:
Lower High (LH): The chart shows a lower high, suggesting a potential bearish trend continuation.
Correction Pattern: The price forming a correction pattern within the descending channel indicates that traders should watch for a potential breakout, likely to continue the downtrend.
Trading Insights:
Trend Continuation:
The correction pattern within the descending channel suggests a possible continuation of the downtrend. Traders might look for breakout signals below the channel to confirm this move.
Reversal Potential:
If the price holds at the 1HR LQZ or breaks above the descending channel, it could signal a bullish reversal, providing an opportunity for upward trades.
Key Levels to Monitor:
1HR LQZ: Watch for price reactions around this level for potential short-term trading opportunities.
4HR and Daily LQZ: These levels are crucial for identifying long-term support and resistance, offering potential entry and exit points based on how the price interacts with them.
Summary
Understanding impulsive moves, correction patterns, and liquidity zones can significantly enhance your trading strategy. By observing how price reacts at these key levels and patterns, you can make more informed trading decisions. Watch for breakout signals from the correction pattern and monitor the liquidity zones for significant price reactions to identify potential trading opportunities.

CMS Infosystem Might become your favorite pick of the yearCMS Info Systems Ltd. has shown significant price movement.
Recent Performance: The stock increased by 3.18%.
Support and Resistance Levels:
- Support: ₹502.90
- Resistance: ₹565.25
Moving Averages:
- 10 EMA: ₹526.12
Key Financial Metrics:
- PE Ratio: 21.75
- EPS: ₹24.74
- Market Cap: ₹8,750 Crores
- Recent Earnings: FY 2023-2024 revenue ₹3,250 Crores, with PAT of ₹275 Crores
Entry, Exit, and Stop Loss:
- Entry Point: Above ₹540 if signs of recovery are shown
- Exit Point: Near ₹565 (resistance level)
- Stop Loss: At ₹510
Disclaimer - Not a Buy/Sell Recommendation.

Gold’s Next Big Move: Critical Levels You Can’t Afford to Miss!Hey Traders, welcome back to my channel! 🚀
Today, we're diving deep into the latest XAUUSD analysis, and trust me, you don't want to miss this one. With gold prices poised for a significant move, understanding these key levels could make all the difference in your trading strategy.
Let's get started with the 1-hour chart (shown below). 📊
Chart 1: XAUUSD 1-Hour Time Frame Analysis (July 21, 2024)
Key Observations:
Daily Bull Flag Formation:
The chart highlights a daily bull flag pattern, which indicates a continuation pattern following a strong uptrend. On the daily TF sometimes this can take a bit longer to see due to how big this flag is on the (LTF)
The price has been consolidating within this flag formation.
Reversal Structure (Lower High - LH):
There is a reversal structure where the price made a lower high (LH), suggesting a potential bearish reversal in the short term.
Structure LTF (Lower Time Frame):
The price structure on the lower time frame indicates an area where price could pull back and reject off of this area indicating the continuation of the Overall move.
The second way this could play off of this area is we could get a clear impulsive move above this structure and then a rejection looking for higher moves in the Shorter Time Frame.
15-Minute Time Frame:
The 15-minute time frame shows a detailed view of the consolidation and break down from the flag formation. where you could see how close we are to the LQZ shown on the 1HR
1HR Liquidity Zone (LQZ):
Identified at 2,390.966, this zone may act as a significant support area and also our first Take Profit we gave last week.
4HR Liquidity Zone:
Marked at 2,349.179, another major support area that aligns with the daily LQZ. If price end up breaking the 1HR LQZ impulsively then we could look for this area as Take Profit and then once we get down to this area we could potentially see a pullback.
Daily LQZ:
The daily liquidity zone is at 2,286.809, a crucial support level for the longer-term perspective.
Recommendations:
Watch for Reactions at Support Levels:
Monitor the price action around the 1HR, 4HR, and daily LQZs for potential entry points.
Set Alerts:
Set alerts for breakouts above the recent highs and breakdowns below the key support levels.
Manage Risk:
Ensure proper risk management by setting stop-losses below support levels and taking profits at resistance levels.
