Price Action Lesson 2: Conditions of a Perfect Hammer Conditions of a Perfect Hammer:
. Body height must be short.
. The total height of the candle must be taller than the Daily ATR-264. The taller the candle is, the stronger the Hammer is.
. The lower shadow’s length should be very tall. It is better to be over 75 percent of the Daily ATR-264.
. The upper shadow does not exist, or if it does, it is very small. It shouldn't be more than 25 percent of the Daily ATR-264.
. The hammer that has an ascending body is stronger than the one which has a descending body.
Trendreversal

Hammer Candlestick Pattern DefinitionHammer Candle Stick Definition
If there was a large drop in price in the middle of the day, but before the day ended it increased to what it was at the beginning of the day and even more, a significant upward return occurred. The candlestick of this change (move) will be a Hammer in a daily time frame. A Hammer formation on the daily time frame is a very strong indication for probability of increasing price in next days.
Example: The picture shows currency pair of EUR/USD in a 30 minute time frame. On Ausust 09, 2017 the price significantly decreased from 1.17495 to 1.16886 or even lower. But after that, it increased rapidly at the end of the day to 1.17578 and then closed.
Also in this picture - for better understanding - the Hammer Candlestick in the daily time frame - in the result of changes in a day - is drawn.

EURUSD Short Entry On 1-25-2018 @ 23:00:00Entry- 1.2422
Target 1- 1.2392 $1,180
Target 2- 1.2363 $2,372
Stop Loss- 1.2463 $1,628
ATR- 11
Risk/Reward- 1.5
$400,000
Retest Of Structure Within Trend Condition.
Stop Loss order will be rolled to entry price (break even) After target 1 is reached.

Iteksignal: Learning to use Reversal signalHow to Pick the Bottom in Any Market with Iteksignal
A simple technique to buy the turn higher from the low with Iteksignal, is to wait for a failed double bottom. If you take a look at the image, prices fell to lower low with an extreme bottom (1). A subsequent candles bounce to a higher price (2) stalled and approached the bottom but did not break below that base. New higher lows (3) formed.
123bottom
The buy trigger in the 1, 2, 3 formation is a push above the high (2) inside the double bottom. Buy when that peak is exceeded with a protective stop loss exit at the bottom (1). That make Iteksignal a valid entry


The corrective phase on 1h AUDUSD beginsWhat is prefigured here, through a careful examination of the Elliott cycles, is the beginning of a corrective wave.
The 1h chart shows the price level at the top of the AudUsd wave 5 and, before the breakout, a new rebound on the trend line could configure a reversal pattern: head and shoulders or double top.

Double head and shoulders for a daily reversal on AUDNZDWhat we see is the formation, on the fifth bullish wave, of an interesting double head and shoulders.
The two neck lines, in addition to being in parallel, have already suffered a breakout. Now we are in the pullback phase.
A great time to get into short on about 200 pips.

Question: Is this a Upside Down Head & Shoulders?Learning chart patterns and would like some help :)

EURJPY Iteksignal Trend Reversal
Nice reversal example in EURJPY 1H chart
Getting most part of the trend

Broken Downtrend Line - Perfect Risk RewardHappy New Year. Please like and subscribe if you want more analysis from me...
I suspect that this market is going to continue to find plenty of support at the 1.25 handle, and then again won’t be able to break out to the upside, at least not for a significant move. The next couple of days are going to be very choppy and sideways, so therefore very unlikely to be able to be traded for anything more than a scalp.
If we did breakdown below the 1.25 handle underneath, the market should continue to go to lower levels, perhaps the 1.2350 underneath. Ultimately, this is a market that I think will be something that only short-term traders will be involved in over the next couple of sessions, but I do think that by the time we finish the session on Friday, we should have a better idea of where this pair is going to go. If we do break down, the market goes down to the 1.20 level longer term. Otherwise, if we rally above the 1.26 handle, I think the market may go looking towards the 1.29 handle.

Divergence and touch of Bollinger Bands - Expect Corrections Happy New Year. Please like and subscribe if you want more analysis from me...
Sterling was flat but still holding near a three-month high of $1.36 on Wednesday, after a survey showed that growth in Britain’s construction sector slowed last month. The PMI came in just below a median forecast of 52.5 in a Reuters poll of economists. However this price actions only a result of a weak Dollar. Watch out for some good news for Dollar and some bad news in Brexit negotiations. UK government and EU commision can have a significant influence in this pair.

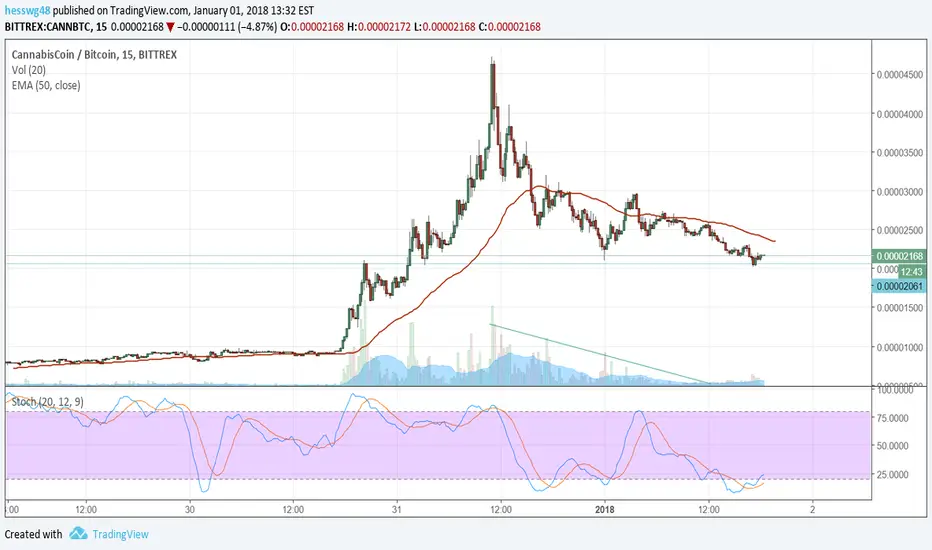
Finding stability.....With volume and indicators reversing, it looks like CANN is getting back on track.
BTCUSD Possible H&S formation 4hHello, i notice this possible H&S formation in the 4 hour time frame in the BTC/USD, the second shoulder is still on the making, so that's only a scenario for this asset, nevertheless we should have this in to consideration, since we need a serious correction in BITCOIN no doubt, and this could be a scenario in January, February.
Share and comment.
Cheers


NZDJPY 4HPotential trend reversal it looks like, price broke out of its original downtrend making lower lows & highs. Now breaking to the upside waiting for a 4 hour close & retest to 4 hour channel to go long

USDCAD DAILYDouble top rejecting strong daily resistance, now waiting for price to break 1.26700 for more shorts this upcoming week! :)

AUDUSD DAILYPotential reversal time?? I would like to see a clean break of 0.76400 first before considering a trend reversal if price does break this level I believe Aussie will move up to new highs next year !

AUDUSDCounter trend line breakout, price now under resistance & can potentially pullback to its broken trend line for a retest before going higher. Waiting for some more confirmation.

ARK - A Possible Reversal?Price action broke down both the Fib support level and the main uptrend line, and since Bitcoin's price developed a strong increase in the past days this pair was going to dump as we knew the negative correlation between both. However, since November 2nd, price bounced off the last peak during July, before August's huge price increase (notice the black support line).
However, at a closer look, we can see after the bounce, a double bottom sort-of pattern formed for a reversal, and price action is currently making a rather steep ascending triangle (flat top) that are normally a reversal from bearishly-oriented markets, which this has been for almost 2 months since its peak during September. Currently testing the upper limit of the triangle, but will likely correct again towards the lower limit uptrend line and then develop upward movement from that point. If the lower limit line of the triangle is compromised, we must be careful as the possibility of it descending towards lower levels is higher than the possibility of it ascending again to the resistance line. From an indicators perspective, these need to decrease price as to reset them in order to imply upward movement, hence the approach to expect decrease to the lower limit in the near future. If there is a proper penetration of the triangle resistance, and the 50% Fib retracement level in the lower time frame, we should expect a bullish run towards 45000s and 50000s targets in the weeks to come.
Good luck!

BTCUSD 4hr- H&S pattern - Possibly trend reversal?Spotted a Head and Shoulders pattern on the 4 hr chart BTCUSD. The neckline of the H&S pattern crosses close to the 50 day MA. Can we expect a short term downtrend if the trend crosses these levels? Leave your thoughts below. If you have any comments/questions please let me know.
Cheers.

EURJPY - Possible 2618 TradePrice has recently tested a zone of support looking a daily chart.
4h timeframe shows that price formed a double bottom at this level.
Price might retest 61,8% Fib level before it keeps rallying all way up towards 132,328.
Entry at 132,114
Stop Loss at 131,420
1st Target at 133,084
2nd Target would be at 132,328

Possible Breakout Starting on DailyBLKBTC looks like its possibly found a bottom and is trying to break its downtrend. Bullish divergence with RSI/price could be a supporting signal of upward move. It is also breaking up out of a triangle on the daily. I drew what I perceive as a few downtrends it needs to break. I won't consider a buy until it breaks the first one right around the green line. I set a few hopeful TPs and the red line is my stop.
Buy in: 0.00003865
TP1: 0.00005400
TP2: 0.00006750
Stop: 0.00002680

EURJPY DAILYPrice opened up below the daily uptrend line, now waiting for a close below support & potential retest to go short. Should be a good opportunity this week potentially, this pair has been playing a bit..
