ONGC- Price Action Analysis NSE:ONGC already has nearest to their supply zone (143 - 145) and has activated Harmonic BAT pattern with the level of 0.886.
BUY : Buying only applicable if price will cross above 145 level and sustains to close on daily basis with high volumes and good momentum.
SELL : If any rejection at 143 -145 , might activate Sellers for selling up to 128 -131 and breaking this zone creates tremendous sell off till 115.
NOTE : Safe trader can buy above 145 or wait till if price comes at 128 -131 and creates reversal confirmation candle.
Trendreversalpattern

BA double bottom!divergence and bollinger bands tightening could be a great klong position for the long term since Boeing is a strong fundamental company!

DXY - D1 - DOUBLE TOP IN PROGRESS !The Dollar Index (DXY) is showing a potential double top formation in progress on a daily chart.
DAILY (D1)
Ongoing downside price action, after having, yesterday, broken both the Tenkan-Sen and the Mid Bollinger Band, this morning
the DXY is attempting to also breakout the Kijun-Sen which should be seen as the last important support level in that time frame.
A failure to hold above it (95.96) would directly put the focus on lower levels, towards 95.51 which is the trigger level of the double
top formation in progress and if broken would activate this reversal formation calling for a technical target @ 94.09 which is, currently, also the
clouds bottom support area on this daily time frame.
WEEKLY (W1)
Still in an ongoing uptrend but lack of follow through, confirmed by several "dojis" in a row is likely to trigger a trend reversal!
In addition, the 50 % Fibonacci retracement @ 96.10 has been filled but, so far, each upside continuation attempt has been rejected.
In that weekly time frame, the next significant support is @ 95.11 and a failure to stay above it would be an additional warning signal, calling for further downside towards
the double top technical target @ 94'09 above mentioned, which also coincides with the weekly cluster support level of MBB and KS.
MONTHLY (M1)
The DXY failed on the last monthly closing basis (in November) to upside breakout the clouds resistance area !
Therefore, December monthly closing should be watch at very carefully and that will give more clues for the upcoming months on a long term view.
Finally, watch carefully price action on shorter intraday time frames which will help you to validate or invalidate my technical view.
CONCLUSION :
Only a sustainable recovery, on a daily basis closing observation, above the 97.00 area would force to a reassessment of my expected bearish scenario.

EGLD 4h Falling Wedge PatternFrom my analysis it seems we might have a falling wedge pattern indicating a reversal in trend.
Keep in mind that it depends also on BTC at this point that still influences the market.
If all works out a good entry level would be after $287. Wait for confirmation.
Good Luck!

NiftyNifty given 18600 to 17370 correction.
now nifty near to crucial zone.
we seen big support near 17333/17233.
if not close below then we seen UP SIDE again.

Short into the NEW YEAR - US DXYAs you can see the US DXY is finding resistance on the upper trendline of the fractal, the Stochastic RSI approaching a bearish reversal.
However, the DXY may show strength and attempt to break the fractal in the short term, so beware. Though an extended break from the fractal may cause a stronger turn to the downside in the long term.
If the DXY fails to break the upper trendline, the impending wave to the downside is likely to occur. A trend reversal will take place and the price will trend to test the lower trend line of the fractal.
A large wave down by the US DXY will create great strength for assets priced against the USD, such as Bitcoin, Gold, Silver and other currencies such as the AUD.
Thanks.

Huge Bearish Harami at a Shark PCZ if the Daily closes like thisNow may be a good time to buy some December puts near the $90 range.
MoneySwap (MSWAP) is in more than 100 days consolidationMoneySwap (MSWAP) is in more than 100 days consolidation and anytime it may give big breakout. I am expecting 300% return after KUCOIN:MSWAPUSDT gives breakout from this long accumulation phase.
Be patient, as it may move side ways for couple of weeks before breakout. Longer is the consolidation/accumulation higher is the breakout.
Do leave your feedback in comment section.
Thank you.

Franklin (FLY) is ready to give breakout - 300% potential profitLooks like KUCOIN:FLYUSDT is ready for trend reversal. I am expecting 300% return after FLY gives breakout from more than 100 days long consolidation. It may move side ways for couple of weeks before breakout, be patient.
Follow us for related analysis.

Cryptoindex.com (CIX100) is in more than 100 days consolidationLooks like Cryptoindex.com 100 (CIX100) is ready for trend reversal. I am expecting 300% return after CIX100 gives breakout from more than 100 days long consolidation. It may move side ways for couple of weeks before breakout, be patient.

GBPCAD expecting some bullish sentiment on 1.70000GBPCAD has been on a massive downtrend after retesting 1.75000 since 20th september to 1.69000, this level might bring some bullish sentiment as it finds support around this level from the weekly timeframe. the bulls push breaking 1.70000 with a strong bullish momentum, therefore am expecting a retrace then continue till 1.72500.
Confirmation is waiting for a reversal candlestick pattern on 1.70000, then a break of the recent support turn resistance created.
kindly drop your suggestions in the comment box.

UniLend (UFT) is in more than 100 days consolidation in ETH pairLooks like UniLend (UFT) is ready for trend reversal. I am expecting 300% return after UFT gives breakout from this long consolidation. UFT also looks good in fiat pair. It may move side ways for couple of weeks before breakout, be patient.

$ALGOBTC LONGLong term trend line being broken. Already have starter position. Will add to position on pullback of trendline.

HCLTECH near to strong support for reversal. Best Zone for Buy.- HCLTECH near to the strong support for reversal. Best Zone for Buy & hold.
- Joint Venture with Hitachi-ABB could be the reason for push upside in upcoming days from support level.
- Watch our next Target support level and resistance level fro entry and exit according to your target price.
- HCLTECH still continues to see large delivery positions.
- Delivery Position (05-MAY-2021 EOD ) : 46.08%
To motivate me, Please like the idea and follow If you agree with the analysis.
Happy & Safe Trading!
Vijay Singh


KGB TREND REVERSALMYX:KGB
TURTLE PRO UPTREND (EMA 20 CROSS UP EMA 50) SLOW TURTLE BUY
FiFT BEAR GETTING WEAK
MCDX BANKER 50%
ATOM BUY


EURJPY Isn't it a Head and Shoulder? 30M TF 30/01/2021As we ca see there is a head and shudder pattern is forming and by using our Fibonacci projection from head to the falling shudder we can have 3 TPs zones of short-term trades
i shall mention that we are aware of a bearish divergence with MACD and it is the sign of a big fall in the Daily time frame

Wipro - Trend Reversal- Moving between a channel
- Hammer at the bottom reversal pattern (Bullish)
- if crossed Resistance -1 then accumulate more
- If Stop loss hit at 408 then get out of the trade
- Target - 500
- Good for swing Trade

Time to go long ETH/BTC?The ETH/BTC pair has been consolidating in a falling wedge through the month of Feburary and is well-positioned to break out to the upside.
The price is nearing the VPI point of control and 0.5 Fibonacci retracement level, so we can expect some volatility if a break out does occur.
Furthermore, the Stochastic oscillator is oversold (now trending up) and there is a bullish MACD divergence (as shown in yellow).
If ETH/BTC returns to its early Feburary high, this trade will yield a nice return with relatively low entry risk.
Good luck!

TPIIwas thinking to sell today but I think we have a text book S/R flip & if yes my original TP of .32c seems more likely
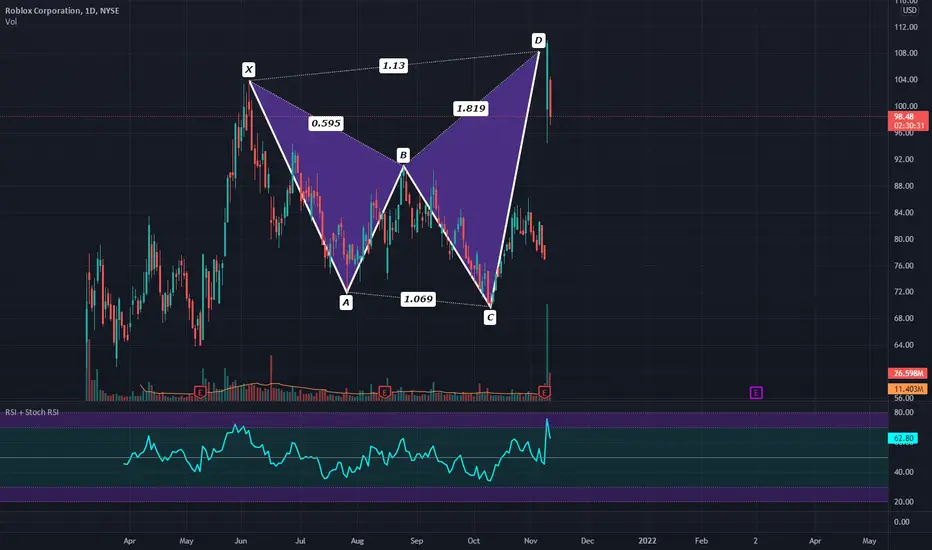
Bearish Gartley Pattern - The Warning SignHello, dear subscribers!
Let's consider the most common bearish sign which can be founded on the market - the bearish Gartley formation.
This pattern takes place when there was a huge dump like from point X to point A. After that we have the small bounce from A to B, but the decline continue from B to C. There is a massive growth almost to the the X point level (see point D) at the end of this price action.
It seems that the downtrend is over and bulls dominate again. We can see two signs of the new uptrend beginning: the higher lows (point C is higher than A) and highs (point D is higher than B).
Here is a big danger now. Until the price is not reached the X point level, the bearish Gartley pattern formation can play. If the Gartley pattern have approximately the same characteristics as numbers on the chart there is the high probability of price dump to the price level between points A and C.
Be very careful when you analyze the trend reverse opportunity, this bearish sign can take place.
DISCLAMER: Information is provided only for educational purposes. Do your own study before taking any actions or decisions.

HINDPETRO BREAKOUT TRADESHindpetro with an triangle pattern breakout in weekly time frame in upward direction!!! buy @210~214
COMMENT/ DM FOR TAARGET & SL
LONG TERM!!
