Bitcoin (BTCUSDT) – Multi-Timeframe AnalysisDaily (1D) Chart Analysis
Trend Overview: BTC has been in a downtrend since its recent peak above $100K, trading below the 100 EMA (yellow) and 200 EMA (white).
Support Zones: The key support zone is around $75,000 - $77,000, where buyers could step in.
Resistance Zones: The major resistance sits near $91,000 - $95,000.
Momentum Indicators:
RSI: Around 40, showing a lack of bullish momentum.
MACD: Bearish crossover, suggesting more downside pressure.
Conclusion: BTC remains under bearish pressure unless it reclaims the 100 EMA. Watch for a possible liquidity sweep below $75K before a bullish reversal.
4H (4-Hour) Chart Analysis
Structure: BTC has been trending below the 200 EMA, confirming a bearish bias.
Resistance: The $85,500 - $88,700 zone acts as a critical resistance.
Support: The nearest key support zone is $79,000.
Indicators:
RSI: Below 50, confirming weak momentum.
MACD: Attempting a bullish crossover, but still below the signal line.
Conclusion: BTC needs to break above $85,500 for a bullish shift. Otherwise, we could see further downside to $79,000.
1H (1-Hour) Chart Analysis
Short-term Structure: BTC is testing resistance at the 200 EMA, which could act as a rejection level.
Potential Play:
If BTC fails to break above $84K, a short trade towards $79K makes sense.
If BTC closes above $84,000, a bullish setup towards $88,000 - $91,000 could form.
Indicators:
RSI: Hovering near 40, not showing strong buying momentum.
MACD: Still bearish but showing signs of a possible crossover.
Conclusion: BTC needs a break and retest of $84,000 for longs; otherwise, bears remain in control.
📈 My Trade Setups for the Week:
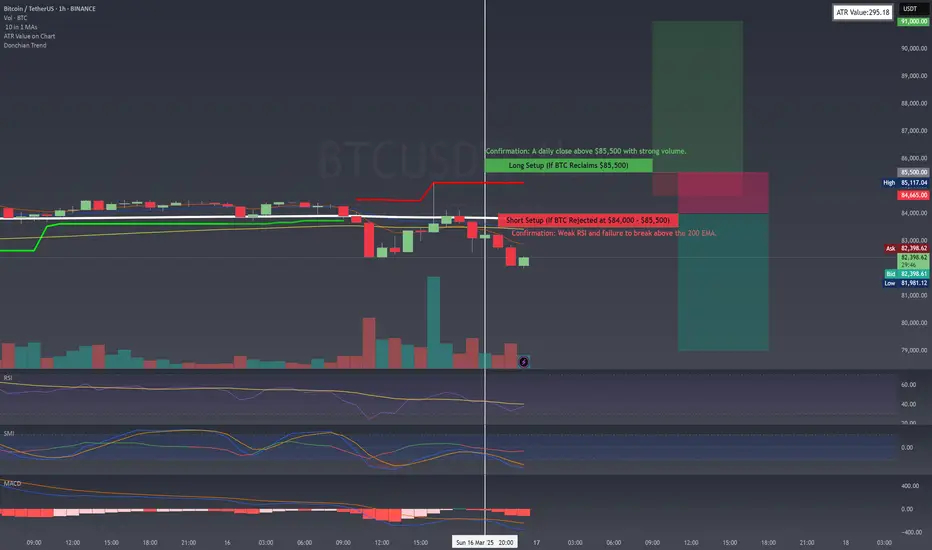
🔴 Short Setup (If BTC Rejected at $84,000 - $85,500)
📉 Entry: $83,500 - $84,000
📉 Stop-Loss: $85,500
📉 Take Profit:
TP1: $80,000
TP2: $79,000
💡 Confirmation: Weak RSI and failure to break above the 200 EMA.
🟢 Long Setup (If BTC Reclaims $85,500)
📈 Entry: $85,500 - $86,000
📈 Stop-Loss: $83,500
📈 Take Profit:
TP1: $88,500
TP2: $91,000
💡 Confirmation: A daily close above $85,500 with strong volume.
📌 Final Thoughts
🔹 BTC remains in a bearish structure, with a possible liquidity grab below $79,000 before any strong reversal.
🔹 If bulls reclaim $85,500, it opens room for a run towards $91,000.
🔹 Best approach: Wait for confirmation at key levels before entering trades.
⚠️ Risk Warning: Always use proper risk management—crypto markets are highly volatile.
💬 What do you think? Are you considering any trades this week? 👇
Trendsetup
BTC DISTRIBUTIONAt the moment the nearest liquidations from above are in the range of 69900-70600. Probably BTC distribution may take a few days or even more. At the moment liquidity is accumulating both from above and below but there are much more bulls thus it gives us more confidence in a downward move and liquidation of bullish positions up to 50k.
A preliminary hike up with liquidity gathering and further downward movement also remains in force as an option. In case of a breakout an option of the asset distribution and a short fake fixation above ATH and setting of long positions is possible which will again be in favor of the bears.

GOLD NEXT 100Pips AFTER RETEST (XAUUSD)1810.204 - retest zone
1827.521 - T.P zone
First, there will be a correction before the next bull run.
You can currently take a sell position to 1810.204
NB: This is not a financial advice, do your research before entering any position.

NZDUSDThe price of a strong line from which I expect a downward movement.
Traders, if you agree with this idea give a thumbs up and let me know your opinion on it, write in the comments below!

Making the Bitcoin Circus a Little Less In Tents. BINANCE:BTCUSDT Follow Along the support and resistance created by Trend Lines.


EURUSD D1 SHORT1. Major trend is bearish
2. We got break of triangle with nice forming 123 or ABC pattern (LL->LH->LL...)
3. 3rd touch of resistance trend line gives even more confidence.
4. Price is currently sitting on structure from previus swing low (support became resistance)
5. We also have fibonacci retracment 50%
Enter on D1 waiting for pin bar, engulfing or any candle which you trust... you can simply wait for heiken ashi D1 close below 23 trendline (break of 123)....For more conservative entry with even smaller stop loss enter on H4/H1 after 23 break.
