Three Aspects of a Trade Entry, Risk Management, ExitWelcome to our discussion on the three vital aspects of a trade: Entry, Risk Management, and Exit. Mastering these components is crucial for successful trading. Let's delve into each aspect, understanding their significance and how they contribute to your trading strategy.
Entry:
The entry point marks the initiation of a trade. While it may seem straightforward, it sets the foundation for your entire trade. When choosing an entry point, consider factors such as market trends, support and resistance levels, and technical indicators. Your entry should align with your trading plan and signal a high probability of profitability. Remember, a well-timed entry can maximize your potential gains and minimize risks.
Risk Management:
Effective risk management is the cornerstone of trading success. This aspect requires careful consideration and planning. Assess the amount of capital you're willing to risk on each trade and set appropriate stop-loss levels to limit potential losses. Remember, preserving capital is paramount to long-term profitability.
Exit:
The exit point marks the closure of a trade and realization of profits or losses. While it's often considered the simplest aspect, it's equally critical. Establish clear exit criteria based on your trading strategy, whether it's a predetermined price target, trailing stop, or technical signal. Stick to your exit plan without succumbing to emotional impulses or market noise. A disciplined approach to exiting trades ensures that you capture profits while minimizing potential losses.
Importance of Each Aspect:
Entry: Sets the stage for the trade and influences its outcome.
Risk Management: Protects your capital and ensures longevity in trading.
Exit: Determines the realization of profits and mitigation of losses.
In summary, prioritize each aspect of the trade process, giving due attention to entry, meticulous risk management, and disciplined exits. By mastering these fundamentals, you'll enhance your trading skills and improve your overall performance in the markets.
Trendtrading

Bitcoin Re Re Re Testing Multi-Year Trend LineOnce again Bitcoin is Re-Testing my Multi-Year TrendLine as support. The last 3 daily candles each have a wick poking down at it. Will it hold? So far it has but with each passing day and retest, the chance grow less and less likely. As long as we remain above it, I am long. A drop below would have me taking risk off and waiting for a better price below somewhere.

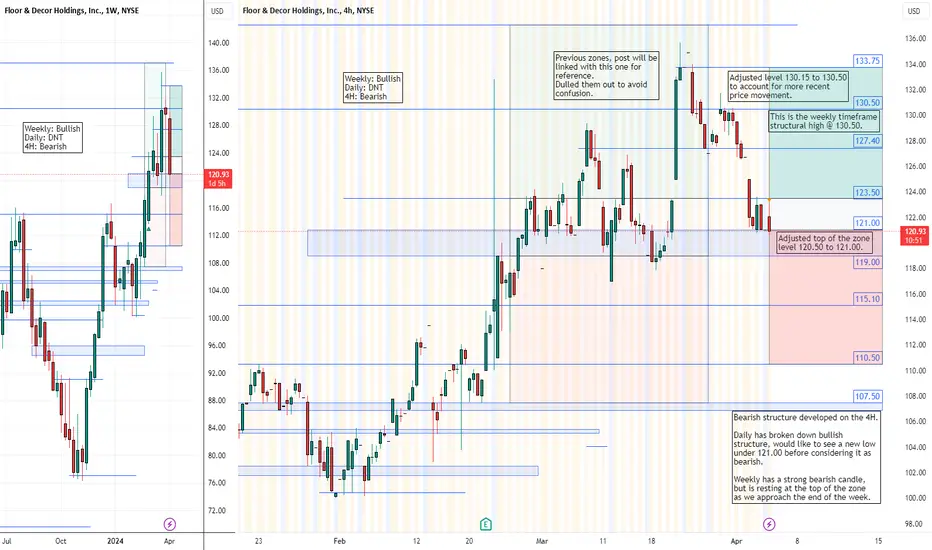
FLOOR & DECOR $FND - Apr. 4th, 2024FLOOR & DECOR NYSE:FND - Apr. 4th, 2024
BUY/LONG ZONE (GREEN): $123.50 - $133.75
DO NOT TRADE/DNT ZONE (WHITE): $121.00 - $123.50
SELL/SHORT ZONE (RED): $110.50 - $121.00
Weekly: Bullish
Daily: DNT
4H: Bearish
Viewing this mainly as a short opportunity but keeping my eye open to the upside as well. Looking for bearish structure to continue to develop on the 4h timeframe. Moving up to the Daily timeframe I'd like to see a wick lower than the previous day's low at 120.64 before considering this bearish, and preferably with a close below the 120.64 level. The weekly timeframe does not have bearish structure and has not broken down bullish structure, however; there is a strong bearish candle, the structure is just being respected at the top of the zone at 121.00. Bears should be looking for momentum to continue through this zone to breakdown tomorrow or sometime next week.
Previous zones from my most recent NYSE:FND post are still shown for reference but have had their visibility decreased to avoid confusion. That post has been linked with this one to jump back and forth.
This is what I would personally look at before entering trades, everything is subject to change on a daily basis and as I analyze different timeframes and ideas.
ENTERTAINMENT PURPOSES ONLY, NOT FINANCIAL ADVICE!
trendanalysis, trendtrading, priceaction, priceactiontrading, technical indicators, support and resistance, flooranddecor, floor&decor, fnd, fndstock, flooranddecorstock, NYSE:FND , flooranddecoranalysis, flooranddecortrend, tilewoodstone, longfnd, shortfnd, buyfnd, sellfnd,
ETH 1D | IdeaThere is a possibility that it may fall after giving an upward correction. If the price defends the invalidation area, it can go to higher levels. If it doesn't, it can target lower levels.

It is predicted that gold will continue to increase todayWorld gold fees hit a file on April 9, way to shopping for sports and geopolitical risks, whilst interest became directed to the assembly mins of americaA Federal Reserve (Fed) and inflation records of this country.
Minutes of the Fed assembly and records at the purchaser rate index could be posted on April 10.
Gold is taken into consideration a secure haven from inflation and geopolitical risks, however growing hobby costs have a tendency to lessen the attraction of this non-yielding asset.
According to the World Gold Council, the elements main to the modern-day restoration in gold fees are accelerated geopolitical risks, solid gold purchases with the aid of using principal banks and call for for gold rings and bullion. Just like gold cash are nevertheless big.

TESLA $TSLA - Feb. 16th, 2024Tesla NASDAQ:TSLA NASDAQ TVC:NDQ
BUY/LONG ZONE (GREEN): $195.75 - $260.50
(BUY ZONE ADJUSTABLE DOWN TO 208.50)
DO NOT TRADE/DNT ZONE (WHITE): $177.25 - $195.75
(DNT ZONE ADJUSTABLE UP TO $208.50)
SELL/SHORT ZONE (RED): $113.00 - $177.25
Tesla broke out of its range lasting from Jan. 25th - Feb 15th. Breakout price was at 195.75, the Feb 15th daily candle broke and closed above this price level. This can mark a bullish trend, however; a safer bullish zone can be extended to start at 208.50, with the DNT zone also extending to end at 208.50. I personally like the early entries after a strong bullish candle yesterday with over a +6% move. Some other high frame bullish entries could be a retest of the top of the range, or a breakout of the 208.50 area. Some high frame bearish entries could be a test and rejection of the 208.50 area, or a break back into the range area. Long term targets would be the 230 - 260 area, would need another look once price moves closer. I quickly marked every recent structure 1 - 6 that I considered when looking to enter a new position to show somewhat where my mind was at. As price moves to new levels and zones and develops new structure I will update this.
This is what I would personally look at before entering trades, everything is subject to change on a daily basis and as I analyze different timeframes and ideas.
ENTERTAINMENT PURPOSES ONLY, NOT FINANCIAL ADVICE!

TAKE-TWO INTERACTIVE SOFTWARE $TTWO - Feb. 28th, 2024TAKE-TWO INTERACTIVE SOFTWARE NASDAQ:TTWO - Feb. 28th, 2024
BUY/LONG ZONE (GREEN): $153.00 - $168.45
DO NOT TRADE/DNT ZONE (WHITE): $143.65 - $153.00
SELL/SHORT ZONE (RED): $133.00 - $143.65
Weekly: Bearish
Daily: Bearish
4H: Bearish
Currently in a DNT zone as it would be unfair to automatically wait for price to drop and then say it's a bearish area; however, price is strongly bearish on the weekly, daily, and 4H. Shown in blue is previous zones that I would follow and the order in which I would follow them, the previous bullish trend was fairly clear and strong (labels A-E & 1-3). About three weeks ago we saw a drop that pushed right into a bearish zone below level $156.75 (bottom of the zone). Drawn now are the current zones where price currently resides and the trends I would follow in each of them. The arrows show simple potential price movement to look for, but the market is always subject to change and create new levels. Bulls can look for early entry at the bottom of the DNT zone at $143.65 and seek a bounce or wait for price to break back above $153.00. Bears can look for price continuing below level $143.65 or a pullback anywhere up to $153.00 and rejection back towards the $143.65 level and lower.
This is what I would personally look at before entering trades, everything is subject to change on a daily basis and as I analyze different timeframes and ideas.
ENTERTAINMENT PURPOSES ONLY, NOT FINANCIAL ADVICE!
trend analysis, chart patterns, support and resistance

Unleash the DOGETechnicals: CRYPTOCAP:DOGE has broke through a Major Support of $16 and looking to fetch higher towards all time highs
The Dogecoin community remains active and engaged, with numerous developments and initiatives that could potentially drive the coin's value higher.
For example, there have been discussions about the potential implementation of Dogecoin payments on X (twitter), a social media platform owned by Elon Musk. Such developments could increase the utility and adoption of Dogecoin, leading to a surge in its price.

5204 is a major trend support to watchJob data this morning caused a movement exactly as I anticipated and discussed yesterday. The move lower I suspected came yesterday as I anticipated, so now I'm just looking to see if we can move below this 5204 12hr support line. To date, the 12hr has been the major support level to stop any movement down since November which is why we have not seen a Daily trend change for nearly 6 months.
Trends into today;
Last Macro Trend Signal Spots (ES Contract)
30m - 5248 Downtrend (4/4/2024) Lower Low
1Hr - 5226 Downtrend (4/4/2024) Lower Low
2Hr - 5226 Downtrend (4/4/2024) Lower Low
3Hr - 5197 Downtrend (4/4/2024) Lower Low
4Hr - 5260 Downtrend (4/2/2024) Higher Low
6Hr - 5250 Downtrend (4/2/2024) Higher Low
12Hr - 5204 Downtrend (4/4/2024) Higher Low
Daily - 4378 Uptrend (11/3/2023) Higher High
Weekly - 4769 Uptrend (12/11/2023) Higher High
Monthly - 5304 Uptrend (03/31/2024) Higher High
Overall, I will link my video from yesterday if you want an in-depth analysis on why I predicted we would move lower.
Major thing I've heard, is people are no discussing only 2 rate cuts this year. So again, we went into the year with 6 rate cuts priced into the market. We dropped to 3 rate cuts even though we never REALLY priced out the 3 extra rate cuts, and now we are discussing only 2 rate cuts this year, and the potential of them not coming in June.
Safe trading, and remember your risk management.

First Sell/Short Signals since January - TrendsLonger video but hopefully it clarifies my position in the market. I do NOT have a short position yet, but I am looking for one at this point. I might wait until either the close of the day depending on where we are OR take a short position if the overall day goes negative.
Trends into today;
Last Macro Trend Signal Spots (ES Contract)
30m - 5724 Uptrend (4/3/2024) Lower High
1Hr - 5277 Uptrend (4/3/2024) Lower High
2Hr - 5278 Uptrend (4/3/2024) Lower High
3Hr - 5291 Downtrend (4/1/2024) Higher Low*
4Hr - 5260 Downtrend (4/2/2024) Higher Low
6Hr - 5250 Downtrend (4/2/2024) Higher Low
12Hr - 5087 Uptrend (2/22/2024) Higher High
Daily - 4378 Uptrend (11/3/2023) Higher High
Weekly - 4769 Uptrend (12/11/2023) Higher High
Monthly - 5304 Uptrend (03/31/2024) Higher High
In order to try and keep on point I actually wrote some notes for this video (yes, in spite of the length, I felt I really tried to keep on point). What I will do instead of rewriting any of the video is just copy and paste my notes into here.
NYFANG / MAG 7 still pulling market up (down day even though they had gone up .6%)
Economic Calendar
JOLTs was uneventful
NonFarm Employment is up - Job Growth seems good
ISM Non Manufacturing Prices lower - Includes pay being lower
Powell Speaks - Nothing really new
- Wants to cut rates (already priced in)
- Data will drive decision (says that every time)
Today - Jobless Claims (No expectation other than strong job market)
Tomorrow - Unemployment (Not expecting anything new)
- Even if it does, how do you price in this news? Is good bad, or bad good? Good is good?
Trends;
30m, 1hr, 2hr all in lower highs
3hr had a higher low but if uptrend hits, will now be lower high
So 30m to 3hr trends call for lower
4hr, 6hr, 12hr - call for rebound up
Daily is still sitting massively overbought
Weekly is normal bull market signal even if we go lower
Monthly just hit uptrend, but Monthly has NEVER done anything but higher highs and higher lows back to the 80s (no data past that)
For that to change we would have to go below 3846
- EVEN IF THAT HAPPENED, no historical data to explain what that could mean (Must like we saw with the lower low of a weekly trend)
Sell Signals
The shorter term trends are calling for lower movements
Daily uptrend is well, well, well overcooked
MACD Momentum (Daily) has crossed below zero line. Last time we had that was January when I traded shorts several times and made money. Has historically been MOSTLY accurate.
MACD Momentum had a sell signal 3/26 but it was after down days so uneventful
Weekly Overbought RSI/MFI
Buy signals (or at least cautionary flat moving signals)
Trends of 4hr and above call for
MACD itself is not below the zero line (so not a prime bearish / shorting environment)
Hope you found the information helpful. Safe trading, and remember your risk management plan.

What you think about GOLD in NFPTechnical evaluation of GOLD:
Crucial resistance: 2305 - 2308 and 2330 - 2335
Crucial Support: 2265–2260
We may anticipate a significant upward move towards 2320 and 2330 if the resistance is breached.

Trade Entry and Management Techniques Using Swing High PivotsIn today's video idea, we will delve into a comprehensive strategy for trade entry and management, centered around utilizing swing high pivots as crucial reference points. We will also explore the effective integration of technical tools such as Outer Bands, ribbons, and Target View Trades (TV-Trades) to enhance precision in trading decisions. By the end of this tutorial, you will gain valuable insights into determining trade viability and optimizing trade execution.
Understanding Swing High Pivots:
Swing high pivots serve as pivotal landmarks in market analysis, offering valuable insights into potential trade setups. When identifying swing high pivots, focus on significant price peaks that indicate potential trend reversals or continuation points. These points will serve as key references for evaluating trade opportunities and managing risk effectively.
Trade Entry Strategies:
Utilizing swing high pivots as reference points, assess the market conditions to determine the viability of trade entry. Look for confluence with other technical indicators such as Outer Bands and ribbons to validate trade setups. Prioritize trades that align with the prevailing market trend and exhibit strong momentum, increasing the probability of success.
Managing Trades:
Once you enter a trade, it is essential to implement effective management techniques to optimize profitability and mitigate risks. Continuously monitor price action relative to swing high pivots and technical indicators to gauge trade performance. Implement trailing stop-loss orders to protect profits and minimize potential losses as the trade progresses.
Integration of Technical Tools:
Explore the functionalities of technical tools such as Outer Bands, ribbons, and Target View Trades (TV-Trades) to refine trade entry and exit points further. Outer Bands provide larger trend information, aiding in direction, trade confirmation and risk management. Ribbons offer visual cues for trend direction and momentum, enhancing trade precision. Target View Trades (TV-Trades) provide a systematic approach to identify optimal entry and exit points, facilitating disciplined trading execution.
Conclusion:
Mastering trade entry and management techniques is essential for navigating the dynamic landscape of financial markets successfully. By incorporating swing high pivots and leveraging technical tools effectively, traders can make informed decisions, capitalize on lucrative opportunities, and achieve consistent profitability in their trading endeavors. Continuously refine your skills through practice and experimentation, adapting to evolving market conditions for sustained success.

SoundHound AI: A Rising Star in the AI IndustryNGM:SOUND is making a bounce on a major support level at $5. This is showing strength for the buyers and further upside to be made. Entering a swing position and targeting $15.
Some more details on SOUNDHOUND AI:
SoundHound AI's technologies have attracted the attention and investment of major players in the tech industry. For example, Nvidia disclosed that it held roughly $3.7 million in SoundHound AI stock at the end of last year's fourth quarter. This kind of investment and partnership with a leading AI company like Nvidia is a strong vote of confidence in SoundHound AI's future.
Market Opportunity: The AI market is rapidly growing, with significant potential for companies like SoundHound AI that provide advanced voice recognition and conversational AI solutions. As the demand for AI-powered solutions continues to rise across various industries, SoundHound AI is well-positioned to capitalize on this trend and grow its market share.
#LionsDenTrades

$USDJPY 4H | Red circle It is about to breakout the range, the blue box can work as an S/R level in this case. If we want to go to upper levels the price should be able to reclaim the red circle or invalidate it.
Happy trading

ADANI POWER - Swing TRADE IdeaThe stock is in uptrend in all Higher time frames.
The stock has been in good consolidation for 12 weeks.
Downside wicks in the last 3 weeks indicate good buying coming in.
The last week candle seems to be an indecision candle post diminishing selling pressure and buying stepping in.
The lower time frame price actions such as Daily and 75 mins confirm the upside price momentum.
My SL and targets as mentioned in chart. I would plan a wide SL of 12% and target of 22% trailing. Target 1 - 591 ALL Time high.

SID Potential Breakout State Bank of India $GETTEX:SIDSID Potential Breakout Analysis
GETTEX:SID is showing signs of a potential breakout based on technical analysis, indicating a favorable moment to explore investing in the State Bank of India (SBI).
Why State Bank of India (SBI)?
State Bank of India (SBI), as one of the largest and most reputable banks in India, offers a compelling investment opportunity for various reasons:
Market Presence: SBI's extensive network and dominant market position in the Indian banking sector provide stability and potential growth opportunities for investors.
Financial Performance: The bank's solid financial performance, robust asset quality, and prudent risk management practices make it a reliable choice for long-term investments.
Economic Growth: With India's economy poised for continued expansion, SBI stands to benefit from increased banking services demand, infrastructure development, and financial inclusion initiatives.
Key Reasons to Consider State Bank of India:
Diversified Portfolio: SBI offers a wide range of banking products and services catering to diverse customer segments, enhancing revenue streams and mitigating risks.
Digital Transformation: SBI's focus on digital innovation and technology integration positions it well to adapt to changing market dynamics and meet customer expectations effectively.
Government Backing: As a government-owned bank, SBI enjoys implicit support, adding a layer of stability and credibility to its operations.
Exploring investment opportunities in the State Bank of India could offer a blend of stability, growth potential, and exposure to India's thriving economy. Keep an eye on GETTEX:SID for further indications of a breakout to make well-informed investment decisions.

GOLD GOES UP!!!!??Hello fellow traders!
XAUUSD has been on the rise with a MAJOR BREKAOUT and the bull run isn't done. there are two more zones based on the Daily Fib level!!!
Checklist:
✔BULLISH TREND
✔SUPERTREND IN BUYERS POSSESION
✔Fib retracement could hit for continuation @ 23.6%
✔4H Time frame
8,459 Pip Analysis

GOOGLE $GOOG - Feb. 26th, 2024GOOGLE NASDAQ:GOOG - Feb. 26th, 2024
BUY/LONG ZONE (GREEN): $144.50 - $154.80
DO NOT TRADE/DNT ZONE (WHITE): $139.60 - $144.50
SELL/SHORT ZONE (RED): $131.15 - $139.60
Weekly: Bullish
Daily: DNT
4H: Bearish
The zone around $140 has been supported to the bullish side three times since Jan. 17th, 2024. Currently price is back at the zone after creating bearish structure on the 4h timeframe with strong downside momentum. Price has respected the level at $146.10 to the bearish side and broke below the $144.50 on the daily timeframe which is the start of the DNT zone and the potential start of entry into the bearish zone.
Bulls can look for rejections up from the $140 area or breaks above the $144 level/structure (daily timeframe). Bears can look for continuation below the $140 area or a pullback and rejection of the $144 level (daily timeframe).
This is what I would personally look at before entering trades, everything is subject to change on a daily basis and as I analyze different timeframes and ideas.
ENTERTAINMENT PURPOSES ONLY, NOT FINANCIAL ADVICE!

DOGEUSDT 3D | HTF LevelsDOGEUSDT 3D | HTF Levels
If I can see a retracement to the MO area, from there the price can go to the upper levels.
Happy trading

S&P rally continuesAt the start of last week, things didn’t look great for the bulls. There were several signs of weakness that could have easily led to a daily trend reversal. However, that didn’t materialize. Firstly, on Monday, buyers were able to set a daily higher low. Then, on Wednesday, they positioned the price very close to the previous two weeks' high. Finally, with the help of the FOMC, they broke through the resistance, set a new historical high, and held it into the week's closure. All these factors together confirm the strength of the bulls and position them well for rally continuation.
AMEX:SPY outlook for the next week is bullish. Pullbacks should be considered as buying opportunities. Short trades should be avoided unless you are a scalper.
Stay alert of economic data releases on Thursday (GDP) and Friday (Personal Income/Spendings and FED) that could cause some volatility.
Disclaimer
I don't give trading or investing advice, just sharing my thoughts.

💡 XAUUSD: Forecast March 27Although the price increased yesterday, the D1 gold bar created a very large bearish pinbar, with a very long upper shadow and closed less than 1/2 of the range, closing inside the previous price bar, which was also a bearish pinbar. Such price behavior reflects the weakening of the upward price momentum, suggesting the possibility that prices may continue to level off or adjust downward. D1 gold chart structure is cumulative sideways.
With a strong inverted V structure from above, H1 gold showed strong selling block in the area around the round number 2,200 yesterday. The false break signal occurs when H1 gold surpasses recent price peaks and then quickly pulls back down again. Weakness is visible in both time frames. The main trend of H1 gold today is to wait for selling from the resistance above. If the price breaks out and rises further, you can wait to buy again, because at that time the short-term price increase strength has formed.

💡 EURUSD: Forecast March 27EURUSD yesterday rose to the resistance zone around 1.0855 and formed a selling pressure zone for us. You can enter a sell order with the bearish candle marked with a red arrow as shown in the chart.
Currently, the market is turning bearish. If you look at the low time frame, you can see this downward trend much more clearly. Our current trading strategy is selling. and the nearest resistance area is the supply area and is struggling around the previous peak at the price level of 1.0840. If the price can return to this resistance area, you can find a signal to sell.

Gold: Thoughts and Analysis Today's focus: Gold
Pattern – Price range
Support – 2154
Resistance – 2187
Hi, traders; thanks for tuning in for today's update. Today, we are looking at Gold daily.
What are we discussing and asking today after looking at Gold?
Could a close above resistance be the move that starts a new continuation higher?
If we see a break below support, this could be a false break and could set up a final HL.
Could buyers be out of gas as price consolidates and can't break resistance?
Good trading.
