USDCHF: Up for a ride?What we just saw on USDCHF is a classic move that catches many traders off guard:
Price swept the Previous Day’s Low (PDL)
That’s where most retail traders get stopped out.
It’s also where smart money often steps in.
Break of Structure (BOS) followed immediately
A clean shift in direction.
Momentum flipped bullish.
Fair Value Gap (FVG) below
That’s likely where price will return to rebalance.
If price respects that zone, the next destination?
The liquidity resting above.
This is one of those setups that reminds me:
It’s not about catching every move. It’s about understanding why the move happened.
Let’s see how it plays out.
Trendtrading

GBPUSD ANALYSIS Based on technical analysis GU is in a bullish trend and we should only be looking for buys.
Expect a pullback near the fibs reversal zone for a buy entry.
Risk Reward- 1% : 3 or your TP can be the 4H HH zone.
Keep your trading plan simple and only take quality trades in the direction of the trend. The trend is your soulmate.

They Had to Take Before They Could GivePrice swept below the previous day’s low (PDL), triggered liquidity, and gave us a clean BOS. This isn’t random, it’s intention.
Now, we wait to see if the market delivers the follow-through into that FVG below.
Your job isn’t to chase price. Your job is to recognize its story.

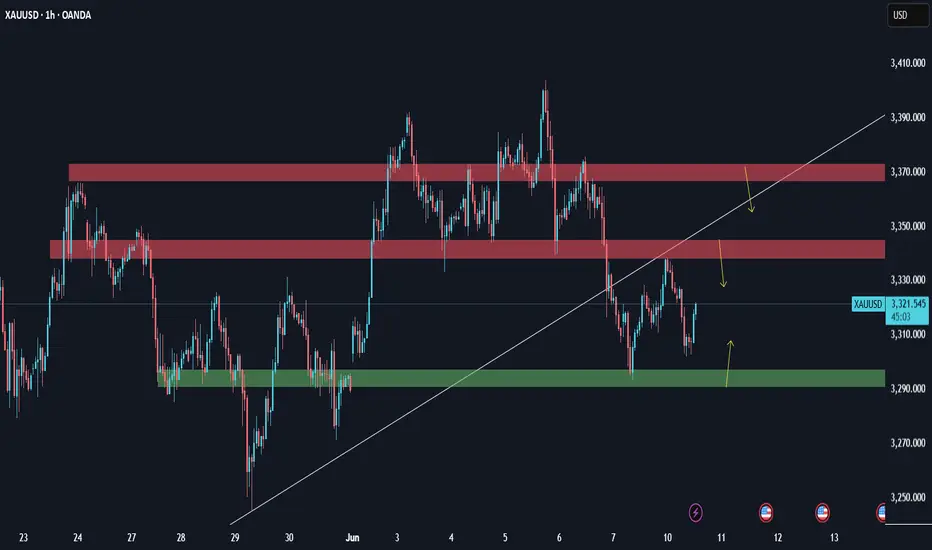
XAUUSD – Swing Trade and Trend FollowingXAUUSD – Swing Trade and Trend Following
Gold prices have been moving sideways, forming a consolidation range, and recently broke out to the upside last week.
Currently, the price is pulling back to retest the bullish Fair Value Gap (FVG). If it can bounce from the 3400 support level, the next target would be the Range Volatile Week High around 3500.
However, if the FVG fails to hold, the price may drop to the next support levels at 3350 and 3300.
These are critical supports that should not be broken, as they also align with the ascending trendline (Up Trend Line).
That said, this move is seen as a pullback for a potential continuation to the upside.
Strategy: Buy the dip
Wait for a reversal candlestick at the key support zones.
The bullish outlook would be invalidated if the price breaks below 3250.

Time to leave marketIf you are an investor, it seems the risk-to-reward ratio is too high to stay in the market. The crypto market is giving us the last chance before it goes bearish!
Just look at the volume on this chart to find out that the last ATH was not supported by the bulls.

There is another Bearish BPR zone below the current price.BTC/USDT Market Update – Clear, Detailed, and Easy to Understand (Even for Beginners)
Let’s take a look at what’s happening with Bitcoin (BTC/USDT) right now explained in a way that even someone new to trading can follow along and understand.
Recently, Bitcoin hit a new high it was climbing up steadily. But then, due to negative global news related to war, the market took a hit and started dropping sharply.
Currently, BTC is trading at a (BPR) this is a technical area that often acts as a strong resistance zone, where the price tends to face rejection and reverse.
👉 Right now, Bitcoin is struggling to move higher and appears to be getting rejected from this BPR level.
But here’s where it gets more interesting:
🔻 There is another Bearish BPR zone below the current price, and the market has already touched that zone once before bouncing upward.
So what's the current situation?
📍 If Bitcoin is able to break above the current Bearish BPR (the level where it’s trading now) — it would be a bullish sign, and the market may start rising again.
📍 However, if BTC fails to break this resistance level, then we could see another strong move to the downside, possibly heading back to lower support zones.
🚨 Key Takeaway:
This level — the one BTC is currently interacting with — is very important.
📌 Traders should keep a close eye on it.
📌 Let the market reveal its direction before making any decisions.
Remember:
⚠️ This is not financial advice. Always Do Your Own Research (DYOR).

XAUUSD: Analysis June 13This morning, the gold market witnessed a strong price increase after receiving two important news:
- US CPI was lower than expected, causing the USD to weaken.
- Israel continued to strike Gaza, raising concerns about escalating conflict in the Middle East.
🟨Trend: Strong increase - Break resistance
✅ Potential Buy Zone: 3410 – 3405: This is the breakout zone after the news, you can wait to buy if the price retests. SL 2399
❌ Potential Sell Zone (exit block or surfing):
✅ 3450 - 3455, SL 3461: Strong resistance, old accumulation zone (according to Bar chart, Resistance is determined at 3,455). If RSI/H1 shows overbought signal, consider taking profit or short Sell.

EURUSD Outlook – Long, Medium & Short-Term Analysis🔹 Weekly Chart:
The broader structure remains technically bearish. We've recently seen a trend reset, which could mark the beginning of a fresh downside leg.
🔹 Daily Chart:
A clear bearish trend reversal pattern has formed, accompanied by a manipulation phase. A confirmed break structure is now in place. As long as price remains below 1.15734, short positions remain valid.
🔹 4H Chart:
Currently in a range-bound phase. A confirmed break below 1.1371 will be a key bearish trigger for potential selling opportunities.
🔹 1H Chart:
Still ranging, but a valid Lower Low (LL) has already printed. A second LL below 1.1371 would confirm a short-term bearish continuation.
On the flip side, a break above 1.1495 would open the door for a bullish move in the short term.
📌 Key Levels to Watch:
Bullish above: 1.1495
Bearish below: 1.1371
Critical invalidation: 1.15734
Trade safe and stay disciplined.

Gold’s back on track, paying attention to momentum and hintsXAUUSD is still climbing steadily within its upward parallel channel, respecting structure beautifully as we’re now seeing early signs of bullish interest returning, right after we got a nice rejection from the support zone.
Currently I’m watching this bounce to have a target near 3,380 , somewhere around the middle line of the ascending channel. If this bullish push continues with strong volume and momentum, I’ll be locking in that bias and planning my entry accordingly.
Patience first, I always wait for price to prove itself before getting involved.
This could be a beautiful continuation…
Or just one more fakeout before a deeper drop.

Did You Catch the Sweep & Shift on GBPAUD?Sometimes the market whispers its intentions before making a move — and this was one of those moments. This GBPAUD setup was built on the core principles of Candle Range Theory (CRT):
Sweep of the Previous Day’s Low (PDL)
Break of Structure (BOS) confirming a shift in momentum
Entry retracement into the Fair Value Gap (FVG)
What stood out here was the precision of the sweep and how price reacted cleanly after BOS, tapping into the FVG zone and immediately pushing toward the high-probability target.
No indicators, no noise, just clean market structure and smart money behavior.
The temptation to enter early was real, but the edge came from waiting for price to validate itself. A textbook example of how patience and plan adherence outweigh prediction .

Full Cycle BTC Trendline Mid-2023 to Bull 2025Trendline stretching from mid-2023 lows through the entire bull structure into 2025.
Unbroken since inception
Touched 3+ times
Currently being retested from above
BTC is retesting the primary uptrend
Price dipped below it in April → false breakdown
May-June recovery has reclaimed it
Now sitting right at the trendline, testing it as resistance-turned-support
This is the ultimate decision zone
A daily or weekly close above $110K confirms the trend resumed
Rejection here → opens the door for retrace to $98K–$100K

XAUUSD: Analysis June 10Gold recovered to nearly 3340 yesterday after a sharp decline at the end of last week. But gold then declined again as the market digested positive signals from the US-China trade talks. There is no important economic data released from the US today, investors continue to monitor the developments of the US-China trade talks and CPI data released on Wednesday.
After falling to test the broken down channel, gold rebounded to near 3340. It is currently declining again, but is still moving steadily above the psychological support zone of 3300. In the European session, you can buy gold again when approaching this support zone again. Or you can sell according to the two resistance zones above.
NESCO at Resistance zone !!This is the Daily Chart of NESCO.
Nesco having good law of polarity at 1050 range.
NESCO is forming a pattern near its L.O.P, characterized by the development of an Ascending Broadening Wedge. The resistance zone for this formation is positioned between 1050 and 1060 levels
if this level is sustain, then we may see lower prices in NESCO.
THANK YOU !!

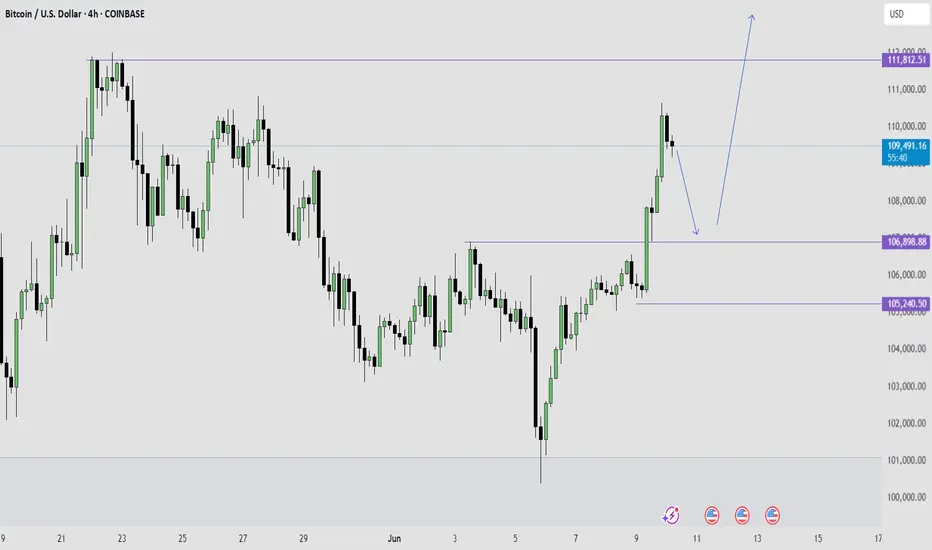
Bitcoin is Super Bullish Right Now - Here is my BTC trade planSince Bitcoin is super bullish on monthly and weekly time frame, my focus is to trade trend continuation pull backs on the 4HR time frame.
For this particular trade, I want to see a pull back to a key level of either imbalance or the old high serving as new support for price.
I will be taking a bullish trend continuation setup on that 4HR pull back.
Target:
I expect to see Bitcoin break that all time high of 111k level and go as high as 150k per one.
NVDA to $240 by 2026NASDAQ:NVDA is bullish still, anyone can see that, however I wanted to find some targets once it's in price discovery mode, well the golden pocket happpens to be $240 ($225-$250)
on weekly trend is confirmed extremely bullish so I'll continue holding and NASDAQ:NVDA should break $240 before 2026
Even a buy signal went off at the bottom in April. Let's see how much gas NASDAQ:NVDA has after it breaks the famous $150 resistance level

Gold Pullback Entry Opportunity Gold resumed its rally, sparked by recent tarrif news. Price is pulling back at the moment and has entered an sweet spot where we can confidently take our first low risk Buy.
BUYING HERE BECAUSE
1. We're entering into a low volume area, which is also in line with an FVG on the 1hr chart
2. When a new uptrend starts, i like to buy first 2 instances price pullback to bounce from my trend cloud indicator We didn't get a perfect bounce as it has broken below it, but i'am still buying regardless due to my first reason above about the low volume gap.
PROFIT TARGET
Setting my profit target to my trusted Exofade peak. As long as the uptrend continues, Exofade peaks will ALWAYS get taken out. That why i love this indicator, and its free. It's my gift to y'all :) . Just search for it in trading view indicators.

GOLD LONG IDEAGold has been extremely bullish in the last few months on higher time frame.
Monthly : Bullish
Weekly : Bullish
Daily: Bullish
4HR : Bullish
I will be buying this bullish trend retracement on 4HR time frame.
But I want to see a bullish price action before I enter the trade for long.
My overall target is the major high created in April.
My RR is 1:5.

HOW TO: The right way to use the MACDMany people mistakenly use the MACD histogram to enter trades without taking price action into context. In this video I'm going to show you how to interoperate the MACD Histogram, what it means and when its warning you.

Taming the Trend: Mastering the Williams Alligator IndicatorEver wondered how to spot when the market is sleeping or ready to roar? At Xuantify , we use the Williams Alligator Indicator to decode market behavior with precision. Whether you're trading crypto, forex, stocks, or indices — this tool adapts across all markets. Let's take a closer look using BINANCE:BTCUSDT
🧠 How We Use It at Xuantify
We treat the Alligator as a trend confirmation and timing tool . We don’t just look for crossovers — we analyze the distance , angle , and alignment of the lines to gauge market momentum and trend maturity. It’s especially powerful when combined with volume and volatility filters.
⭐ Key Features
Three Smoothed Moving Averages
Jaw (Blue) : 13-period, shifted 8 bars forward
Teeth (Red) : 8-period, shifted 5 bars forward
Lips (Green) : 5-period, shifted 3 bars forward
Visual Trend Clarity :
The spacing and direction of the lines reveal trend strength and direction
Built-in Delay :
Forward shifting helps anticipate rather than react
💡 Benefits Compared to Other Indicators
Trend Clarity
Alligator : Strong — bold trend visualization
Moving Averages : Moderate — can lag or overlap
MACD : Good — clear histogram and signal line
Noise Filtering
Alligator : Excellent — smooths out market noise
Moving Averages : Low — sensitive to short-term fluctuations
MACD : Good — filters minor moves
Early Signals
Alligator : Moderate — waits for confirmation
Moving Averages : Fast — quick crossovers
MACD : Fast — early divergence signals
Visual Simplicity
Alligator : Clear — easy to interpret trend phases
Moving Averages : Cluttered — multiple lines can overlap
MACD : Complex — requires interpretation of histogram + lines
⚙️ Settings That Matter
For shorter timeframes : Reduce periods (e.g., 8-5-3) for faster signals
For longer timeframes : Stick with defaults or increase smoothing for clarity
Shift values : Keep them forward-shifted to maintain predictive edge
📊 Enhancing Signal Accuracy
Wait for clear separation between the lines
Confirm with volume spikes or breakouts
Use price action (e.g., higher highs/lows) as confirmation
🧩 Best Combinations with This Indicator
Fractals : For entry/exit signals
ATR : For dynamic stop-loss placement
RSI or Stochastic : To avoid overbought/oversold traps
Volume Profile : To validate breakout zones
⚠️ What to Watch Out For
Flat Alligator = No Trade Zone : Avoid trading when lines are tangled
Lag in Fast Markets : In high-volatility assets, the Alligator may react late
Over-reliance : Always combine with other tools for confirmation
🚀 Final Thoughts
The Williams Alligator isn’t just an indicator — it’s a market behavior model . At Xuantify, we use it to stay aligned with the market’s rhythm, avoid chop, and ride trends with confidence.
🔔 Follow us for more educational insights and strategy breakdowns!

AMD LONG IDEA: AMD IS READY FOR A GOOD BULLISH RUNAMD is bouncing off the monthly time frame key level that is acting as support for price.
On weekly time frame and daily we had a shift in market structure from bearish trend to bullish.
I will be buying AMD on this retracement to the recent weekly gap created by price.
Once I see a good bullish price confirming that the retracement is over, i will enter for a buy trade.
My overall target is the 187 price level.

UBER – Momentum Pullback to 20 SMA: Classic Continuation SetupUber is giving one of my favorite swing setups — a shallow pullback into the “bone zone” (between the 9 EMA and 20 SMA) during a hot market.
🔹 Trend Continuation Play
Strong momentum stock pulling back right into the 20 SMA — not a deep retrace, just enough to reload.
In hot markets, I don’t wait for deep dips — I want tight consolidations into momentum zones.
🔹 The Bone Zone Setup
The shaded area between the 9 EMA and 20 SMA is where momentum stocks often base before the next leg up.
Price is respecting that zone perfectly — no breakdown, just controlled digestion.
🔹 Oversold Stochastics
Stochastics are in oversold territory — adds confirmation that this is a high-quality dip within a strong trend.
My Trade Plan:
1️⃣ Entry: Looking to start a swing position off the 20 SMA.
2️⃣ Add: On confirmation candle back above 9 EMA with volume.
3️⃣ Stop: Below 20 SMA lows — tight risk, strong reward if trend continues.
Why I Love This Setup:
Market’s hot — I want to ride strength, not fade it.
NYSE:UBER is a trending name with institutional accumulation.
This pattern has worked again and again in strong tape.

GBPAUD ANALYSIS Based on technical analysis GA is in a bullish trend and we should only be looking for buys.
Expect a pullback near the fibs tool reversal zone for a buy entry.
Risk Reward- 1% : 3 or your TP can be the 4H HH zone.
Keep your trading plan simple and only take quality trades in the direction of the trend. The trend is your soulmate.

GOLD ANALYSIS Based on technical analysis gold is in a bullish trend and we should only be looking for buys.
Expect a pullback double tap near the 50% reversal zone for a buy entry.
Risk Reward- 1% : 3 or your TP can be the 4H HH zone.
Keep your trading plan simple and only take quality trades in the direction of the trend. The trend is your soulmate.
