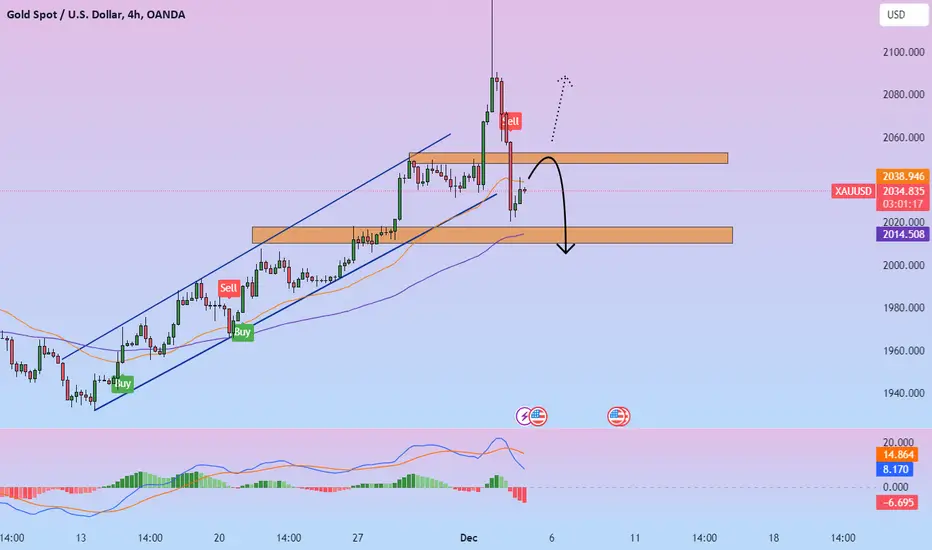
💡 XAUUSD: Analysis December 7, 2023Gold prices recovered slightly in the last session after two previous sharp declines, however this move did not bring significant changes to the current situation, selling pressure still showed dominance, the possibility of prices continuing continues to decline, you can continue to hold existing short positions, the target is still around the psychological resistance level of 2000.
Trendtrading

Eurusd Continuous BEARISH hello Guys .EURUSD Today is in a Down Trend Which we Don't Want to be Going Against it Because the Trend is your Friend Till the End, so am Going to be Expecting a Sweep and Continuation to the Downside.
FX:EURUSD

Trend Rotations and Trading OpportunitiesEURUSD seems to be displaying signs of a weakening bullish trend, paying homage to its prior structure with an immediate retracement.
For those eyeing a potential buying opportunity, I'm personally keeping an eye on the Bullish Shark Pattern, anticipating a 3-bar reversal around 1.0688.
That might just be the sweet spot for a promising buying opportunity! 🦈💱
What's your take on EURUSD's movement? Share your trade plans or thoughts on this trading setup in the comments below!
Let's discuss our strategies for navigating this market. 🗨️📈

Good time to buy Yesbank ShareYes bank chart looks very good at the moment to buy for the target 24 in next 2-3 months with a small Stoploss 18.50. Because it has good support at 19. I have recorded a detailed analysis video on it. you can see it.

USDT/DOT Speculative Trading IdeaBelow is a speculative trading idea for the DOT/USDT pair.
Currently, the asset's price has broken through an inclined level after updating the minimum at the price of $3.550 within the current global downtrend. After reaching the $3.550 level, there was a rebound, amounting to over 41% to the current price. This situation indicates an attempt to break the local downtrend in effect in 2023.
As we anticipate a price correction, we identify two entry points for the asset to continue the upward movement within this correction.
We place our first limit orders to buy DOT at price levels of $4.550 with a growth potential of 37% to the price level of $6.273.
We place our second limit orders to buy DOT at price levels of $4.220 with a growth potential of 50% to the price level of $6.273.

Bullish Wedge Pattern breakout in CHOLAFINCHOLAMANDALAM INVESTMENT & FINANCE LTD
Key highlights: 💡⚡
✅On 1Day Time Frame Stock Showing Breakout of Bullish Wedge Pattern.
✅ Strong Bullish Candlestick Form on this timeframe.
✅It can give movement up to the Breakout target of 1260+.
✅Can Go Long in this stock by placing a stop loss below 1080-.

Head & Shoulder Pattern breakout in HAPPSTMNDSHAPPIEST MINDS TECHNO LTD
Key highlights: 💡⚡
✅On 1Day Time Frame Stock Showing Breakout of Head & Shoulder Pattern.
✅ Strong Bullish Candlestick Form on this timeframe.
✅It can give movement up to the Breakout target of 935+.
✅Can Go Long in this stock by placing a stop loss below 842-.

Matic short ⏰ period analysis 📌Completely ⚡ short period analysis based on Trend support and supply and demand
With movement shift // pls #DYOR
👉 I am expecting COINBASE:MATICUSD shifted 🙄 it's movement bullish side 😛 in day frame LL >> HL
Use 1% position size of ur liquid 💰
Leverage must be below 4X cross 🤞
⏰ expecting 30-50 day's below later invalid 📌
🔥Buy :: $0.5 - $0.54 < split liquid 💰 60% - 40% >
🎯 :: $0.6238 - $0.6475 < move stop lose to entry or profit >
🎯 :: $0.7280 - $0.7575 < 💯% exit >
Stop 🚏 lose < #SL > ::- $0.4804

Potential Trend Trading Opportunity with Bullish Shark PatternNZDJPY reveals a promising Bullish Shark Pattern, presenting a potential trend trading opportunity.
While waiting for a 3-bar reversal offers further confirmation, it's prudent to engage post a weakening of the bearish move.
For aggressive traders, immediate entry might be considered, with a crucial emphasis on identifying stop levels to mitigate risk.
What are your insights or strategies on NZDJPY? Feel free to share your thoughts below!

USD/CAD ↘️ Short Trade setup ↘️Hello Everyone 🙋🏽♂️
Trendline Continuing
🟠 EP 1.36090
🔴 SL 1.36870
🟢 TP1 1.35253 ⚠️( Close 33% of the trade and Set the SL on EP )⚠️
🟢 TP2 1.34430 ⚠️ ( Close 33% of the trade )⚠️
🟢 TP3 1.33722 🔥 ( Final result)🔥
We are not responsible of any losses for anyone, our trades are profitable more for long terms and we take losses as everyone,
manage your lot size as well and your SL and TP and my opinion is 0.01 lot for each 500 $.
Don't forget to hit the like bottom and write a comment to support us.
Follow us for more 🙋🏻♂️
Best Regard / EMA Trading .
Disclaimer:
----------------
It's not a financial advise, As everyone we take losses sometime but for long term trading we are profitable traders, so manage your account well with SL and TP and your lot size to keep your account safe and stay in the market

USDJPY potential bullish patternAs can be seen in the chart, there is a falling wedge pattern in the chart, which is a naturally a reversal chart pattern and is regarded as an intrinsically bullish formation. This chart pattern is occurring at the important Fibonacci level of 38.2%, and the fact that we have bullish divergence between price and the stochastic oscillator in 4-hour timeframe adds to the possibility of this chart pattern working.
Entries may be initiated at the bullish breakout of the wedge pattern, and based on a one-to-one minimum price target strategy, we can anticipate the price to reach its previous daily high.
Also it should be noted that in case of bearish breakout of the chart pattern this trade idea has failed alongside the chart pattern.
If you've found this analysis helpful, please take a moment to like, comment, or share your thoughts with me.

💡 EURUSD: Forecast ADP-Nonfarm EURUSD is approaching the support zone on the daily frame around 1.0755, and you can see that the current price trend is bearish and the current structure on the H4 frame is bearish because the previous bottom is clearly broken.
However, the price action is not moving very well, the price forms quite weak and unclear price pushes as well as pullbacks. More importantly, there is no really strong peak to be seen. Strong latch to hold the price. In market moving conditions like this, as long as the most recent small peak in that price decline is broken, the possibility of the market reversing is quite high or at least forming a deep pullback.

💡 XAUUSD: Continue with the downtrendOANDA:XAUUSD Analysis December 6, 2023
Gold prices continued to slide in the past session after the extremely strong bearish pin bar signal formed earlier. Currently, the price is approaching the 2000 confluence zone. There are still no clear signs showing the return of buyers, short positions are profitable, you continue to hold positions, short-term target is around 2000 , you should consider risk reduction measures when the price approaches this resistance level.

GOLD / XAUUSD view for next hoursGOLD / XAUUSD looks like finished bullish trend
My view for next hours.
I expect turn now or a little bit to strong area

💡 XAUUSD: Strong price drop after breaking the peakOANDA:XAUUSD Analysis December 5
The momentum of H4 gold pushing down from its peak yesterday is very strong. It even surpassed the bottom of the previous strong rebound, thereby reversing the gold H4 trend from up to down. With strong bearish momentum and downtrend structure in H4, plus a bearish outside bar in D1, today's H4 gold can wait to be sold at the upswings.
MAPMYINDIA re entry?Entry triggered again, but did not re enter as was already scaled in other better performing stocks.
Lesson - Always have a pre defined number of stocks in which you will invest in at a particular time.

DXY (US DOLLAR INDEX) - HTF ORDERFLOWKEEPING IT SIMPLE - TVC:DXY
- HTF order flow
- price respecting htf fvg and holding up 50% of the htf bullish breaker block
- expect to see a continuation to long term high, could possibility see a reaction at the up coming FVG

GU LONGExpecting bullish momentum from GU
Confluences:
Rejection of 4HR Support
Consolidation @ the 1.2625 quarter level
Last day candle printed a HL

💡 EURUSD: Analysis on December 4OANDA:EURUSD Analysis on December 4
EURUSD is moving down in price, although the bottom has just been formed and the momentum is not really strong, but we can still watch for selling.
The nearest resistance area is around 1.0950. If the price returns to this area, we will look for opportunities to sell.

💡 EURUSD: Prediction for December 1After being blocked around the 1.1000 resistance zone, the price fell sharply in the past session as expected. Currently, a three-candle bearish reversal pattern has appeared on the daily and it has also violated the uptrend line, the signals show. This signal shows the possibility that the price will continue to adjust. Temporarily suspend trading for now, you should wait for the opportunity to return with buy orders around the price range of 1,075.

💡 GBPUSD: Reversal signal appearsThe price adjusted down sharply in the last session after the mentioned Doji signal, the downward force is quite strong and GBPUSD is only gradually escaping the overbought state, this is the time we can sell lightly, waiting for the price. recover then sell back. Avoid selling below

💡 GBPUSD: Increased structureGBPUSD's current structure is still bullish, but the market is currently at daily resistance so the current price action is slowing down but it can be seen that the short-term trend of this pair has also turned over. price increase.
Looking at the H4 frame, there are currently not many signs that the market may reverse, so temporarily you can wait for the price to break this current resistance area and then wait for the price to rebound to buy up.

💡 XAUUSD: Gold breaks all-time highSo the Gold price has officially broken its all-time peak and begun the search for a new peak. The chart below is a candlestick chart that visually represents the spot price of Gold on the OANDA:XAUUSD exchange. Based on the momentum indicator below, we can see that there is still a lot of room for Gold to increase, so maybe our main strategy in the near future for Gold should be to buy.
The necessary strategy now is to consider Buy Limit. Avoid buying high to prevent risks
