XAU/USDFor this week, I've considered the weekly gold candle and selected round numbers as targets. I think gold will go up and trade within its usual range. What's your opinion, buddy?
Trendtrading

GOLD Technical Analysis - Correction Incoming?OANDA:XAUUSD is trading within a well-defined ascending channel, with price action now testing the upper boundary. This level could act as dynamic resistance, and a rejection here could trigger a corrective move toward the 3,035 support zone.
If buyers defend this support, the bullish structure remains intact, with a potential move back toward higher levels. However, if price breaks below this zone, a deeper pullback toward the lower boundary of the channel could come into play.
Monitoring candlestick patterns and volume at this critical zone is essential for identifying buying opportunities. Proper risk management is advised, always confirm your setups and trade with solid risk management.
If you have any thoughts on this setup or additional insights, drop them in the comments!

Ready to ride the wave? Here's everything you need to know!🚨 Calling all Traders!🚨
XAUUSD is making moves and breaking records like never before! Here’s your latest update:
🔻 Bearish Scenario: Watch out for a potential drop below the 3120-3114 range. If it dips, targets such as 3000 and 3090 are next in line. Keep an eye on these key support levels! 👀
🔺 Bullish Scenario: If price breaks above this range, expect buying opportunities to open up! Look for action above 3120 with potential targets at 3130 and 3943. 📈💥
💡 Risk Management** is everything! Protect your capital and trade wisely! 💰
Jump into the conversation and share your insights! Let’s ride this golden wave to success together! 🌟

GOOGL - Elliott Wave Final ShowdownGOOGL has dropped over 27.28% , reaching a minor profit-booking zone. The $150 level serves as a key demand zone, where a potential price reversal could occur. The formation is either expanded flat or a running flat on the daily timeframe chart.
Confirmation is best observed near the lower trendline of the parallel channel. If bearish momentum persists, prices may decline further to the $142-$140 range before a strong rebound. Once the correction ends, the upside targets are $168, $180, and $195.
A new low will form if the previous low is breached. Further research will be uploaded soon.

EURCHF short bearish push expected
OANDA:EURCHF trend based analysis, we can see bearish trend in last period, we are have rectangle channel, which is breaked, price is start moving more bearish, its make few revers on sup zone, few touches of sup zone.
Now we can see strong bearish candle, from here now expecting this structure is confirmed and we can see now higher bearish fall.
SUP zone: 0.95500
RES zone: 0.94350

SOL | Accumulation Zones | BEST BUY ZONESSolana has topped out after its new ATH in January, and it has clearly marked the beginning of the bearish cycle since then.
The bearish-M pattern in quite significant in the weekly timeframe. ( More info on that pattern here, on the ETH chart ):
From a technical indicator perspective, we see a clear "sell" sign - a strong signal from a trend-based indicator:
Which every way we are heading down (stair step or pin drop), there are a few noteworthy zones to watch:
_______________________
BINANCE:SOLUSDT

GBPAUD expecting GBP to start weakening
OANDA:GBPAUD price in channel, its make bullish push in last periods, in week before we are have BOE and some events in last day two like GBP CPI, from events looks like GBP is gather bearish power and technicals on lower TFs are strong bearish.
We are have and TRIPLE TOP apttern, on top of channel.
Here for next periods expecting bearish changes.
SUP zone: 2.06200
RES zone: 2.01500, 2.00600

SPY Price Projection: Mid-2025 TargetRevealing Market Trends: Logarithmic Regression Analysis Indicates Bullish Path for SPY
In the ever-evolving realm of financial analysis, the search for reliable predictions remains ongoing. Logarithmic scale regression analysis, coupled with potent indicators, has emerged as a promising tool for discerning trends, particularly regarding assets like the SPY.
This analysis delves into the utilization of logarithmic scale regression alongside two robust indicators, offering insights into the potential trajectory of the SPY's price movement. It's essential to note that the interpretations and predictions presented are based on my analysis alone and should not be construed as financial advice. As with any market analysis, uncertainties persist, and actual outcomes may diverge from projections.
Logarithmic scale regression accounts for the exponential nature of price movements, providing a nuanced perspective on long-term trends. When combined with indicators such as moving averages or momentum oscillators, the analysis gains depth, revealing not only the direction but also the strength of the trend.
After meticulous examination of historical data and the application of analytical tools, our analysis suggests a bullish trajectory for the SPY, with a projected price nearing 620 EUR by mid-2025. This projection implies a significant uptrend from the current date, with a potential increase of approximately 20% over the specified timeframe.
However, it's crucial to approach such forecasts with caution, recognizing the inherent risks associated with financial markets. While our analysis indicates a positive outlook, market conditions can change rapidly, leading to deviations from expected trends.
In summary, logarithmic scale regression analysis, supported by robust indicators, offers valuable insights into market trends and potential price movements. While our analysis suggests a bullish sentiment for the SPY, investors should conduct thorough research and seek professional advice before making investment decisions.
Disclaimer: The analysis provided is based on personal interpretation and should not be considered financial advice. Investing in financial markets carries risks, and actual outcomes may differ. Readers are encouraged to conduct their own research and consult with financial professionals before making investment decisions.

USDJPY - Key Levels to WatchThe USD/JPY pair is showing an interesting setup on the 4-hour chart—here's what to watch:
🔹 1️⃣ Ascending Channel in Play: The pair is trending within a bullish channel, signaling an overall upward momentum. Traders should keep an eye on this structure for potential opportunities.
🔹 2️⃣ Support Zone Under Test: Price action is near the critical blue-shaded support area at 149.815. This level has historically held as a strong rebound zone. Buyer activity here could determine the next move!
🔹 3️⃣ Potential Scenarios:
Bullish Case: A strong bounce from the support zone could propel the price higher, maintaining the channel's bullish trend.
Bearish Case: A failure to hold the support level may lead to further declines, possibly testing the lower boundary of the channel.
Insights for Traders: Patience is key—monitor the 149.815 zone for signals before committing to a trade. The combination of price patterns and volume data will provide clarity.

NAS100: Likely rebound at major point within Ascending ChannelCAPITALCOM:US100 is likely to be undergoing a corrective move as it tests the lower boundary of the ascending channel, as shown on my chart. This boundary serves as dynamic trendline support and a significant bullish reaction could happen if buyers step in at this level.
A successful rebound from this support could lead to a move toward the midline of the channel, with the next target at around 22,000 . This scenario would maintain the overall bullish trend structure.
However, a clear breakdown below the trendline support would weaken the bullish outlook and could lead to further downside.
Monitoring candlestick patterns and volume at this critical zone is essential for identifying buying opportunities. Proper risk management is advised, always confirm your setups and trade with solid risk management.
If you have any thoughts on this setup or additional insights, drop them in the comments!

AIAENG 12R to 20R trade set up1. Trend: sideways to bullish
2. Set up: Reversal
3. SL: follow on closing basis

How to Spot Market Turns using Order Flow & Delta Volume Ind.Overview
The Order Flow / Delta Volume Indicator combines order flow dynamics with delta volume analysis , pinpointing market shifts by tracking buying and selling pressure . This chart analysis demonstrates how effectively the indicator identifies precise moments of market turns and shifts in momentum.
How It Works
Order Flow Dynamics
Tracks cumulative buying and selling volumes.
Identifies potential reversals by highlighting shifts in order flow direction.
Delta Volume Analysis
Measures the difference between buying and selling volume (delta).
Pinpoints exact candles where buyer-seller imbalance occurs.
Signal Generation Logic
Buy signals emerge when order flow and delta volume confirm rising buying pressure.
Sell signals appear when order flow combined with negative delta signals increased selling activity.
Signal Confirmation (Magical part of this Indicator), Blue line inlines with trend to confirm the strength, else it's a trap move.
Performance in This Case Study
Market Reversal Precision
Accurately highlighted buy signals at key reversal points where bullish order flow resumed.
Provided timely sell signals precisely at points of bearish order flow dominance.
Trend Confirmation
Signals effectively filtered market noise, clearly distinguishing actual trend shifts from temporary price fluctuations.
Consistent alignment of signals with subsequent price action confirmed robust indicator performance.
Volume-Based Clarity (Blue Line)
Delta volume effectively differentiated real momentum changes from false breakouts.
Order flow dynamics reliably indicated market sentiment shifts, offering clarity in volatile conditions.
Key Takeaways
✅ Order flow shifts clearly indicated genuine trend reversals.
✅ Delta volume accurately pinpointed moments of market imbalance.
✅ Signals reliably differentiated between temporary fluctuations and meaningful market movements.
✅ Indicator performance remained robust across varying market conditions.
This indicator's precise alignment with market behavior underscores its practical utility in identifying and analyzing market turns.

EURCAD time for revers?
OANDA:EURCAD whats next, EC last one month we are have bullish run, currently price is in zone, technicals lower TFs are strong bearish, +we are have and BOC week before.
My view here is price is saturated and we can see fall now.
SUP zone: 1.57500
RES zone: 1.53900, 1.53400

SPY Technical Outlook - Will Buyers Step In?AMEX:SPY is experiencing a corrective move after rejecting the upper boundary of the ascending channel. This rejection led to increased selling pressure, bringing price back to the lower boundary of the channel, where buyers may step in to defend the trendline support.
If the price holds at this dynamic support level, a bullish reaction could send AMEX:SPY toward the midline of the channel, with the next target around 607.00. Holding above this level would reinforce the bullish trend structure and increase the probability of continuation toward the upper boundary of the channel.
However, a breakdown below the trendline support would weaken the bullish outlook and open the door for further downside. Monitoring price action, volume, and confirmation signals will be crucial in determining the next move.

META at Trendline Support - Will Buyers Push Toward $696?NASDAQ:META is currently undergoing a corrective phase following a sharp rejection at the upper boundary of its ascending channel. The recent pullback has driven the price back toward the lower boundary of the channel, where buyers are now looking to step in.
If buyers manage to defend this support level, we could see a move toward the midline of the channel, with the next key target at $696. A break above this midline would confirm the continuation of the bullish trend, potentially bringing the price back toward the upper boundary.
However, a failure to hold trendline support could weaken the bullish outlook, leading to a potential breakdown and further downside pressure. Price action near this critical zone will be key in determining the next directional move.
Traders should monitor candlestick formations and volume for confirmation. As always, managing risk effectively is essential when trading this setup.
If you have any thoughts on this setup or additional insights, drop them in the comments!

Beginning of the Uptrend for Stock #01Beginning of the Uptrend for Stock #01: 9988 (BABA)
The price has broken out of a consolidation range that lasted approximately two years, supported by a normal volume distribution.
The stock has risen to meet the Fibonacci Extension resistance level of 161.8 at a price of 144 HKD. Currently, it is forming a sideways consolidation pattern on the smaller timeframe, establishing a base structure viewed as re-accumulation.
The 6-month target is set at the Fibonacci Extension level of 261.8, which corresponds to a price of 189 HKD. This target aligns with a price cluster based on the valuation from sensitivity analysis, using the forward EPS estimates for 2025-2026 as a key variable for calculations, along with the standard deviation of the price-to-earnings ratio.
Wait for the Right Moment to Accumulate Shares within the Consolidation Range
Purchase near the support level of the range when the price pulls back. Look for a candlestick reversal pattern as a signal to add to your position.
However, should the price break down to the lower consolidation range, the stock would lose its upward momentum, potentially leading to a prolonged period of consolidation or a deeper pullback to around 90 HKD.
Always have a plan and prioritize risk management.

BTCUSD 1H | POI Reaction Setup After Sweep – Short Flow by CelesBTC tapped into a clean POI zone after sweeping highs.
A market structure shift (MSS) formed, showing early signs of bearish intent.
Price is now reacting from the zone, and we’ve mapped the clean flow toward the 2H demand base.
Invalidation is clearly marked — a clean break above 88,005 would flip the bias.
Precise POI, projection, and target laid out.
— CelestiaPips

GOLD 1H | Bearish POI Reaction Setup – Clean Flow by CelestiaPipPrice is reacting to a high-probability POI formed via supply + imbalance on GOLD 1H.
After the sweep and minor bullish correction, we’re now back into the rejection zone.
As long as price holds below 3030 , we could see continuation toward 2981 .
Key levels, invalidation zone, and structure mapped clearly.
Watch how price responds — setup in motion.
— CelestiaPips

USOIL To Retest $70.5I'm watching TVC:USOIL for a strong push towards at least the $70.5 level, though this area presents significant resistance.
A confirmed break of the bearish trend could fuel strong buying momentum, but patience is key.
Ideally, I’d like to see a solid rejection off the $68.5 level as confirmation before a move higher.
If we get a decisive breakout above $70.5 with sustained bullish momentum, my next target would be the major resistance around $75.

3/24/25Happy Monday
@ 9:45am we have news:
US Flash Manufacturing PMI
US Flash Services PMI
As long as this long trend line isnt broken, I will look for an entry at 3038 AFTER 10:00am

S&P500 Next Key Levels I will be waiting to see if we get some short term buying before continuing down to $5,200 levels.
Waiting for price to reach the $5,800 area and anticipating a strong rejection to continue the bearish trend.
After confirmation of the rejection, I will be looking for simple lower lows, lower highs before entering a sell, preferably around the $5,600 mark.
What are your thoughts on the AMEX:SPY and the THINKMARKETS:USDINDEX in general?

GOLD Trending Higher - Will Buyers Push Toward 3,012?OANDA:XAUUSD is trading within a well-defined ascending channel, with price action consistently respecting both the upper and lower boundaries. The recent bullish momentum indicates that buyers are in control, suggesting a potential continuation.
The price has recently broken above a key resistance zone and may come back for a retest. If this level holds as support, it would reinforce the bullish structure and increase the likelihood of a move toward the 3,012 target, which aligns with the channel’s upper boundary.
As long as the price remains above this support zone, the bullish outlook stays intact. However, a failure to hold above this level could invalidate the bullish scenario and increase the likelihood of a pullback toward the channel’s lower boundary.
Remember, always confirm your setups and trade with solid risk management.
Best of luck!

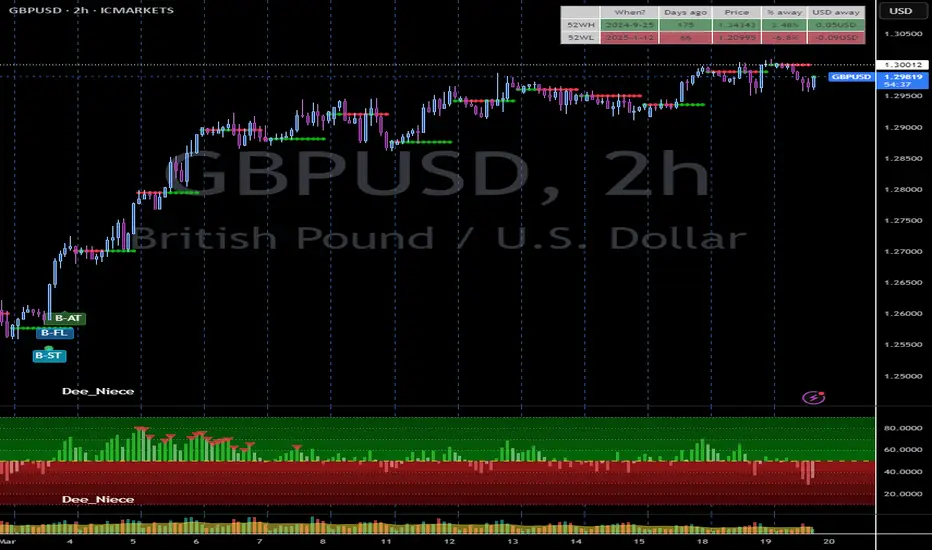
Don't make it harder, make it simple and clearerAs I always says : Find the trend, Follow the Trend and Stay on the Trend.
Trading is hard, too many parameters to consider so why make it harder.
Wait for confirmation before jumping on shorting $GBPUSD.