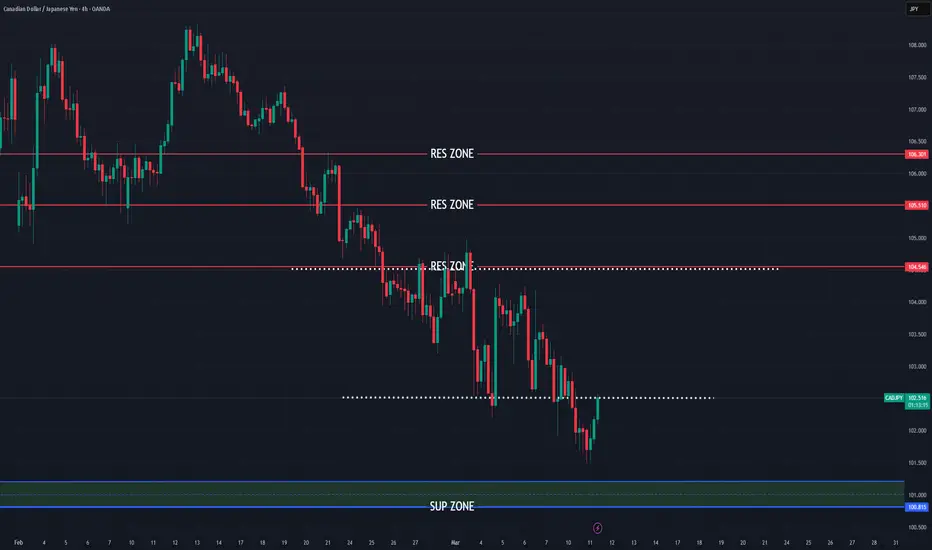
CADJPY having strong bullish signs
OANDA:CADJPY PA based trade, currently price on bottom line, JPY showing signs of losing power, with some other currencies it's already confirmed bearishness. We are have and event GDP from JPY today, which looks like its have impact here.
Here now expecting strong bullish push till top trend line (RES zone) and having look we will see and break of top trend line and higher bullishness is exepcted here
SUP zone: 101.200
RES zone: 104.550, 105.500, 106.300
Trendtrading
How to Draw Trendlines Like a Pro – Rulers Out, Rules In!Hi everyone!
If you don’t have any rules for drawing a trendline, then this is by far the most subjective technical analysis criterion of all. So, grab your ruler, and let’s dive in! ;)
Without clear guidelines, you can draw it however you want, shaping the narrative to fit your bias. This makes it the perfect tool to talk yourself into a trade or justify staying in a bad one—there’s always a new “support” coming…
If you don't have rules, you can always find some dots to connect, making it look "perfect" for you.
In this post, I'll discuss buying opportunities using trendlines, share key rules for drawing them correctly, and highlight common mistakes to avoid - all with a focus on mid- and long-term investment opportunities.
-------------------------
The Basics: How to Draw a Trendline
The trendline is a highly effective tool for mid- and long-term investors to find an optimal buying zone for their chosen asset. I always take a full view of the chart, analyzing its entire history to find the longest trendline available. The longer the trendline, the stronger it is!
To draw a trendline, we simply connect two points and wait for the third touch to confirm it. Easy, right?
The strongest trendline comes from points that are easily recognizable—you should spot them in a split second.
Maximum view, if possible Monthly chart, connect the dots and wait for a third one.
For me, the third and fourth touches are the most reliable.
If you have to look deeply to find where to draw a trendline, then it's already a first sign that it’s not strong! The best ones appear instantly.
---------------------------
Two Myths About Trendlines
Myth #1: "You cannot draw a trendline without three touching points."
Don’t even remember from where I heard that kind of bs but as you see in the images above, yeah I can. If I have a correct lineup, the third touch is the strongest.
Myth #2: "The more touches, the stronger the trendline."
Yes, a trend appears stronger with more touches, but each additional touch increases the odds of a break or trend change. To buy from, let’s say, the sixth touch, there must be strong confluence factors, and fundamentals should support the investment.
“The trend is your friend, until the end when it bends.” — Ed Seykota
Sure, I’ve had great trades from the fifth or seventh touch, but as said, the area has to be strong, combining multiple criteria. Think of a trendline like 3-5 cm thick ice on a lake. You can’t break it with one hit, or the second, or the third. But after the fourth or fifth, it starts to crack, and by the sixth—boom!
From my psychological perspective, the more touches, the weaker the trendline becomes.
-----------------------
Rule #1: Wick to Wick or Body to Body
If there aren't any anomalies, the trendline should always be drawn from wick to wick (image below) or body to body.
Here was the trendline draw from wick to wick
I mostly use body-to-body when there is a lot of noise on the chart and many large wicks that don’t show the real price behavior—whether from a panic sell-off or other unexpected market moves.
Candlestick chart, the trendline drawn from body-to-body
Tip! Body-to-body means drawing trendlines from closing prices to remove unnecessary noise from the chart. To make the chart even clearer, I often use a line chart (it tracks closing prices), which filters out the noise and gives a cleaner view of the price action.
The same chart as above using line chart.
Mistake to avoid: If you start from the wick but the second point is from the body, it's wrong. This can lead to misleading breakout trades or confusing rejection trades.
If there are no significant large wicks, go from wicks.
If a chart offers a lot of huge panic-sell wicks, use bodies instead to get a cleaner setup.
Quite often, I use a hybrid version as well. We are investors, not traders. We need a price zone, not an exact price!
In these cases, I combine wicks and closing prices to find the optimal trendline, which stays somewhere between them.
Light-blue is the zone
-----------------------
Rule #2: Higher Highs Strengthen the Trendline
A trendline is more reliable if the price makes a new higher high (HH) after the previous rejection, and before it approaches a trendline.
The third and fourth touch came from higher high (HH) levels
This confirms that the recent trend is strong. If it all lines up, we can step in!
-----------------------
Rule #3: Even Timing Between Touches
A trendline rejection works best when the timing between touches is symmetrical. They don’t have to be perfectly equal but they also shouldn’t be wildly different - one touch being very small and another very large can weaken the trendline’s reliability.
A good combinations is when the price comes from higher high levels, the next touch has an equal or fairly similar distance between previous ones.
Yeah, there are quite a lot of touches, but you get the point; market symmetry plays an important role in making decisions.
Warning: If the next touch comes too soon, especially from a lower high (LH) levels, which signals that momentum may be fading, and the touch happens at an uneven distance, it weakens the trendline’s reliability. So, watch out for that.
Two alerts: uneven length between touches & comes from lower highs.
Next red alert: When there are huge uneven gaps between touches, as shown in the picture below.
The first and second touch compared to the second and third touch are out of balance, weakening the trendline's reliability.
------------------------
Trendline Summary: Key Criteria for Mid- to Long-Term Analysis
Open the maximum chart view – analyze all available data for the asset.
The higher the timeframe, the stronger the trendline.
A trendline needs two clean and clear points to be drawn.
The highest probability rejection happens at the third and fourth touch.
If there are large wicks or panic sell-offs, use closing prices (body-to-body).
Remove noise and wicks by using a line chart for a clearer view.
A trendline touch is strongest when the price approaches from a higher high (HH).
A trendline touch is strongest when the distance between touches is symmetrical.
A slight flex in the trendline is ideal; it should be between 20 to 35 degrees, not too steep in its climb. ;)
These are the main criteria for a trendline that I use when analyzing stocks or any asset from a mid-to long-term perspective.
----------------------
Trendlines Alone Are Not Enough
Now, here’s the interesting part. Even if a trendline looks perfect and meets all criteria, I still won’t rush to share an analysis. Why? Because a trendline alone isn’t enough.
A trendline is just one piece of the puzzle. We need multiple confluence factors in a single price zone to make the setup truly strong and reliable. Usually, I need at least 3-7 criteria to align before making a move or recommendation.
So, that's it! A brief overview and hopefully, you found this informative. Feel free to leave a comment with your thoughts!
Before you leave - Like & Boost if you find this useful! 🚀
Trade smart,
Vaido

AUDNZD strong bullish expectations
AUDNZD pair which I am watching last 5 months, other my analysis on AUDNZD are attached, plus I am attach and CADCHF analysis its interesting to look, its almost same based on SYMMETRICAL TRIANGL.
AUDNZD price is make bounce on trend line, its break upper trend line-SYMMETRICAL TRIANGL, plus CHANNEL on 4h TF is visible and its also breaked.
Technicalls on medium and long term are strong bullish, when take all this parameters i am here still bullish.
SUP zone: 1.09200
RES zone: 1.11500, 1.12400

GOLD ROAD MAP 3000 TO WATERFALL ALERT!🔥 Attention Traders! 🔥
XAUUSD is on fire! 🔥 Here's the latest update:
🔻 Bearish Outlook: Watch out for a potential drop if price falls below 2979. Targets: 2940 & 2960.
🔺 Bullish Outlook: A breakout above 2989 could lead to buying opportunities! Watch for targets: 3000 & 3020.
📈 Stay Tuned: Share your thoughts and strategies as we navigate this golden market! Let's hit new highs! 💰🚀

GBPNZD Bullish Continuation - Will Buyers Push Toward 2.28000?OANDA:GBPNZD is trading within a well-defined ascending channel, with price action consistently respecting both the upper and lower boundaries. The recent bullish impulse suggests that buyers are maintaining control, indicating a potential continuation toward the upper boundary.
The price has recently broken above a key resistance zone and may come back for a retest. If this level holds as support, it would reinforce the bullish structure and increase the likelihood of a move toward 2.28000, which aligns with the channel’s upper boundary.
As long as the price remains above this support zone, the bullish outlook remains valid. However, a failure to hold the support zone would invalidate the bullish scenario and open the possibility for a deeper pullback toward the channel’s lower boundary.
Remember, always confirm your setups and trade with solid risk management.
Best of luck!

BTCUSDT: Signals a 2-Week Retest—Trend Still Alive
BTC’s been wild, but zoom out to the 2-week chart— we’ve got a solid uptrend with higher highs and lows. Last week’s dip isn’t a reversal—it’s a retest of the 50-day EMA (around $64.8k as of March 10, 2025). Volume’s thinning, RSI’s looks oversold. Indicators flashed a ‘hold’ here—no sell signal yet, which tells me the trend’s got legs or at least a bounce.
Bullish Case : If BTC holds the retested level (e.g., a prior resistance-turned-support), it could resume upward momentum. A two-week stabilization suggests accumulation, and a break above the recent high could target the next psychological level (e.g., $90,000).
Bearish Risk : If the retest fails—price breaks below the key level with high volume—it could signal a deeper correction, potentially revisiting lower supports (e.g., $70,000 or $60,000). A two-week trend turning into a failed retest might indicate profit-taking or macroeconomic pressure with all the news.
It's worth just taking a zoomed out look, no panic just yet and let it play out a little more.

BTCUSDT 1WI hate to say it... but all signs point to a bear market...
From the nonsense weekly candle to negative divergence and channel ceiling and...

Daily Chainlik Analysis - #LINK March 07#Chainlik #LINK
LINK managed to stay above the weekly support zone during the recent decline. If LINK coin declines to the 4-hour key level zone specified in the analysis, investments can be evaluated with a daily candle closing stop below the $ 14.22 level.
As long as LINK coin stays above the $ 15.65 level, the bullish target will be $ 18.21 - $ 19.94 respectively. LINK investors can follow important support and resistance levels in the analysis. LINK coin needs to close daily candles above the $ 18.21 level in order to continue the rise.
NFA

GBPCADrange side in up trend
gbpusd is on supply zone
gbpusd is up trend as you know trend is your friend so trade with trend
Gold (XAUUSD) Breakout Setup – Targeting $3,014Gold is showing strong bullish momentum on the 1H timeframe, forming a breakout structure with a well-defined resistance and support zone.
Key Levels:
📌 Resistance: Around $2,940 (previous rejection zone)
📌 Support: Around $2,900 (previous consolidation zone)
📌 Target: $3,014 (+3.16% move)
Technical Analysis:
🔹 Gold recently broke out of a bullish flag pattern after a strong uptrend.
🔹 Price successfully retested the support zone and is now pushing higher.
🔹 A breakout above $2,940 could trigger a sharp rally towards the $3,014 target.
🔹 Volume confirmation and strong momentum support further upside potential.
Trade Plan:
✅ Long above $2,940 with a target of $3,014
❌ Stop-loss below $2,900 to protect against fake breakouts
Gold remains bullish, and if the price holds above the breakout zone, we could see a strong move higher! 🚀

GOLD Trade Alert: Buy Now at 2917### **📢 GOLD Trade Alert: Buy Now at 2917 🚀**
📍 **Entry:** **2917** (Buy)
🎯 **Take Profit Targets:**
✅ **TP1:** **2925** (+80 pips)
✅ **TP2:** **2930** (+130 pips)
✅ **TP3:** **2935** (+180 pips)
🛑 **Stop Loss:** **2908** (-90 pips)
📉 **Support Level:** **2915** (If price holds, bullish momentum is strong)
📈 **Resistance Level:** **2920** (Breakout confirms further upside)
---
### **🔹 Trading Strategy & Risk Management:**
✅ **Bullish Confirmation:** If price **breaks 2920 resistance**, expect momentum toward TP1 and beyond.
✅ **Risk-to-Reward Ratio:** Approximately **1:2**, ensuring a solid risk-reward setup.
✅ **Money Management:** Adjust lot size according to **your risk tolerance**.
📈 **Trade smart, secure profits at each TP, and manage risk effectively! 🔥**

GBP/USD: Bulls in Control… For Now! Key Levels to Watch Hello Folks
GBP/USD is holding strong above 1.2533, and I see a potential bullish move toward 1.2805 if momentum continues. But I’m staying flexible—if price breaks below 1.2450, my bias shifts, and I’ll look for downside targets instead. 📊
📍 Here’s how I see it:
✅ Bullish above: 1.2533 → 1.2627 → 1.2650 → 1.2805 🚀
❌ Bearish shift below: 1.2450 → 1.2378 👀
💡 My Plan:
As long as GBP/USD stays above 1.2533, I’m bullish and expecting a push toward 1.2805 📈
If price drops below 1.2450, I’ll reconsider and look for shorts instead 📉
⚠️ No need to rush—let the market confirm the move!

S&P500 $SPY | SPY’s All-Time High - Where to Next? | Feb23'25S&P500 AMEX:SPY | SPY’s All-Time High - Where to Next? | Feb23'25
AMEX:SPY BUY/LONG ZONE (GREEN): $597.50 - $613.23
AMEX:SPY DO NOT TRADE/DNT ZONE (WHITE): $584.88 - $597.50
AMEX:SPY SELL/SHORT ZONE (RED): $574.00 - $584.88
AMEX:SPY Trends:
AMEX:SPY Weekly Trend: Bullish
AMEX:SPY Daily Trend: Bullish
AMEX:SPY 4H Trend: Bullish
AMEX:SPY 1H Trend: Bearish
AMEX:SPY just reached a new all-time high! How did price get there?
AMEX:SPY experienced a small range between 602.45 – 604.00, followed by bearish momentum, leading to a 3% drop in price. However, bullish momentum quickly stepped in, pushing the price up before continuing downward again. This bearish trend was short-lived and appears to have formed a developing range rather than a sustained downtrend.
Shortly after, price broke back above 597.50, signaling the start of a new bullish trend. SPY then established a ranging pattern between 597.50 - 608.00 before ultimately breaking out to a new all-time high of 613.23. Despite the breakout, price action has now dropped back into the range between 597.50 - 608.00.
Where to next? Will SPY hold its new highs, or is this the start of a reversal?
This is what I would personally look at before entering trades, everything is subject to change on a daily basis and as I analyze different timeframes and ideas.
ENTERTAINMENT PURPOSES ONLY, NOT FINANCIAL ADVICE!
trendanalysis, trendtrading, priceaction, priceactiontrading, technicalindicators, supportandresistance, rangebreakout, rangebreakdown, rangetrading, chartpatterntrading, chartpatterns, spy, sp500, s&p, fed, federalreserve, fedrate, AMEX:SPY , snp, snp500, usmarket, usmarkets, stockmarket, overallmarket, spyath, spyalltimehigh, all-time high, price action, bullish trend, bearish momentum, trading range, breakout, support and resistance, choppy market, untradable zone, stock market, technical analysis, market trends, price breakout, volatility, trend reversal, stock trading, SPY analysis, market momentum, trading strategy, sparros, sparrosexchange,

AUDCHF: Bearish continuation - Will it reach 0.55190?OANDA:AUDCHF is trading within a well-defined descending channel, with price action respecting both the upper and lower boundaries. The recent rejection from the resistance zone suggests sellers are maintaining control, supporting a potential continuation of the downtrend.
As long as the price remains below the resistance level and the channel's upper boundary holds, the bearish structure remains intact.
A potential downside target is 0.55190, aligning with the lower boundary of the channel. A break and close below this level could signal further bearish momentum.
However, a breakout above the resistance zone would invalidate the bearish scenario and may indicate a potential reversal or deeper pullback.
Always confirm your setups and trade with solid risk management.
Best of luck!

$CRM lower guidance, weak numbers, AI poopieNYSE:CRM should see sell pressure into the $285 zone and if it doesn’t hold expect $270’s.
WSL

STOXX50 Maintains Bullish Momentum — Targeting $5,605ICMARKETS:STOXX50 remains within a well-defined ascending channel, with the price showing a rebound from the midline of the channel. This suggests a continuation of the broader uptrend, with the next potential target near 5,605, aligning with the upper boundary of the channel.
A minor pullback could present a potential entry opportunity if buyers maintain control. Confirmation through bullish candlestick patterns—such as bullish engulfing or hammer formations—may strengthen the bullish case and drive momentum toward the 5,605 level.
A breakdown below the channel’s lower boundary would invalidate the bullish outlook and could indicate a potential shift in market direction. Monitoring how price reacts around the midline will be crucial for assessing continued bullish momentum.
Remember, always confirm your setups and trade with solid risk management. Best of luck!

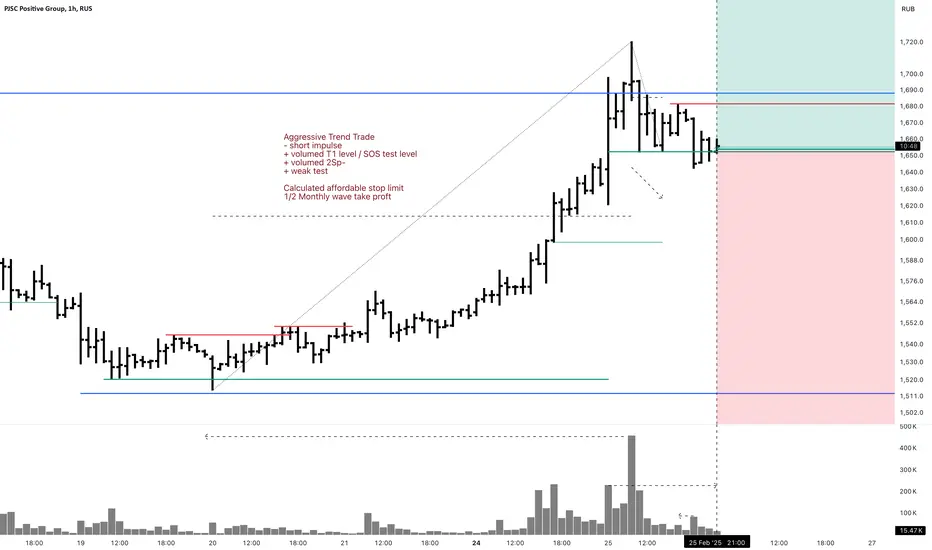
POSI 1H Investment Aggressive Trend TradeAggressive Trend Trade
- short impulse
+ volumed T1 level / SOS test level
+ volumed 2Sp-
+ weak test
Calculated affordable stop limit
1/2 Monthly wave take profit
Daily Trend
"+ long impulse?
- resistance level
- short volume distribution"
Monthly Trend
"+ long impulse
+ 1/2 correction
+ volumed expanding T1
+ support level
+ biggest volume manipulation"
Yearly Trend
+ long impulse
Weird set up. Market is strong and Monthly look a lot like exhaustion!
A big decline on BAN/USDT upcomingWhile every single indicator shows that BAN/USDT shows strong buy , our team diagree. Let's find out why..
Ban in the past 24hrs had a big pump of 120% , clear sign of manipulation..
Buyers started coming in and the coin will liquidate all of them..
A drop of 33% is expected from this coin..
Lets see if we are right on this one..

GBP/USD Trade Recap – A Perfect Long Setup 1️⃣ Trade Execution – Why I Took the Long Position
Today’s GBP/USD trade was a textbook example of combining Fibonacci retracements, smart money positioning, and seasonality trends to catch a high-probability long setup.
💡 Entry Details:
✅ Entry: 1.2600 (Fibonacci golden zone)
✅ Stop Loss: 1.2587 (Below structure)
✅ Take Profit: 1.2635 (Key resistance zone)
✅ Risk-Reward Ratio: 3:1
🎯 Result: Hit TP at 1.2635 for a solid profit! ✅
2️⃣ Why This Trade Worked – A Breakdown of the Confluences
📊 Fibonacci Retracement – Perfect Pullback & Reversal
Price retraced to the 61.8%-78.6% Fibonacci zone (1.2600 - 1.2593) before reversing.
The bullish move was expected after a strong impulse leg, following smart money positioning.
📈 Smart Money & Retail Sentiment – Trading Against the Herd
🔹 62% of retail traders were SHORT on GBP/USD (as per DMX data).
🔹 Since I trade against retail sentiment, this provided a strong bullish confirmation.
🔹 Institutional COT data showed big players increasing long positions, further supporting a bullish bias.
🕵️♂️ Seasonality & Historical Trends Supported the Long
📊 15-year seasonality data indicated GBP/USD typically rallies in late February and early March.
📅 The next 3-5 day forecast showed a bullish probability, adding further conviction.
📉 Technical Confirmation – Momentum Indicators & Structure
✅ SuperTrend flipped bullish on the 4H chart
✅ Price was trading above key moving averages (EMA 6, 24, 72, 288)
✅ Broke above short-term trendline resistance, confirming upward momentum
3️⃣ Key Takeaways from This Trade
🔹 Trading with smart money & against retail sentiment = High probability setups
🔹 Seasonality provided extra confidence in taking the long trade
🔹 Using Fibonacci and EMAs for confluence led to a precise entry
🔹 Patience and risk management were key to securing profits
📌 Final Thoughts – What’s Next for GBP/USD?
🚀 With this bullish breakout, I will look for further longs on dips, targeting the next key resistance at 1.2680 - 1.2700.
👀 Are you bullish or bearish on GBP/USD? Let’s discuss in the comments!

NAS100 H4Rules:
If price break point 2,4, 6, 8 cancel the setup
Price needs to break point 1, 3, 5, or 7 to confirm the setup
When price reach the 100FE (blue box) it normally does a pullback/retest or reversal
The market can Truncate (fall short)

Supertrend Indicator: a simple yet powerful tool for trendsThe Supertrend Indicator is a widely used tool among traders to identify the prevailing trend and generate buy/sell signals based on market momentum. It works by calculating a dynamic support and resistance level using the Average True Range (ATR) to adjust for market volatility.
The indicator plots a line above or below the price, acting as a trailing stop-loss.
When the price crosses above the Supertrend line, it turns green, signaling a potential buy opportunity.
When the price crosses below the Supertrend line, it turns red, indicating a potential sell signal.
Why Use Supertrend?
- Easy to interpret for both beginner and experienced traders.
- The ATR-based calculation ensures that stop levels adjust dynamically.
- Whether you trade stocks, forex, or crypto, Supertrend can enhance your strategy.
Best Practices:
✔ Combine Supertrend with indicators like RSI or MACD for better confirmation.
✔ Adjust the ATR period and Multiplier to optimize it for different markets.
✔ Avoid false signals by using it in trending markets, as it may be less effective in sideways price action.

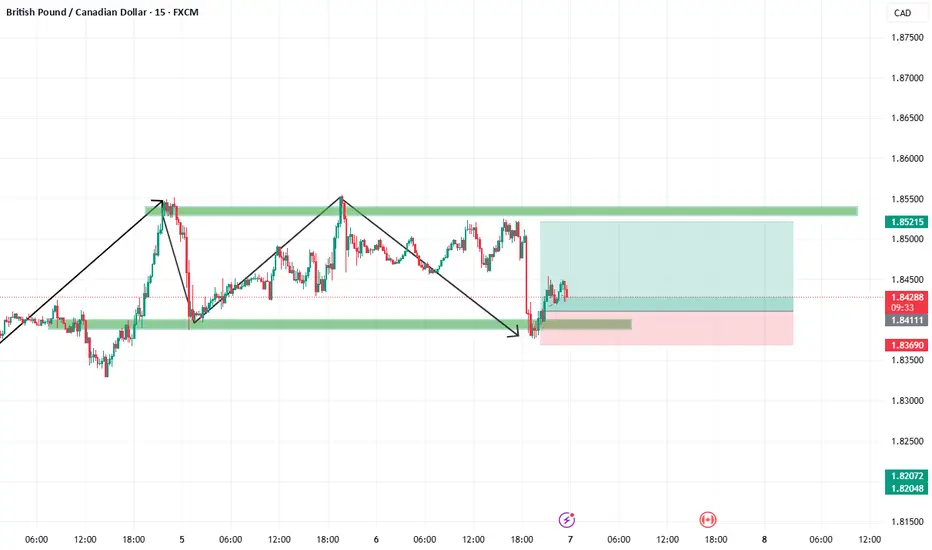
Understanding market structure: Trend reversals & price actionIn this chart, we can observe how price action follows a structured pattern of trends, reversals, and breakouts. The market moves in cycles, creating bearish and bullish trends that traders can capitalize on by identifying key areas of support and resistance.
At the beginning of the chart, we see a bearish trend, characterized by lower highs (LHs) and lower lows (LLs). This structure indicates that sellers are in control, pushing the price lower with each attempt to rise. The price remains within a descending channel, offering multiple sell opportunities at resistance levels. Traders following this trend can look for short entries at each lower high.
The first major shift occurs when the price breaks above resistance, marking a potential trend reversal. This breakout signals that buyers are stepping in, disrupting the bearish pattern. Once a previous resistance level turns into support, it confirms a shift from a downtrend to an uptrend.
In the next phase, we see the emergence of a bullish trend, where the price begins forming higher highs (HHs) and higher lows (HLs). This structure confirms that buyers are now in control, pushing the market upward. The price moves within a new ascending channel, and pullbacks to support provide buy opportunities for traders looking to ride the uptrend.
Finally, another major shift occurs when the price breaks below a key support level. This break signifies a possible trend change, where buyers lose control and sellers regain momentum. Traders need to watch for confirmation before entering new positions, as this could mark the start of another downtrend.

GBP/USD: Selling into the reboundThe setup is similar in EUR/USD & GBP/USD - because of the dollar in both major pairs!
The GBP price is testing the broken uptrend line on the weekly- and could break above it.
On the daily chart, a downtrend line has already broken and so has critical resistance at 1.25, suggesting a break above the weekly uptrend line
Should the breakout follow-through it faces resistance at 1.28 from the December high and 30 week (150 day) moving average.
However, should the breakout fail - it sets up a likely continuation of the longer term downtrend.
