Sharing a possible great way to follow trend!!I just had to say big thanks to @KivancOzbilgic as most if not all of these combined indicators are created and shared by his wizard.
I combined various indicators into one which for me helps me greatly to find a trend and stay on trend.
Trendtrading

GBPCHF new bullish expectations
OANDA:GBPCHF trend based analysis, we are have CHANNEL pattern which is be breaked, price is make strong bullish push, at end now we are on new trend.
Price is in zone, its bounce few times, CHF showing self with many the weakest, on some other pairs can see bullish confirmations, here expect same soon confirm and new bullish push.
SUP zone: 1.12500
RES zone: 1.13500, 1.14000

[Strategy] Trend Re-Entry Strategy using a Stoch and Zero Lag MATrend re-entries can be hard. The difficult part is knowing if price will continue to pull back or will it shift back into the original direction.
This is a strategy with some extra notes to help you understand
1. The Original entry
2. The Re-Entry
3. Is my trend ending
For this you'll need two indicators:
The Zero Lag Multi Timeframe Moving Average
and The Stocashi + Caffeine Crush
In the video I show you how to adjust the settings for a 5 minute chart on both indicators.
Long Entry rules:
You have 3 MAs. The longest one is your support and resistance
The other two are your "trading" and "trending" MAs
If price is above your support and resistance, your trading and trending should be right side up.
If price close in between trading and trending, the stocashi should be at a low point.
It needs to arrive at this low point by previous crossing down through its midline.
**If it did not cross down through its midline, there is no entry here**
Once price closes above the trading MA, you should have a rising stocashi from its valid low point.
During this uptrend, each time price pulls back in between the trading and trending MAs, the Stocashi should be at a valid low point.
Re-enter your long trade as long as:
Stocashi made a valid low
Price is closing above the trading MA
Trading MA is above Trending MA
Trending MA is above Support and Resistance MA.
You can reverse all of these instructions for taking short trades.
Potential Market Flip
If you are getting consistent invalid lows on Stocashi while price is in a correct position, this means you are losing your trend, and you should wait for your price to close below the Support and Resistance MA.
At this point your Trading and Trending MAs should be upside down. They do not always have to be BELOW the Support and Resistance MA.

CADCHF: Range BreakoutCADHCF has been in a range since August 2024. This range is quite wide at approximately 160~ pips.
Another observable detail is that the upper range boundary breached twice - once in November 2024 and then again last month, in January 2025.
Right now, in early-February, price is showing signs of breaching the upper range boundary again. Unlike the previous breakouts, this one seems more sustained.
Right now, the daily ATR is 41.4 pips. This sets my trading parameters at TP 20 and SL 41.

TRUMPUSDT Long – High Potential SetupI've allocated 20% of my balance to this trade, going long on TRUMPUS. The probability of a price surge up to $59 is high, considering the ongoing political cycle. With Trump remaining a key figure in U.S. politics, there will be continuous news catalysts driving market volatility.
Trade Setup:
Entry: Current price range
Target: $59 (295% potential gain)
Stop-loss: $5.4 (isolated position for risk control)
I see this as a low-risk, high-reward trade, leveraging strict risk management while capitalizing on market sentiment. 🚀📈

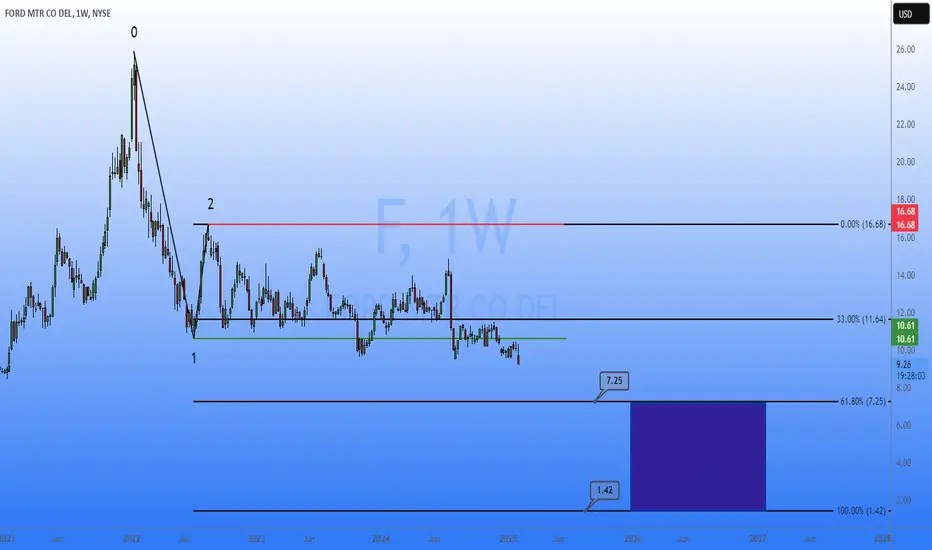
FORD WEEKLYRULES:
-If price break Point 2, 4, 6, or 8 cancel the setup
-Price needs to break Point 1, 3, 5, or 7 to confirm the setup
When price reach the 100FE(BLUE BOX) it normally does a pullback/retest or reversal
The market can Truncate(fall short)
PLR (Path of Least Resistance) Strategy Explanation - $SHOPHi guys this is a follow up to a post I have just published about my trading idea on shorting NYSE:SHOP ,
It really doesn't matter if you want to short the market or long the market as it works either way, but for the sake of the example I'll take a 6 months period from the Shopify chart following earnings to better explain you my strategy...
This right here is the NYSE:SHOP chart from approx. Jan/2024 to end of Aug/2024,
2 Earnings have been announced, both having great positive surprises, but regardless of the positive surprise (typically bullish indicator), the stock fell of 45%+.
Let's add the earnings dates to the chart so that you can better visualize them:
What you care about in this image is the earnings dates lined out, as you can see the surprise was positive yet both fell more than 10% in just a day, that I will take as the upcoming trend for at least the time being, till the next earning is announced (so, if for example the 13/Feb earning ended up being bearish, my overview on the market till at least the next earning on 8/May, will be bearish, so all of the trades I will take will be shorts).
Now I will line out the trend and the BoSs (breaks of structure) just to better visualize the trend:
As you can see the Earning date candles signed the beginning of a down trend twice, pre-announced by the Earning candle itself.
The entry strategy is now simple, the idea behind it is to "follow the path of least resistance".. by that I mean that, if your bias is bullish, who enter on candles that are of the opposite direction to the one you are heading to? - Sure you might say that it is to get better entries as ofc, on a short bias, higher sale points = better profits, but the goal here is not maximizing profits, but raising the odds exponentially so that you can take surer trades.
I've tested this strategy from Feb/2021 and so far the win rate is 95.6% (123 out of 136 trades profited .
The way the entries are spread is this:
Basically every time a bearish candle - that closes lower than the previous bearish candle did - is created, a short position of 1% of total equity is generated.
The period begins from the beginning of the current earnings season, and closes the day before the next earnings season as it works within a 3 months frame.
Each entry HAS to be the lowest bearish candle of the period, example:
Only these candles marked in blue count as entries for short positions as their close is lower of more than 0.5% than the previous one,
The pink ones are higher than the lowest up to that point, so they do not count as entries as they are technically part of a pullback that is moving in the opposite direction where you are heading.
So, going back to the entries, we enter on the close of the lowest bearish candle close up to that point.
For safety, we trail the stop loss to the previous high, this is where well defined trend lines come handy:
The thick black line is the trend line, and as new lows are broken, I mark those as BoS (break of structure) and until a new one is created, the SL will go to the previous high, and so it goes.
(viceversa for buys).
We then proceed to target the FVGs left behind by previous quarters:
As you can see there are massive gaps in the chart that we will target and identify as FVGs (Fair Value Gaps) and set the TP at the close (lowest point) of the fair value gap.
Now comes in your exit strategy...
There really are 3 ways that you can tackle this:
1- You set up TP to the lowest FVG of the series (if there are multiple like in this case)
2- You set up TP to the first FVG still open during the quarter following the Earnings Period
3- You tackle both TPs and take each FVG as a partial close to the position (example: if there are 2 FVGs you take out 50% of the position on the first and 50% on the last).
But what to do if your positions didn't reach TP (FVG close) before the next Earning or there is no FVG to begin with???
- In the case the TP you have marked out at the close of the FVG didn't reach, you'll proceed to close the position 1 day before the next Earnings is coming, unless your conviction that the FVG will fill in is so high, then you can let those run at your own risk:
- In the case in which a FVG is not present then you'll target the previous High (in case of a buy) or Low (in case of a sell) as your TP, utilize the previous low (in case of buy) or previous high (in case of sell) as SL and just let it run:
as you can see the 4 trades were all profitable, made little money but sure money in just 15 days
Unless I forget anything, this right here, is my strategy.
Simple, straight forward, high success rate and doesn't leave anything up to the case.
If you have any questions PLEASE leave a comment below and I'll do my best to reply in time ;)

$SHOP short idea (once again) - In advance of Earnings
Hi everyone,
I'm once again back to short NYSE:SHOP ..
It is not because I don't believe in the company, because I really do, but just like the first time,
I am targeting massive FVGs made by huge gaps in the chart as TPs, and utilizing an improved version of the first pattern of Earnings.
Just to summarise it so that everyone can understand it without having to go back to the first published idea, I've noticed how the Shopify stock tends to follow a certain pattern of buys and sells regardless of the results of Earnings.. now, I don't know if this is caused by buy backs or internal company stock operations or some other cause, but I've simply seen how it tends to alternate between buy and sell, and when, for example, for 2 earnings in a row a buy happens (the stocks trends up) then it is followed by an equal amount of sells (so 2 down trends).
Now.... could this just be odds and for the last 4 years this was just randomized and ended up doing exactly this? Idk maybe, but I'm not a genius in a lamp, so I'm speculating.
All I know is that:
- there are 2 massive gaps in the chart, worse than the last time,
- price is currently struggling to head higher (perhaps just waiting for Earnings to choose direction),
- we have just terminated one of those double down events where 2 selling earnings happened and right after 2 buy earnings happened,
Now... there are 2 ways to approach this, and these are the following:
1- The first method is to try and "predict" the top of the market by selling 3 days before of earnings just like the first time and hope for the down trend call to be true;
(something like this )
2- Actually wait till earnings day comes and wait for the 1d candle of the earnings day itself to close and tell if it was either a bullish or a bearish one and from the next day, start either buying or selling depending on the trend.
(something like this )
If you choose the latter, then you don't really have to worry about "predicting" the market and all you got to do is develop a entry strategy, you could either buy the dip/sell the top (depending on the trend of the earnings' candle) so that you can get the lowest entries, or you could just enter on each candle that moves the direction of the trend you are following (so for example if the trend is bullish, enter only on bullish candles close to follow your bias).
I'll post a follow up of the last entry option as I have developed a entry strategy to do just that, with the help of my friend @D499 who condensed it into an indicator (as I can't code).
I'll post comments to this post so that I can keep up with how things proceed and perhaps if the second scenario takes place I'll Live follow up so that all of you can see the idea.
Reminder, it's just an idea ;)

STOXX50: Bullish Momentum in Play - Is 5,345 the Next Target?PEPPERSTONE:EUSTX50 remains within a well-defined ascending channel, with price currently bouncing off a key support area. This suggests a continuation of the broader uptrend, targeting the upper channel boundary.
A short-term pullback could offer a potential entry opportunity. If buyers step in and confirm strength through candlestick patterns like bullish engulfing or hammer formations, momentum could drive price higher toward the 5,345 level.
A breakdown below the channel's lower boundary, however, would invalidate the bullish outlook and signal a potential shift in market direction.

#BILLYUSDT expecting further decline!📉 SHORT BYBIT:BILLYUSDT.P from $0.00367
🛡 Stop Loss: $0.00390
⏱ 1H Timeframe
📍 Overview:
➡️ BYBIT:BILLYUSDT.P continues to trend downward, forming new local lows. After retesting the $0.00387 zone, the price failed to hold and dropped again, confirming seller dominance.
➡️ POC (Point of Control) at $0.00475 shows the highest liquidity area, positioned above the current price. This confirms a bearish market sentiment, as major trading activity is still concentrated at higher levels.
➡️ A breakdown of support at $0.00367 strengthens the downtrend, opening the way toward $0.00336, where buyers previously showed interest.
➡️ If the price holds below $0.00367 , further downside movement is likely, with increasing sell pressure.
⚡ Plan:
➡️ Enter short after confirming a breakdown below $0.00367 , signaling further downside.
➡️ Risk management through Stop-Loss at $0.00390 , placed above the nearest resistance zone.
➡️ Primary downside target – $0.00336, where buyers may step in.
🎯 TP Targets:
💎 TP 1: $0.00336
🚀 BYBIT:BILLYUSDT.P remains weak — expecting further decline!
📢 BYBIT:BILLYUSDT.P remains in a strong downtrend with no signs of buyer recovery. If the $0.00367 level is broken with increasing volume, the decline may accelerate.
📢It's crucial to watch the reaction at $0.00336—if significant buying interest appears, a short-term bounce is possible.
📢However, in the long term, there are no clear reversal signals yet, and long positions should be approached with caution.

WMT Showing Bullish Momentum – Move Toward $99.00 ExpectedNYSE:WMT is demonstrating strong bullish momentum, driven by consistent price strength and support from key moving averages. The recent price action confirms buyers' dominance, with a clear uptrend evident on the chart. The stock has advanced steadily, breaking out of prior consolidation zones, and is now poised to target the $99.00 level, which serves as the next significant milestone.
This setup aligns with the expectation of a bullish continuation, offering a potential long opportunity if pullbacks or consolidations occur near current levels.
If you agree with this analysis or have additional insights, feel free to share your thoughts here!

Gold is looking for $3000 All time HIGH Gold has sparked and reached all time-high and became a haven commodity again. It is still holding a very strong Bullish momentum which means more high records coming up soon.
After XAUUSD rejected 2,775 level, it went all the way to break a very strong level which is the monthly level of 2,842 and maintained there for a short time before launching again reaching a new high 2,872.
What i am seeing is that Gold will retrace to monthly level 2,842 and get more momentum and then expolde to reach the $3000 level.

GOLD Maintains Bullish Momentum, Targeting $2,840OANDA:XAUUSD has recently broken out above a key resistance zone and successfully retested it as new support, subsequently rebounding and maintaining its position within the ascending channel. This solidifies the bullish structure, with buyers stepping in at the newly reclaimed support.
The next potential upside target is around $2,840, in line with the upper boundary of the channel. However, short-term pullbacks within the structure remain probable, particularly near mid-channel levels.
As long as Gold holds above the support zone, the bullish momentum remains intact. A break below this support would invalidate the current setup and shift focus back to lower support levels.
This is not financial advice but rather how I approach support/resistance zones. Remember, always wait for confirmation, like a rejection candle or volume spike before jumping in.
Please boost this post, every like and comment drives me to bring you more ideas! I’d love to hear your perspective in the comments.
Best of luck , TrendDiva

GOLD 12H CHART ROUTE MAP ANALYSISHello Traders,
Here’s our 12H chart analysis and target updates:
📌 Previous Chart Review
Key Resistance: Identified 2,790 as a critical resistance level, anticipating a potential reversal.
Buy Signal: Recommended waiting for EMA5 to cross and hold above TP1 (2,745) as confirmation for a bullish move toward TP2 (2,786) & TP3 (2,826).
Dynamic Support: Highlighted the FVG zone (2,745) as a key support area.
📊 Outcome
✅ All targets and entry levels (marked with Golden Circles) were achieved as predicted.
✅ EMA5 crossed above TP1 (2,744), leading to TP2 (2,786) being achieved.
✅ Resistance at 2,790 was broken.
❌ TP3 was nearly reached but reversed after EMA5 failed to cross and hold above TP2 (2,786).
🔍 What’s Next for GOLD?
The daily candle closed above TP2 (2,786), but EMA5 failed to sustain above it.
This suggests a potential short-term reversal.
📉 Key Levels
📌 Support: Strong support expected from the FVG zone and Gold Turn Levels (2,770, 2,745 & 2705).
⚠️ Downside Risks
If EMA5 crosses and holds below 2,770, the next target shifts to 2,745.
If EMA5 crosses and holds below 2,745, the downside extends toward 2,705 (Retracement Range).
📈 Bullish Path
A bounce from support could retest TP2 (2,786) and potentially extend toward TP3 (2,826).
📌 Trading Recommendations
🔹 Short-Term Trades:
Utilize 1H and 4H timeframes to capitalize on dips at Gold Turn Levels, targeting 30–40 pips per trade.
Focus on shorter positions in this range-bound market to navigate volatility.
🔹 Long-Term Bias:
We remain bullish and view pullbacks as buying opportunities.
Buying dips from our marked levels provides better risk management rather than chasing tops.
📢 Final Note
Trade with confidence and discipline—our precise analysis ensures you’re well-equipped to navigate the market. Stay tuned for daily updates and multi-timeframe insights.
Best regards,
📉💰 The Quantum Trading Mastery

USDCHF → The bullish trend may get its continuationFX:USDCHF is entering the realization phase after a prolonged correction. A favorable background is created by the uptrend and rising dollar...
The technical outlook on the daily timeframe is very good. The price after breaking the trend resistance tested the previously broken line. The currency pair after the false breakout managed to consolidate above the key point, marking an interim bottom and further prospects.
Technically, the focus is on the resistance at 0.911, if the bulls can overcome this area and consolidate above this level, the currency pair will be able to realize a rise to 0.918 - 0.93.
Resistance levels: 0.911
Support levels: 0.90555
Before breaking the resistance, the currency pair could test 0.90555 due to the liquidity generated below this area. But, the trigger that can provoke further growth is 0.911
Regards R. Linda!

GBPUSD → What are the chances of a fall after a FB?FX:GBPUSD is testing the resistance of the downtrend, but the price does not have the strength to go beyond this range. Ahead of the news that can strengthen the downward movement....
On D1, the price is also forming a false breakdown, but relatively important level, thus confirming that the price is still in the selling zone. Ahead is the Fed rate meeting, where the interest rate is likely to remain at the same level. But the most important thing will be Powell's speech. If the official's tone is hawkish, which is the most likely scenario at the moment, the dollar will get support, which may negatively affect the GBP.
Technically, the strongest moves occur after false breakouts.
Resistance levels: 1.24887
Support levels: 1.2414, 2.2377
A retest of the trend resistance ends with a false breakout and consolidation of prices below the line... A break of the support at 1.2414 will trigger further selling. If there is no unexpected news, the currency pair may fall to 1.224
Regards R. Linda!

“XRP/USD - Adding a Second Position to Ride the Wave”4H Bias Holds Strong - 5M Entry Refinement
In continuation of my initial position on XRP/USD, I’ve added a second entry to compound on the 4H bullish bias move.
Key Observations:
1. 4H Structure: The price respected the order block within the IDM zone, confirming bullish intent.
2. Refined Entry: Top screenOn the 5M timeframe, after a sweep of SSL and a clear CHoCH, price retested the order block. I entered on the bullish reaction with TP levels set at 3.3974.
3. Bigger Picture (2H for Clarity): The engineered liquidity was swept cleanly, and momentum aligns with the continuation plan toward higher levels.
Both positions are running in sync, aiming for the same take-profit zone. I’ll monitor how price action develops overnight for potential adjustments or further refinement.
Let me know your thoughts—are you tracking XRP/USD, or are you focused on other pairs this week? Drop a comment below!
Bless Trading!


NVDA Long After Nearly 20% DeclineNASDAQ:NVDA got hit hard by the huge sell-off today and because of the DeepSeek release. The Chinese GPT alternative claims to be better or at least as good as GPT using way less and way older NVDA GPUs. If true, this could create a lot of stress on the CapEx of big US tech companies because the managers will ask their employees why they needed to buy all of those expensive GPUs if they are not necessary at all. That would lead to shrinking sales at NVDA. So far, so bad.
But, we should not forget that misinformation is always a thing when talking about Chinese companies and claims. I also don't think that the result of such a claim would be that tech companies lower their CapEx and start doing less. Instead they will use this to understand how DeepSeek works and how they can be better than their Chinese counterpart using way more powerful GPUs. So, this huge sell-off could trigger a bounce from this confluence support. We perfectly hit the upward trend and a support level at $118. So, be brave and test the water.
Target Zones
$131
$140
Support Zones
$118

BUY AMD!!!!Approaching a significant level where we can expect AMD to complete this bearish cycle and begin a bullish cycle. Partial Profits at All-Time-Highs.

AUDCAD after long time, can we see bullishness
OANDA:AUDCAD long period of bearishness, personally having long position from Jul. last year i am have already shared one idea on AUDCAD which is still actual and will attach her.
What here now we have is long DESCENDING CHANNEL, currently its breaked and we have some bounces on sup zones.
Technically picture is strong bullish. Here after long time of bearishness, having strong bullish expectations to start.
TO KNOW: We are have and upper DESCENDING CHANNEL(white lines), which is be breaked and price is start falling, currently if we see now bullish push, price is expected to come in "UPPER CHANNEL" if that happens, will share and new idea and will be same with bullish expectations.
SUP zone: 0.88900
RES zone: 0.90400, 0.90700, 0.91000

Bitcoin at the END of January? BEARISH TREND #BTC 1-26-25What to Expect from Bitcoin at END of January? As of today all crypto market started BEARISH Reversal Trend. All positive crypto news did not help crypto move more bullish, it means all crypto turned to Bearish Trend.
#BTCUSD #BCHUSD #ETHUSD #ETCUSD #ADAUSD #TONUSD #SOLUSD
Please subscribe and like this review video.
Thank you so much and Good Luck!

SHIB1000USDT: Reversal or Breakdown?
📉 BYBIT:SHIB1000USDT.P is currently trading at a critical support zone around 0.019900 USDT . After multiple tests of this level, buyers are stepping in, but is it enough to trigger a rally?
---
🔑 Key Levels:
Support:
0.018347 USDT — the last support level, a breakdown here could lead to further downside.
0.019825 USDT — current liquidity accumulation area.
Resistance:
0.022000 USDT — the first target in case of a bounce.
0.026403 USDT — a liquidity zone that could act as a magnet if the price breaks through local resistances.
---
🚩 Trading Strategy:
Entry Point:
- Consider a long position if 0.019825 USDT holds with increasing volume.
Stop-Loss:
- Below 0.018347 USDT to minimize risks in case of a breakdown.
Take-Profit Targets:
0.022000 USDT — first target for partial profit-taking.
0.026403 USDT — potential target if a bullish impulse kicks in.
---
📈 Technical Analysis:
The price is testing a support level with repeated buyer reactions.
A breakout could trigger a recovery phase with potential movement towards 0.026403 USDT.
If the support fails, a drop to 0.018347 USDT is likely.
---
💡 Conclusion:
The price is at a crossroads: a bounce could yield great profits, but a breakdown could spell trouble. Stay alert! What’s your take? Waiting for a retest or already in? Let’s discuss in the comments! 🚀
