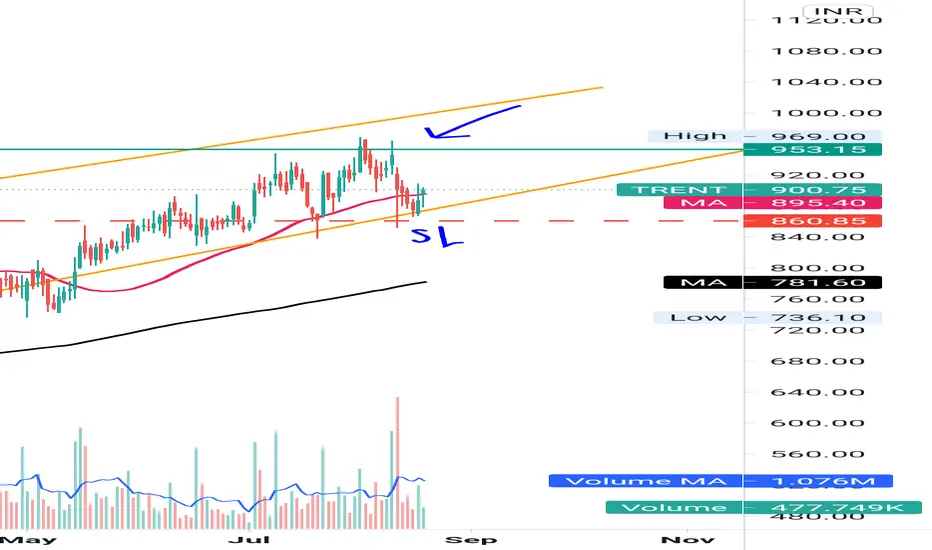
Bear flag con TrentTrent has formed a bear flag, breakdown likely no Monday.
Daily MACD about too cross bearish plus RSI below 50
shoot for a target of 970
Trent

TRENT BreakoutThe stock has broken out and retested, therefore may undergo a reversal rally. Trade is supported by Supports Nearby.
Risk Reward Ratio - 2:1
SL is placed below the support zone & the lower trendline. The target is placed near resistance.

DeGRAM | EURGBP descending channelEURGBP is moving in a descending channel. The price has reached the resistance level and the upper limit of the channel, a rebound and a downward movement is expected.
-------------------
Share your opinion in the comments and support the idea with Like.
Thanks for your support!

DeGRAM | EURUSD reached the resistance EURUSD has reached the resistance level and has already started a rebound. A downward movement to the 1.07 support level is still expected.
-------------------
Share your opinion in the comments and support the idea with Like.
Thanks for your support!

DeGRAM | XAUUSD support levelGOLD is heading towards the support level after rebounding from the resistance level. the downward movement is expected.
-------------------
Share your opinion in the comments and support the idea with Like.
Thanks for your support!

DeGRAM | EURUSD still fallingEURUSD is still falling, having reached the support level. The continuation of the downward fall in the descending channel is expected.
-------------------
Share your opinion in the comments and support the idea with Like.
Thanks for your support!

DeGRAM | GBPUSD range breaking GBPUSD has broken through the descending channel and now the price has again approached the decisive retest of the channel boundary, from which an upward rebound is expected.
-------------------
Share your opinion in the comments and support the idea with Like.
Thanks for your support!

DeGRAM | AUDCAD lower limitAUDCAD after breaking through the ascending channel, moved to the descending one. The price has reached the lower limit of the channel and a strong support level from which an upward correction to resistance is possible.
-------------------
Share your opinion in the comments and support the idea with Like.
Thanks for your support!


Trent - Buying Opportunity!Buying Opportunity in Trent
Q2 & Q3 net profit published and an interim dividend announced - looking Strong on chart as well!
BUY if sustains above 1210.

Trent 3 to 4 monthschart is forming cup and handle once it retest the zone you can enter and hold till 3 to 4 months you will get 200 points. like if u agree


TrentTrent cup and holder patern we can expect a long. This is only for study purpose do your own analysis before trade.

Trent Reversal TradeThe stock has reached lower trendline and may undergo a reversal rally. Trade is supported by brokerage calls and Supports Nearby.
Risk Reward Ratio - 2:1
SL is placed below support zone & the lower trendline. The target is placed near resistance.


Long TrentStock following trend line beautifully....
Important levels marked on the chat.
NSE:TRENT
Education purpose only.

Long Trent above 905 for 950+Important levels marked on the chart.
This is my personal view and not reco.
Education purpose only.
Trent looking bullishTrent Ltd. stock has given trendline breakout with good volumes which can also be seen as a flag pole pattern. Also, The stock has given a very good weekly closing.
The stock can be a good buy for intraday above 910.
Also, one can expect nearly 10% targets in a swing trade if the ATH levels are crossed.
This is just for educational purpose.

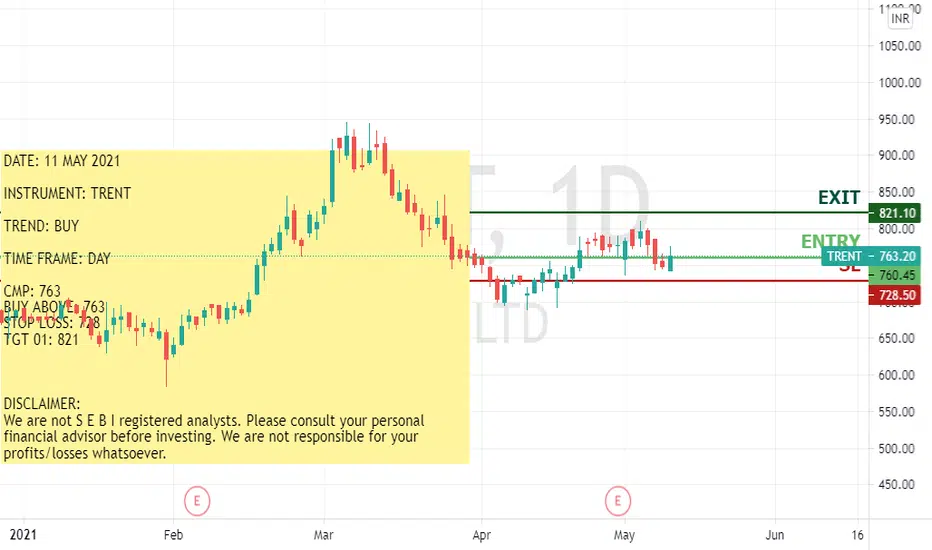
TRENT ::: LONGDATE: 11 MAY 2021
INSTRUMENT: TRENT
TREND: BUY
TIME FRAME: DAY
CMP: 763
BUY ABOVE: 763
STOP LOSS: 728
TGT 01: 821
DISCLAIMER:
We are not S E B I registered analysts. Please consult your personal financial advisor before investing. We are not responsible for your profits/losses whatsoever.
BTC Idee 4HDie gevaarlikste gebied vir my is 42k. Moenie vergeet om tred te hou met die volumes nie.

RSI Bullish Divergence in NSE: TRENT 1D Chart In TRENT, there was a down-trend. Now, down-trend is over and a new trend is getting established.
There is RSI Bullish Divergence in 1D Chart. Stock may come down a bit in short team (like next 1 week).
Overall, if the new trend establishes itself, stock may go up in mid-term.

TRENT BUY AT 750. TARGET 825. SL 690. HOLD FOR 3 MONTHS# The sharp trended decline in TRENT seems to have completed, as the stock price has bounced up from the lower support of 700 levels in this week.
# We observe a formation of bullish hammer type weekly candle pattern in last week and upside bounce in this week which signal bottom reversal in the stock price around
700.
# We also observe a larger degree positive sequence like higher tops and bottoms over the last few months. The recent swing low of 689-12th April could be considered as a
new higher bottom of the sequence.
# Weekly 14 period RSI shows positive indication. Hence, one may expect further strengthening of upside momentum in the stock price ahead.
# The overall chart pattern of TRENT indicate long trading opportunity. One may look to create a positional long as per the levels mentioned above.

