"GBP/USD is cooking inside a trianglePair: GBP/USD
Timeframe: 4H
Strategy: Elliott Wave + Triangle Pattern + Breakout
Formation: Contracting Triangle – Wave 1 to 5
Risk-Reward: High Probability Setup
Status: Pre-breakout phase
🔍 Technical Breakdown:
A clean contracting triangle is forming, completing all 5 internal waves within the structure.
Wave 5 looks exhausted and price is rejecting trendline resistance.
Expecting a bearish breakout from the triangle.
Target zone = 1.34759, aligning with previous liquidity + measured move.
Entry area refined with supply zone + minor structure break (as seen in inset schematic).
🎯 Target: 1.34759
🛑 Stop Loss: Above triangle resistance
🟢 Entry Trigger: After breakout + retest or SMC confirmation
This setup matches Elliott Wave’s triangle structure behavior – typically occurring before the final push in a larger correction or continuation.
Triangle

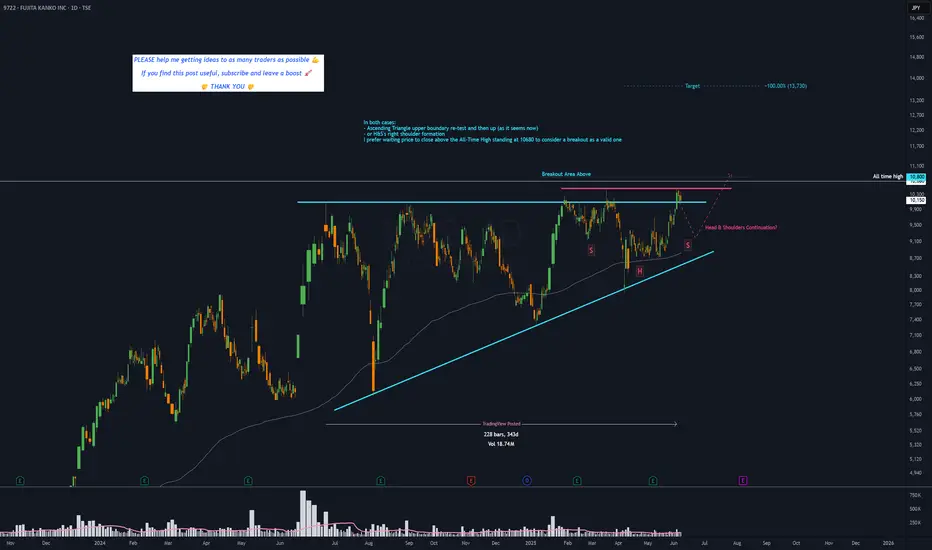
9722 - 11 months ASCENDING TRIANGLE══════════════════════════════
Since 2014, my markets approach is to spot
trading opportunities based solely on the
development of
CLASSICAL CHART PATTERNS
🤝Let’s learn and grow together 🤝
══════════════════════════════
Hello Traders ✌
After a careful consideration I came to the conclusion that:
- it is crucial to be quick in alerting you with all the opportunities I spot and often I don't post a good pattern because I don't have the opportunity to write down a proper didactical comment;
- since my parameters to identify a Classical Pattern and its scenario are very well defined, many of my comments were and would be redundant;
- the information that I think is important is very simple and can easily be understood just by looking at charts;
For these reasons and hoping to give you a better help, I decided to write comments only when something very specific or interesting shows up, otherwise all the information is shown on the chart.
Thank you all for your support
🔎🔎🔎 ALWAYS REMEMBER
"A pattern IS NOT a Pattern until the breakout is completed. Before that moment it is just a bunch of colorful candlesticks on a chart of your watchlist"
═════════════════════════════
⚠ DISCLAIMER ⚠
Breakout Area, Target, Levels, each line drawn on this chart and any other content represent just The Art Of Charting’s personal opinion and it is posted purely for educational purposes. Therefore it must not be taken as a direct or indirect investing recommendations or advices. Entry Point, Initial Stop Loss and Targets depend on your personal and unique Trading Plan Tactics and Money Management rules, Any action taken upon these information is at your own risk.
═════════════════════════════
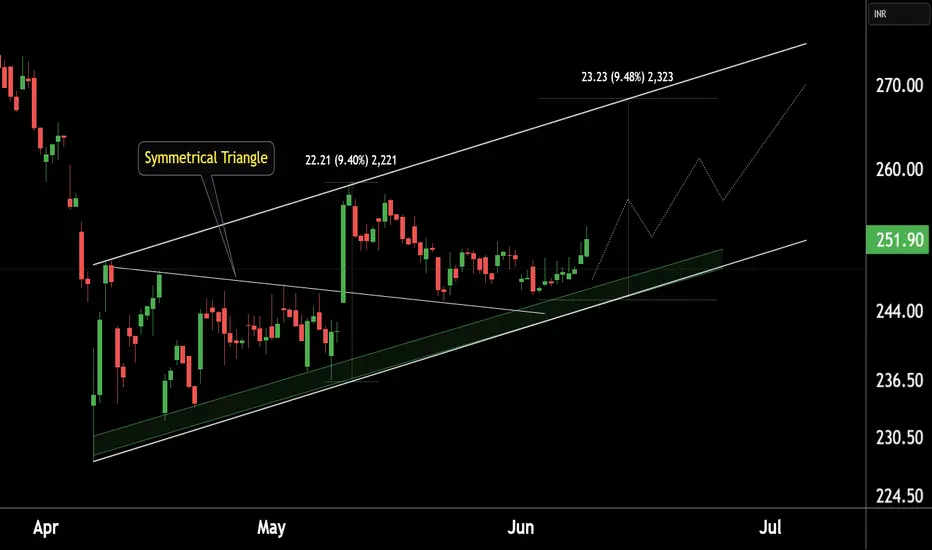
WIPRO at Best Support !!This is the 4 hour chart of Wipro ltd.
WIPRO has a strong support zone in the 245–248 range.
WIPRO is forming a symmetrical triangle pattern, with a potential target of 268, which also aligns with the channel's resistance zone at 268-270."
If this level is sustain , we may see higher prices in Wipro !!
Thank You
GBPJPY eyes breakout with 450 pip potentialGBPJPY is testing key resistance at 196.43 in an ascending triangle. A breakout could trigger a 450+ pip move. EURJPY and Dow Jones show similar setups, adding confluence.
This content is not directed to residents of the EU or UK. Any opinions, news, research, analyses, prices or other information contained on this website is provided as general market commentary and does not constitute investment advice. ThinkMarkets will not accept liability for any loss or damage including, without limitation, to any loss of profit which may arise directly or indirectly from use of or reliance on such information.

GOLD LONG🔥 XAUUSD TRADING PLAN – 4H/15M Confluence-Based Setup (as of June 9, 2025)
🧠 Bias: STRONGLY BULLISH (while above $3,290)
🔍 TRADE OVERVIEW
Item
Detail
Pair
XAUUSD (Gold)
Timeframes
4H (macro bias), 15M (entry precision)
Entry Style
Scale-in with confirmation from lower TF
Risk Type
Aggressive with tight SL
Target
$3,500 (ATH)
Stop Loss
Initial SL: $3,288 (tight), invalidation SL: $3,280
RR Ratio
1:4+ minimum
✅ ENTRY ZONES (with reasons and confluences):
🔹 Zone 1: $3,294 – $3,308 (LIVE price area)
🔁 Type: Immediate entry on confirmation (15M bullish structure)
📌 Reasons:
✅ 4H Key Support from previous horizontal base.
✅ 38.2% Fibonacci Retracement of major bullish leg.
✅ Demand Zone tapped twice on 4H and 15M.
✅ Bullish Rejection Candles forming in both TFs.
✅ Break and Retest of descending wedge/channel on 15M.
✅ Touch of ascending trendline on 4H — trend still active.
🎯 Entry: Execute small size position now around $3,298–$3,306
📍 SL: $3,288 (below trendline wick trap + structure)
📍 TP1: $3,336
📍 TP2: $3,375
📍 TP3: $3,420
📍 TP4: $3,500
🔹 Zone 2: $3,266 – $3,280 (Deeper pullback entry)
🔁 Type: Scale-in/add-on (limit order)
📌 Reasons:
✅ 50%–61.8% Fibonacci Zone (mean reversion level).
✅ 4H Trendline Deviation Trap Zone (fake-out potential).
✅ Liquidity Sweep Zone below current support = classic entry trap.
✅ Reversal candlesticks expected on 15M here if tested.
🎯 Entry: Set limit orders at $3,274 ±3
📍 SL: $3,258
📍 TP: Same levels — ride toward ATH with scaling logic
🧱 TRADE MANAGEMENT – SCALING STRATEGY
Position
Entry Zone
SL
Risk %
TP1
TP2
TP3
TP4
Entry #1
$3,298–$3,306
$3,288
0.5%
$3,336
$3,375
$3,420
$3,500
Entry #2
$3,266–$3,274
$3,258
0.75%
$3,336
$3,375
$3,420
$3,500
Entry #3 (Optional Pullback Buy)
$3,230
$3,218
0.5%
$3,294
$3,336
$3,420
$3,500
💡 Total Risk: ~1.75% with staggered entries
📈 Scaling Out: Partial profit on each target, trailing SL above structure post TP2
🔁 LIVE MONITORING SIGNALS
If you see this...
Then do this...
Bullish engulfing on 15M in Zone 1
Enter with tight SL
Breakout above $3,320
Move SL to BE
Retest of $3,294 with strong rejection
Re-enter/add-on
Clean break down below $3,280
Close position; wait for $3,230
📉 INVALIDATION CONDITIONS
Clean 4H close below $3,280 AND break of trendline support
Break of 61.8% zone ($3,266) without reversal pattern
Sudden fundamental shock (e.g. CPI/NFP ruining trend)
🏁 FINAL TARGET PATH
✅ $3,336 – intraday resistance
✅ $3,375 – minor swing high
🔜 $3,420 – clean breakout zone
🏁 $3,500 ATH – Final TP target, psychological + technical milestone

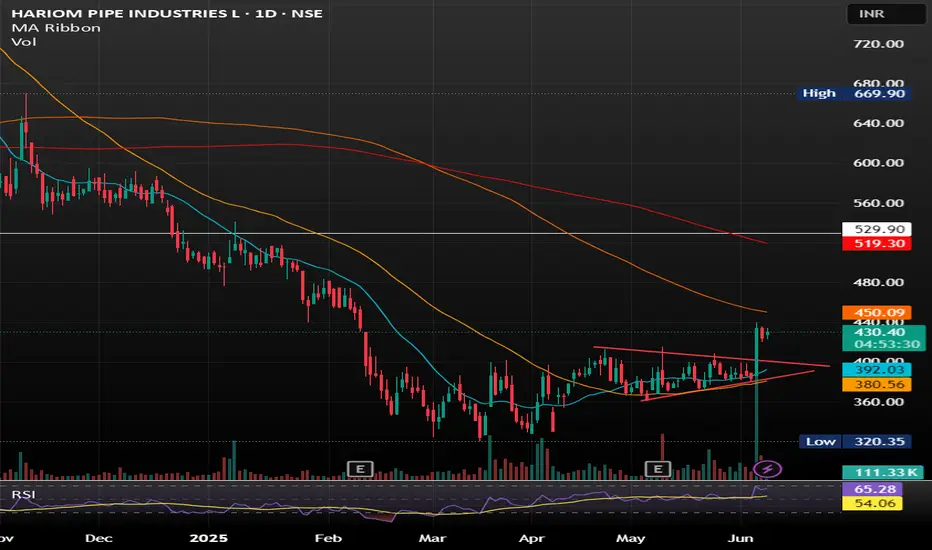
Hariom Pipes Industries Ltd Hariom Pipes Industries Ltd is a leading manufacturer of high-quality steel products, including HR Pipes, GI Pipes, GP Pipes, MS Pipes, HR Coils, and Billets. The company was established in 2007 and has grown into a major player in the iron and steel industry in India.
SYMETRIC TRIANGLE BREAKOUT WITH GOOD VOLUME SHOWING GOOD UPWARD MOMENTUM .
BUY IN ANY PULLBACK SUGGESTS.
BTC: Decision Time Ahead! A Quick Update!!Hey Traders!
If you’re finding value in this analysis, smash that 👍 and hit Follow for high-accuracy trade setups that actually deliver!
Bitcoin is once again testing the descending trendline resistance on the 4H chart.
We're currently at a make-or-break level:
A clear breakout above the trendline could trigger a bullish move toward $110K+
A rejection here might push BTC back to the $100K–$98K support zone
📍The green zone remains key — last time, it held as strong support.
But without a breakout above $106.5K, bulls are on the defensive.
Watch price action closely here — the next big move could start from this very point.
What’s your take? Bullish breakout or another dump loading?

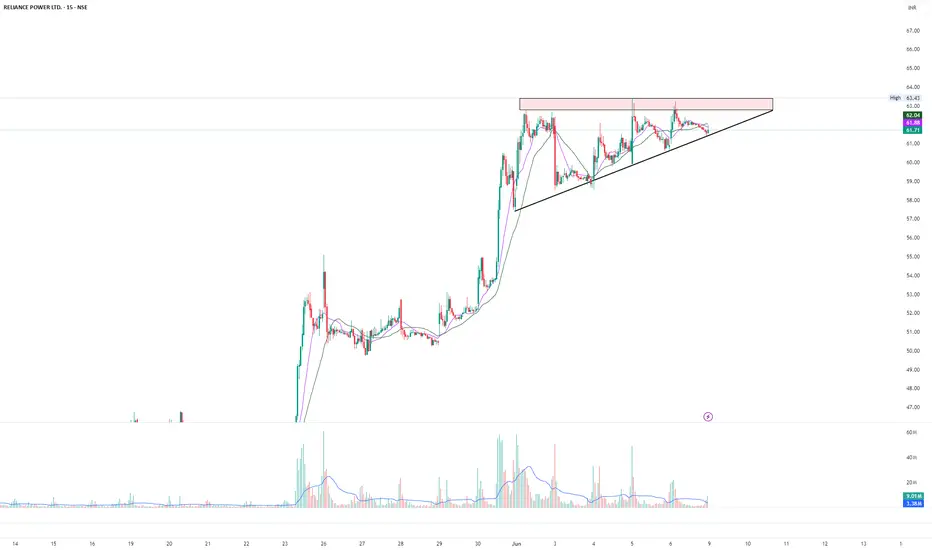
Ascending triangle in RPOWEROn short term chart, Rpower has created ascending triangle. This is after stock has moved up with a higher relative volume. This triangle suggests consolidation of upmove and further movement is highly probable.
As you can see, volume on up bars is huge as compared to down bars. This suggests higher interest in stock.
Breakout of 63.43 can give further upside.
Gold will make impulse up from support line of triangle to 3430Hello traders, I want share with you my opinion about Gold. Some days ago, price entered to triangle, where it made an upward impulse at once to the resistance line, breaking the resistance level. But then price turned around and in a short time declined back, breaking the resistance level one more time. Next, Gold continued to fall and reached the support line of the triangle. After this, it made an impulse up again and exited from the triangle pattern with broke the 3280 level. Price rose to the resistance level and then started to trade inside another triangle pattern. In this pattern, Gold dropped from the 3430 resistance level, which coincided with the resistance line, and dropped to the support line, breaking the 3280 level. After this movement, Gold turned around and started to grow, and later reached the 3280 level and broke it again. Then the price continued to grow and reached the resistance line of the triangle pattern, where at the moment continues to trades near. In my opinion, Gold can rebound from the support line of the triangle and rise to the resistance level, exiting from triangle pattern. For this case, my TP is 3430 level. Please share this idea with your friends and click Boost 🚀
Disclaimer: As part of ThinkMarkets’ Influencer Program, I am sponsored to share and publish their charts in my analysis.

SHREE DIGVIJAY CEMENET AT LONG TERM SUPPORT ZONEThis is the Weekly chart of SHREDIGCEM.
SHREDIGCEM is trading near it's long term support zone at 60-70 range.
stock has been moving within a long-term parallel channel, with a well-established support zone in the range of ₹65–₹70.
Currently, the stock is forming a broadening pattern near its support zone, with the pattern support range between ₹70–₹75.
If this level is sustain then,we may see higher prices in SHREDIGCEM.

Euro will correct a little and then continue to move up nextHello traders, I want share with you my opinion about Euro. Observing this chart, we can see how the price entered to upward channel, where it at once dropped from the resistance line to the support line and then started to grow. In a short time price rose to the 1.1210 level, broke it, and even rose a little more, but soon turned around and declined to the support line of the channel. Then the Euro made an upward impulse, and then broke the 1.1210 level one more time and continued to grow inside the channel. Later price reached the resistance line of the channel and then corrected, after which, in a short time rose to the support area, breaking the 1.1400 level. But soon the price turned around and dropped to the 1.1210 level, thereby exiting from channel. Next, Euro continued to grow inside the wedge, where it rose to the current support level and soon broke it. After this, the price rose to the resistance line of the wedge and then corrected, after which it made an upward impulse. Price exited from the wedge, and now I think that the Euro can make a correction, after the rise, and then continue to grow next. That's why I set my TP at 1.1560 points. Please share this idea with your friends and click Boost 🚀
Disclaimer: As part of ThinkMarkets’ Influencer Program, I am sponsored to share and publish their charts in my analysis.

DONEAR AT SUPPORT ZONE.This is the Weekly chart of DONEAR.
Donear is currently trading near its support zone in the ₹95–₹100 range.
The stock is trading within a larger pattern structure (broadening pattern) and is currently moving inside a smaller formation—an ascending channel (in DAILY timeframe) support at 103-105 range.
if this level is sustain ,then we may see higher price on ascending channel resistance at 130-135 range and long term resistance of the broadening pattern .........
Thank you !!!!

Could AAPL Breakout Soon...Symmetrical Triangle Setup...Pre-WWDCAAPL is forming a symmetrical triangle on the 4H chart, setting up for a potential breakout. This neutral pattern, with converging trendlines, signals consolidation before a big move. The upper trendline (resistance) is near $207, and the lower trendline (support) is around $200, with the current price at $205. RSI is neutral at 50, and volume is decreasing—classic signs of an imminent breakout.
Fundamental Catalyst: WWDC next week could be a game-changer, with potential AI updates (think “Apple Intelligence” enhancements). Positive news could fuel a bullish breakout, while a “sell the news” reaction might trigger a downside move.

GOLD → Intra-range strategy. Waiting for NFPFX:XAUUSD remains consolidated in the 3340-3391 range. The price is stuck in the middle of the range due to the uncertainty created by upcoming unemployment news...
On Friday, gold rose slightly, remaining within the range ahead of important US employment data (NFP), which could set the direction for the market. Optimism over the US-China deal and profit-taking on the dollar are supporting the USD, holding back gold's rise. A weak NFP (less than 100,000) will reinforce expectations of a Fed rate cut and support gold. A strong report (above 200,000) will have the opposite effect. The probability of a rate cut in September is 54%.
Technically, on the daily timeframe, the market structure is bullish. After a sharp breakout of resistance and a new high, the price is consolidating above the upward trend line, forming a plateau in the 3300-3340 zone. Another shakeout from support is possible before the trend resumes
Resistance levels: 3375, 3391, 3414
Support levels: 3339, 3331
Forming a price forecast ahead of news, especially ahead of NFP, is a thankless task. Therefore, it is advisable to wait for the news and monitor the price reaction. A retest of the consolidation boundary and a rebound are possible. There is a chance that the price will remain in consolidation until next week, but again, it all depends on the fundamental background...
Best regards, R. Linda!

Intel poised for a breakoutIntel NASDAQ:INTC is quite possibly poised for a breakout, as we look at a triangle formation here on the 3W chart, roughly ten months in the making, beside consolidating momentum. Longer term timeframes are good for determining the main trend in a stock's price.
On the short term 4H timeframe, better suited for trade entry and exit signals, an inverted head & shoulders pattern has formed both in price and momentum.
Fundamentally, Intel shares are arguably cheap, with a discount to Net Asset Value that began in 3Q 2024. A stock trading at a discount to net asset value is selling for less than the per‐share value of its assets minus liabilities.

CHFJPY - BULLISH MOVE !Hello Traders !
The CHFJPY price formed a descending triangle pattern.
At the moment, The resistance line is broken !
So, I expect a bullish move🚀
________________
TARGET: 176.145🎯

Crude Oil (WTI) Daily Chart AnalysisCrude Oil (WTI) Daily Chart Analysis
Pattern Formed:
A Symmetrical Triangle formation is clearly visible.
Context:
The prior trend leading into the triangle was bearish.
Typically, in technical analysis, a triangle after a downtrend is considered a continuation pattern — meaning there is a higher probability that the price will break downward.
The triangle appears to have completed its 5-wave internal structure (ABCDE), a classical behavior of contracting triangles.
Breakout Expectation:
After a completed 5-wave triangle, a breakout is imminent.
Directional Bias: Since this triangle is forming after a strong downtrend, the higher probability is for a bearish breakout.
However, triangles can break either way, and when they do, the move is often impulsive.
Potential Scenarios:
Bearish Breakdown (High Probability):
A downside break would likely trigger a sharp fall.
Immediate support levels to watch post-breakout:
$60.00
$56.50
$46.75 (measured move — target derived from the height of the triangle projected downward)
Bullish Breakout (Low Probability but Possible):
In case of an upside breakout, resistance zones are:
$72.00 (supply zone + previous highs)
$78.00
Upside could see sharp momentum but is less likely unless there is strong fundamental support (e.g., geopolitical tensions, production cuts).
Volume Confirmation:
Volume typically contracts during triangle formation. Post-breakout, volume expansion is essential to confirm the breakout direction.
Indicators (Suggested Additional Confirmations):
Watch for RSI — if divergence forms, could signal weakness.
Monitor MACD for crossovers at breakout zones.
Summary
Triangle Completed: 5-wave structure inside the triangle — ready for breakout.
Bias: Bearish continuation pattern — higher probability of a downward move.
Trigger: Breakout of the triangle boundary with volume expansion will confirm the next move.
Targets (Post-Breakout):
Downside: $60 ➔ $56.5 ➔ $46.75
Upside (less probable): $72 ➔ $78
⚠️ Disclaimer:
This analysis is based purely on technical chart patterns and historical price action. Trading and investing involve substantial risk. Always perform your own due diligence or consult a financial advisor.

Bitcoin dominance deeper viewBased on the volume trend and the chart pattern, it can potentially be down to %58.

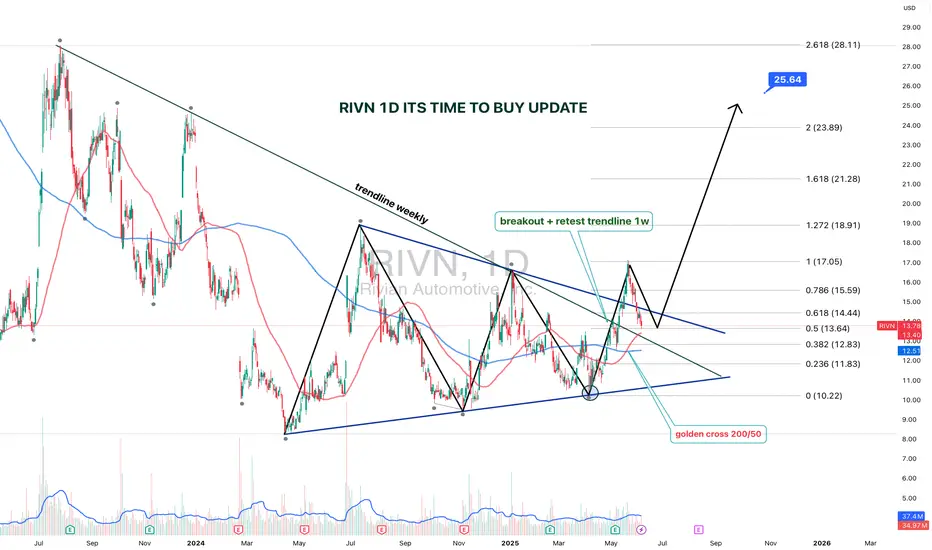
RIVN 1D — It’s Time to Buy: Setup UpdateThe setup on Rivian (RIVN) just got upgraded from “interesting” to “strategically significant.” We’re looking at a textbook symmetrical triangle that’s been developing since July 2023, with a clean breakout and retest on the weekly trendline.
The breakout was followed by a bullish retest, right at the intersection of the triangle base and the key trendline. Volume kicked in, price held — and that’s what smart money calls confirmation.
Now, the Golden Cross is live: the 50-day MA just crossed the 200-day MA from below. Price is confidently holding above both — momentum is shifting hard. Fibs from the bottom (10.22) to the last local top (17.05) project the first target at $17, and the extended Fibonacci confluence gives us $25.64 as a long-range goal (2.618 extension).
The weekly trendline — which acted as resistance for over a year — has flipped to support. Price action respects it, bulls are loading, and structure is clean.
This is not just a bounce. It’s a technical rotation from accumulation to expansion.
The time to talk about potential is over — price action has spoken.
BIOCON LIMITED KEY ZONE !!This is the Daily chart of BIOCON LIMITED.
Biocon is currently trading near its pattern resistance zone around the 340 range.
BIOCON has a strong support zone near the 300 range.
Thank You !!

GOLD → Retesting resistance may lead to a breakoutFX:XAUUSD is still bullish. The price is consolidating in the range of 3390-3345, with an intermediate bottom forming inside the channel, which overall indicates positive signs.
On Thursday, gold is consolidating ahead of $3390. Consolidation after growth, within a bullish trend, is a good sign. But, on the one hand, the price is supported by growing tensions between Russia and Ukraine. On the other hand, optimism about US trade negotiations with Canada, the EU, and China is strengthening the dollar and holding back demand for gold.
Additional pressure on the dollar is coming from weak US macro statistics, especially ADP data and the decline in the ISM Services PMI, which have reinforced expectations of Fed policy easing. Traders are waiting for further signals from the regulator.
Resistance levels: 3391.4, 3414, 3435
Support levels: 3365, 3345
Technically, gold is rising and forming a retest of consolidation resistance. If the 3391 level is broken, the price may head towards 3435. Before breaking through resistance, a correction or retest of 3365 may form. However, consolidation near 3391 and a gradual squeeze towards the level will increase the chances of a breakout and growth.
Best regards, R. Linda!

GOLD (XAUUSD): Strong Bullish Pattern
Following my previous analysis, Gold in going up.
Your next signal to buy will be a bullish breakout
of a neckline of an ascending triangle pattern on a 4H time frame.
A 4H candle close above 3392 will confirm a violation.
Next resistances will be 3408 / 3428
❤️Please, support my work with like, thank you!❤️
I am part of Trade Nation's Influencer program and receive a monthly fee for using their TradingView charts in my analysis.

S&P500 Index (US500): Bullish Accumulation Pattern
I spotted a nice example of an ascending triangle pattern on a daily time frame.
To confirm a bullish continuation, we will need a bullish breakout
of its neckline.
A daily candle close above 5996 will provide a reliable confirmation.
A rise will be anticipated at least to 6080 resistance then.
❤️Please, support my work with like, thank you!❤️
I am part of Trade Nation's Influencer program and receive a monthly fee for using their TradingView charts in my analysis.
