Celestia (TIA) – Ascending Triangle Setup (4H)BINANCE:TIAUSDT is printing a clean ascending triangle on the 4H chart, signalling a potential reversal.
Key Levels
• Support: Ascending trendline
• Resistance: $2.30 – a key level that acted as support since early April
• Measured Target: $2.50–$2.55 – aligns with prior support area
• Watch out for the longer-term descending trendline, which could act as resistance on breakout around ~$2.40
Breakout Trigger
A solid 4H close above $2.30 with convincing volume could confirm the move
Invalidation
A sustained break below the ascending support would fully invalidate the setup and potentially lead to a drop to $1.70
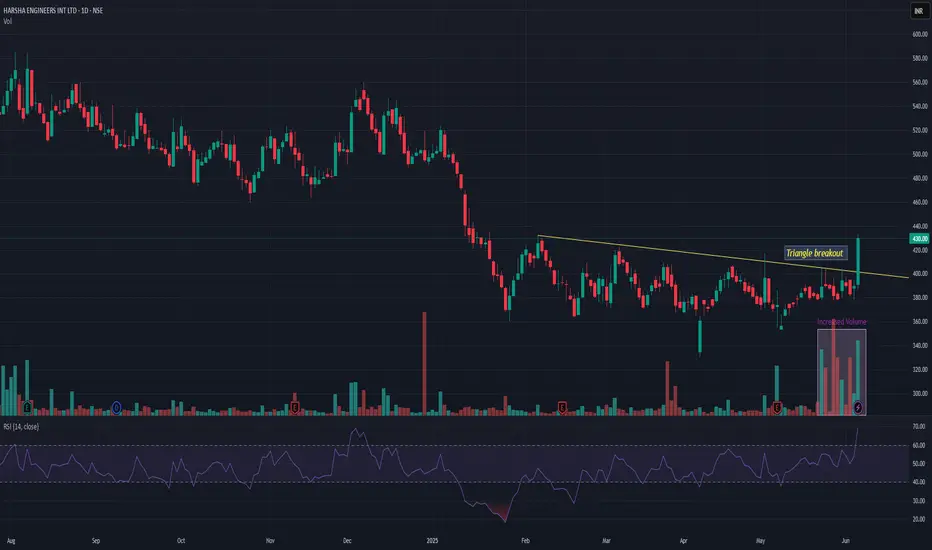
Triangle

HARSHAHARSHA giving triangle breakout with decent volume. It is coming out of long 5 months consolidation. 400 seems good support. HARSHA may give momentum rally in nr future with resistance near 510.
S&P 500: Coiling Tight as Bulls Eye 6000 BreakIf at first you don’t succeed, try, try again.
I suspect that’s what S&P 500 bulls are contemplating when it comes to clearing the psychologically important 6000 level in futures—although this time may meet with more success than when last tested in late May.
Coiling within an ascending triangle pattern, and with bullish momentum starting to flick higher again, the ducks are starting to line up for a possible topside break.
If the price can pierce 6000 and take out the May 29 high, consider establishing longs with a stop beneath 6000 for protection against reversal. Some resistance may be encountered at 6100, although the obvious target for bulls will be to take out the record high set in February.
Should the price be unable to clear 6000 and break uptrend support running from the May 23 low, it would favour range trade down to support at 5740.
Good luck!
DS

$FET Ascending Triangle Incoming PUMP? 1 Hour Time FraNYSE:FET 1Hr Time Frame
📝 Technical Analysis:
FET is currently forming an ascending triangle pattern, a typically bullish continuation structure. This pattern is developing after a clear retest of the demand zone between $0.7038 and $0.7390, which previously acted as a strong support area.
✅ Key confirmations:
- Two clear rejections from the lower boundary of the ascending triangle, suggesting strong buying interest.
-A break of the previous bearish trendline, shifting market sentiment from bearish to neutral/bullish.
-Volume consolidation seen in the lower portion of the chart aligns with the tightening price action – often a precursor to breakout.
📊 Price Action Insights:
- The next potential retracement is expected around the Golden Pocket (0.618–0.65 Fib zone), which aligns with both the ascending triangle support line and demand zone – this confluence adds strength to the level.
- A breakout above the triangle's resistance, with confirmation, would present a long opportunity.
- Fair Value Gaps (FVGs) on the 4H timeframe are visible overhead at:
$0.7873 – $0.8061
$0.8401 – $0.8470
These serve as profit-taking targets for any bullish breakout trades.
📊 Volume Profile:
Using the anchored Volume Profile:
- High volume node is seen around $0.9141–$0.9889 – indicating historical resistance where price may slow down.
- Low volume node (volume gap) exists in the mid-region, implying a potential fast move through this zone if the triangle breaks upward.
❌ Invalidation Criteria:
This bullish setup is invalidated if:
- Price breaks below the ascending triangle support, followed by a loss of the swing low and demand zone below $0.7038.
This would likely lead to a continuation of the prior downtrend.
🧠 Conclusion:
The setup currently favors bulls, provided the ascending triangle holds. A confirmed breakout above resistance opens the path toward the identified FVG zones. However, risk management is crucial around the support area as a breakdown would negate the bullish structure.

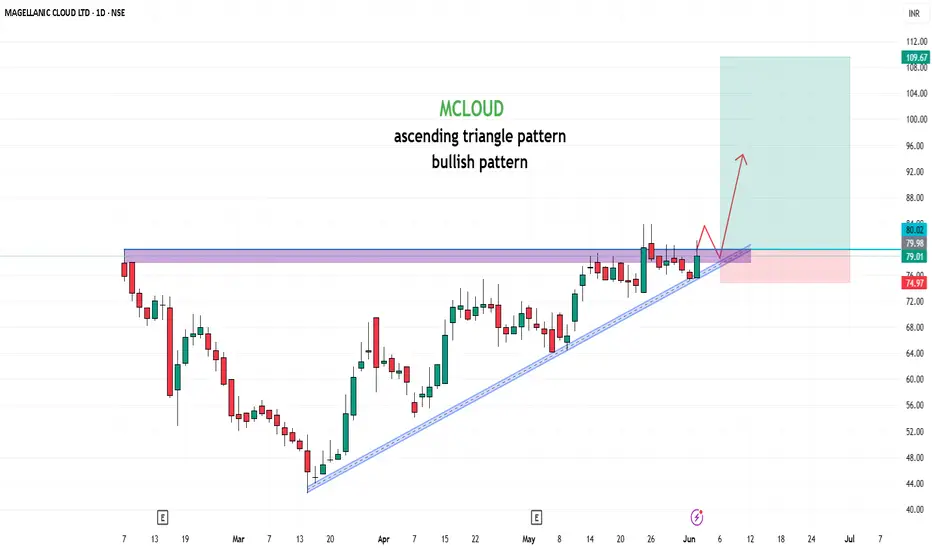
MCLOUD📊 Stock Analysis: MCLOUD
The stock has been consolidating within a ascending triangle pattern and is nearing a critical Buy Above level at ₹80 , signaling a potential breakout. The target is set at ₹179, offering a potential gain of 123.75%. Key insights:
Trend: A breakout above the wedge could indicate renewed bullish momentum.
Support Levels: Strong support around ₹75 , making this a low-risk entry point.
Volume Buzz: The recent increase in volume shows rising investor interest.
🔔 Keep an eye on this setup! Always analyze your risk tolerance before making any decisions.
📢 Disclaimer: This post is for educational purposes and not financial advice. Conduct your research or consult a financial advisor before investing.
What are your thoughts? Share them below! 📝
#StockTrading #TechnicalAnalysis #BreakoutTrading #MCLOUD
GOLD → Correction to liquidity before growthFX:XAUUSD is in the realization phase after exiting the “symmetrical triangle” consolidation. The price is supported by the trend and a complex fundamental background.
Gold is retreating from its peak, remaining below risk support. The price of gold is falling moderately from $3,392, awaiting data on JOLTS job openings in the US.
Gold is supported by trade and geopolitical risks: Trump doubled tariffs on metals, increasing pressure on the dollar. The conflict with China has escalated due to allegations of violations of agreements.
Focus on US employment: Strong data could support the dollar and limit gold's gains, but the technical picture remains bullish.
Resistance levels: 3365, 3391, 3409
Support levels: 3345, 3323
Against the backdrop of a rising dollar, gold may test deeper liquidity zones, such as 3345 and 3330. However, if trading forms between 3365 and 3345, followed by a retest of resistance and consolidation above 3365, this could trigger an early rise to 3391-3409.
Best regards, R. Linda!

Diametric Pattern near completion?Anticipating a big Upside move after completing g-wave of the Diametric pattern.
Hello Symmetrical triangleThe appearance of this symmetrical triangle marks the end of the decline in this cycle, in which the price is stabilizing in order to continue its upward movement. 109 is the next level.

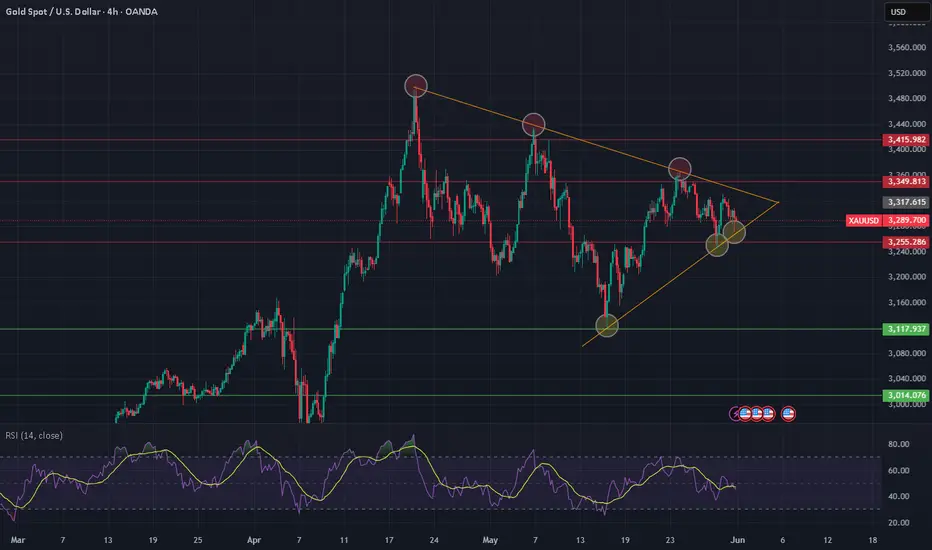
Gold Bulls Back in Control After BreakoutHaving broken triangle resistance stemming from the record highs and cleared horizontal resistance at $3367, things are once again looking bullish for bullion. Add in renewed upward momentum in RSI (14) and a bullish MACD crossover, and the preference remains to buy dips and topside breaks.
$3367 now looms as a key level to build bullish setups around, offering a logical area to establish longs with a stop beneath for protection. It would be preferable to see gold retest and bounce off $3367 before entering the trade.
$3434 screens as an initial upside target, with a clean break likely to put gold on a collision course with the record highs at $3500.
Good luck!
DS

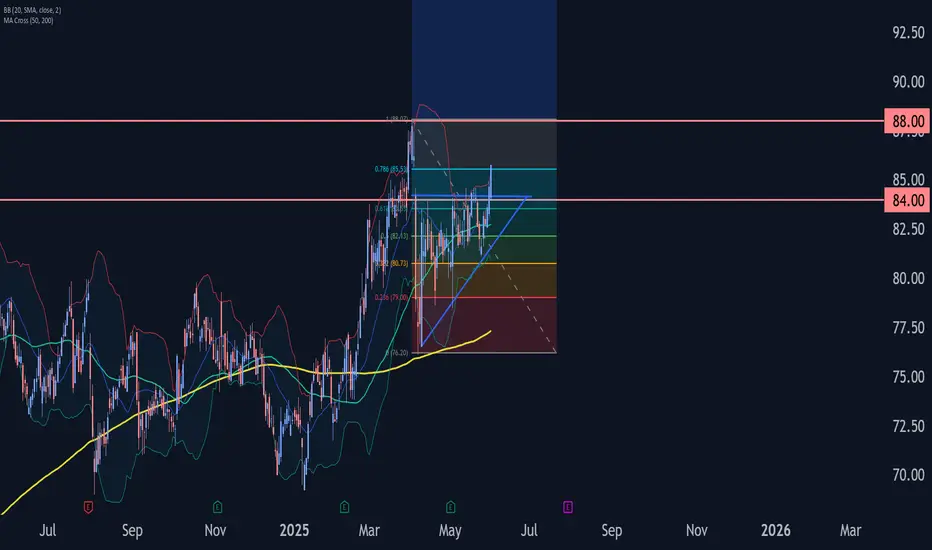
AIG Wave Analysis – 2 June 2025
- AIG broke daily Ascending Triangle
- Likely to rise to resistance level 88.00
AIG recently broke the resistance zone between the resistance level 84.00 and the 61.8% Fibonacci correction of the downward wave (2) from March.
The breakout of this resistance zone coincided with the breakout of the daily Ascending Triangle from the start of April.
Given the clear daily uptrend, AIG can be expected to rise to the next resistance level 88.00 (which stopped the earlier sharp impulse wave (1)).
GOLD → Correction after distribution. Bullish trendFX:XAUUSD is testing the liquidity zone at 3350 and forming a false breakout of resistance within the uptrend. A correction is possible before growth continues.
The fundamental background is quite controversial in the market. In the current situation, the focus is on relations between Russia and Ukraine, especially after the escalation that took place over the weekend. Everyone is watching the ongoing negotiations in Turkey. In addition, we should not forget about the situation with tariffs, which is still quite tense.
Gold has been rallying since the opening of the session and has reached the order block. A false breakout of resistance is forming, which could trigger a correction to the zone of interest. The dollar is hitting support, which could form a local correction before continuing its movement. This could also affect the price of gold, which remains bullish in the market.
Resistance levels: 3350, 3365, 3409
Support levels: 3303, 3264
The price has broken out of consolidation, with resistance tested and liquidity above 3350 realized. Relative to the current level, a correction is possible with the aim of retesting support before continuing to rise.
Best regards, R. Linda!

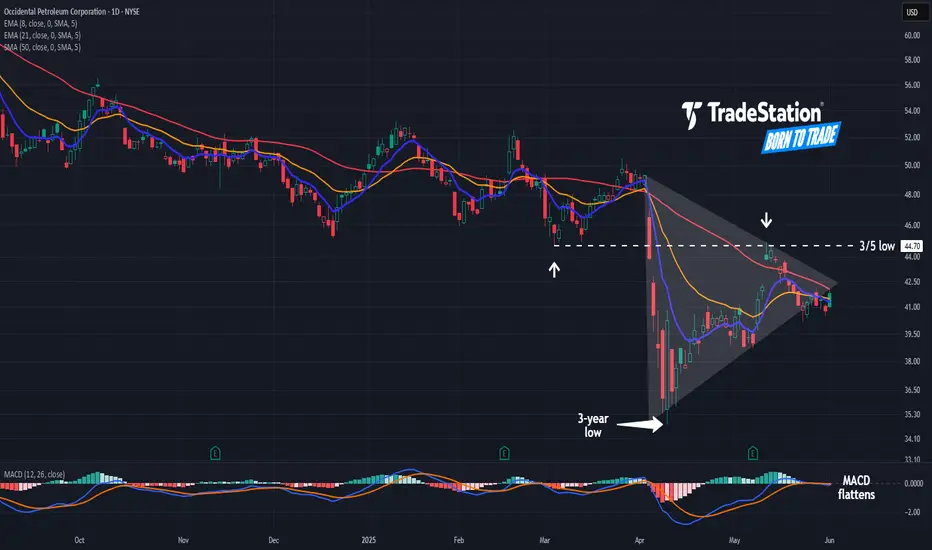
Can Occidental Hang On?Occidental Petroleum has staggered since tariffs were announced in early April, and some traders may expect the energy driller to continue lower.
The first pattern on today’s chart is the March 5 low of $44.70. The tariff news drove OXY through that support to a three-year low. It then rebounded but stalled at the previous low. Has old support become new resistance?
Second, OXY has made higher lows and lower highs. Such a narrowing range may create potential for prices to start moving if the triangle is broken.
Third, the stock has remained below its 50-day simple moving average. That may reflect a bearish intermediate-term trend.
Finally, the 8-day exponential moving average (EMA) just crossed under the 21-day EMA. That may reflect a bearish short-term trend.
Check out TradingView's The Leap competition sponsored by TradeStation.
TradeStation has, for decades, advanced the trading industry, providing access to stocks, options and futures. If you're born to trade, we could be for you. See our Overview for more.
Past performance, whether actual or indicated by historical tests of strategies, is no guarantee of future performance or success. There is a possibility that you may sustain a loss equal to or greater than your entire investment regardless of which asset class you trade (equities, options or futures); therefore, you should not invest or risk money that you cannot afford to lose. Online trading is not suitable for all investors. View the document titled Characteristics and Risks of Standardized Options at www.TradeStation.com . Before trading any asset class, customers must read the relevant risk disclosure statements on www.TradeStation.com . System access and trade placement and execution may be delayed or fail due to market volatility and volume, quote delays, system and software errors, Internet traffic, outages and other factors.
Securities and futures trading is offered to self-directed customers by TradeStation Securities, Inc., a broker-dealer registered with the Securities and Exchange Commission and a futures commission merchant licensed with the Commodity Futures Trading Commission). TradeStation Securities is a member of the Financial Industry Regulatory Authority, the National Futures Association, and a number of exchanges.
TradeStation Securities, Inc. and TradeStation Technologies, Inc. are each wholly owned subsidiaries of TradeStation Group, Inc., both operating, and providing products and services, under the TradeStation brand and trademark. When applying for, or purchasing, accounts, subscriptions, products and services, it is important that you know which company you will be dealing with. Visit www.TradeStation.com for further important information explaining what this means.
#COMI - ACTION IN THE WAY - all market will rising soon or ??!!EGX:COMI is showing a potential triangle pattern.
BB support is at 79.15, making it a good entry point for a long position.
Prices are currently trading below the middle BB line (80.16), which has acted as resistance since the start of the month.
As long as prices stay above 78.60, they are likely to reach 83.20 eventually.
At June market may go to moon , just remember who told you first .
But still be caution more than optimistic or hopeful
At this point market may achieve new historical levels from anther hand EGX30 tray many times to close over 32200 but is failed.
No one is bigger than the market and remember Technical analysis is not an accurate science .
This is not financial advice, just our analysis based on chart data. Please consult your account manager before investing.
Thanks and good luck!

RELIANCE LTD – 1H TIME FRAME ANALYSIS📊 NSE:RELIANCE – 1H TIME FRAME ANALYSIS
A symmetrical triangle pattern is forming on Reliance's 1-hour chart, showing a consolidation phase. This pattern is neutral in nature, meaning a breakout can occur in either direction, but the setup provides a great opportunity for a breakout trade.
The price is now at the apex of the triangle, indicating a potential breakout in the upcoming sessions. Watch for a strong move backed by volume.
TRADE PLAN :
Chart Pattern: Symmetrical Triangle
Timeframe: 1 Hour
Stock: Reliance Industries Ltd (NSE)
🔼 Long Trade (Breakout above 1430.55)
Entry: Above 1,430.55 (candle close with volume confirmation)
Target 1: 1,458.35
Target 2: 1,479.35
Stop Loss: Below 1,417
🔽 Short Trade (Breakdown below trendline):
Entry: Below triangle breakdown with strong red candle
Target 1: 1,397.55
Target 2: 1,368.25
Stop Loss: Above 1,430
Note: Avoid entering during the triangle zone. Trade only post-confirmation of breakout/breakdown with volume.
Disclaimer: This analysis is for educational purposes only. Please consult your financial advisor before making any trading decisions.

Crude oil surges despite OPEC supply hike: breakout coming?Crude oil prices jumped over 3.5% from Friday’s low, even as OPEC announced a major supply increase of 411,000 barrels per day starting July. The market expected more, and when that didn’t happen, prices bounced. Technically, oil remains in a triangle pattern, but signs of a breakout are emerging. If Brent pushes above the May 21 high at 66, we could see a run towards 73.32. Watch for key levels at 67.69 and 69.75.
This content is not directed to residents of the EU or UK. Any opinions, news, research, analyses, prices or other information contained on this website is provided as general market commentary and does not constitute investment advice. ThinkMarkets will not accept liability for any loss or damage including, without limitation, to any loss of profit which may arise directly or indirectly from use of or reliance on such information.

XAU/USD (Gold) – Symmetrical Triangle Setup | Breakout Imminent🔶 Chart: 4H timeframe
🔶 Pattern: Symmetrical Triangle
Gold is currently consolidating within a well-defined symmetrical triangle on the 4H chart, marked by a series of lower highs and higher lows — a classic setup indicating a potential breakout is near.
🔍 Technical Breakdown:
✅ Price has respected both trendlines multiple times, confirming the structure.
✅ The apex is approaching, suggesting volatility and a directional move are imminent.
✅ Volume is compressing, aligning with typical breakout behavior.
🧭 Bias: Neutral – Wait for Confirmation
We’re at a decision point. Don’t front-run the move — wait for a clean 4H candle close outside the triangle with volume confirmation. Whichever side breaks, the follow-through could be sharp.
Set alerts at Above and Below triangle to catch the move in real time.
ETH's situation+ Target PredictionCurrently, ETH is forming an ascending triangle and cup and handle, indicating a potential price increase. It is anticipated that the price could rise, aligning with the projected price movement (AB=CD).
Continued strength could lead to upward movement toward targets at $2700, $2900, and $3.100
However, it is crucial to wait for the triangle to break before taking any action.
Give me some energy !!
✨We spend hours finding potential opportunities and writing useful ideas, we would be happy if you support us.
Best regards CobraVanguard.💚
_ _ _ _ __ _ _ _ _ _ _ _ _ _ _ _ _ _ _ _ _ _ _ _ _ _ _ _ _ _ _ _
✅Thank you, and for more ideas, hit ❤️Like❤️ and 🌟Follow🌟!
⚠️Things can change...
The markets are always changing and even with all these signals, the market changes tend to be strong and fast!!

MOSCHIP📊 Stock Analysis: MOSCHIP
The stock has been consolidating within a ascending triangle pattern and is nearing a critical Buy Above level at ₹187 , signaling a potential breakout. The target is set at ₹359, offering a potential gain of 25.90%. Key insights:
Trend: A breakout above the wedge could indicate renewed bullish momentum.
Support Levels: Strong support around ₹170/197, making this a low-risk entry point.
Volume Buzz: The recent increase in volume shows rising investor interest.
🔔 Keep an eye on this setup! Always analyze your risk tolerance before making any decisions.
📢 Disclaimer: This post is for educational purposes and not financial advice. Conduct your research or consult a financial advisor before investing.
What are your thoughts? Share them below! 📝
#StockTrading #TechnicalAnalysis #BreakoutTrading #MOSCHIP

EURCAD Wave Analysis – 29 May 2025
- EURCAD reversed from the support zone
- Likely to rise to resistance level 1.5755
EURCAD currency pair recently reversed up from the support zone between the support level 1.5550 and the support trendline of the daily Triangle from March.
The support level 1.5550 was further strengthened by the lower daily Bollinger Band and by the 38.2% Fibonacci correction of the upward impulse from February.
EURCAD currency pair can be expected to rise to the next resistance level 1.5755 (top of the previous impulse wave i).

NVDA: Ascending triangle break, bull flag on S/R retestHey traders! I'm back and once again, I've spent almost the whole evening (lol) trying to figure out the odd, strange price action we've seen from NASDAQ:NVDA over the past few weeks, and especially today!
As we all know (I assume), Nvidia failed to disappoint on earnings once again, and we saw a HUGE gap up overnight, as far as up to the $143 mark. However, we soon began to see a dip. That's fair, as traders will likely sell and take profit.
However, the dip became a larger dip, and Nvidia finished the day basically at 3.2%. But it seems that the pullback may been pretty healthy.
Because as you can see from the chart, Nvidia has been forming an ascending triangle ever since the 14th May. That was after the sweet run it had prior to that. It has tested the £136-137 area as a major resistance line ever since until finally, a strong earnings report sent Nvidia above the line.
After the gap up, throughout the day, the stock went into a controlled, composed downward channel which what we like to call, a bull flag. This is taking into consideration market hours, not extended hours. This bull flag is bullish in its own way, but it is also a sign of a retest of the $136-137 resistance zone. This is officially a support zone now.
A successful retest from this support zone will cause a bounce, especially from the support trendline, and likely send the stock towards $140+, possibly extending its reach to $150 if broader market strength (Nasdaq) continues.
On the contrary, a dip below the support line and a crash below the red support trendline, would likely send the stock lower to $133 as next support.
As long as Nvidia maintains $136-137, the bulls are in control.
Note: Not financial advice. Please do your DD.

"PEPE 1H Analysis - Breakout Incoming? 📊 *PEPE/USDT – 1H Technical Analysis*
An ascending triangle pattern is developing on the 1-hour timeframe, which often indicates potential bullish momentum.
🟢 Price is approaching a key resistance near *0.00001516*.
🟡 A clean breakout above this level with strong volume may open the door for further upside.
🔴 Watch for *confirmation* before considering any move.
🔍 This chart is purely for educational and analytical purposes.
No financial advice. Do your own research before making any trading decisions.
#PEPE #PEPEUSDT #Crypto #TechnicalAnalysis #TradingView #Altcoins

SIGN/USDT – Bullish Breakout Alert!🚀 SIGN Breakout Alert – 80% Potential Incoming?! 👀🔥
Hey Traders! If you're all about high-conviction plays and real alpha, smash that 👍 and tap Follow for more setups that actually deliver! 💹💯
SIGN has just broken out from a symmetrical triangle after consolidating tightly for weeks. The breakout is supported by strong volume and a solid bounce from the base of the structure.
Entry: $0.082 - $0.085 (post-breakout zone)
Targets:
• $0.095
• $0.112
• $0.134
• $0.159
Stop-loss: Below $0.076
Risk-Reward: Over 6:1 — Excellent setup for trend traders.
This move could mark the beginning of a strong upside wave. Keep it on your radar and manage your risk accordingly!
Let me know your thoughts or if you're riding this one too!

Be careful with TON !!!Currently, TON is forming an ascending triangle, indicating a potential price increase. It is anticipated that the price could rise, aligning with the projected price movement (AB=CD).
However, it is crucial to wait for the triangle to break before taking any action.
Give me some energy !!
✨We spend hours finding potential opportunities and writing useful ideas, we would be happy if you support us.
Best regards CobraVanguard.💚
_ _ _ _ __ _ _ _ _ _ _ _ _ _ _ _ _ _ _ _ _ _ _ _ _ _ _ _ _ _ _ _
✅Thank you, and for more ideas, hit ❤️Like❤️ and 🌟Follow🌟!
⚠️Things can change...
The markets are always changing and even with all these signals, the market changes tend to be strong and fast!!
