Triangle Pattern BreakoutThe stock has broken Triangle Pattern and cup and cup and handle resistances with massive volumes. Buy at 227 with accumulation till 206. Target of 291/438. Use a risk reward of 1:4
Triangle

Descending Triangle Pattern Breakout - MedplusTechnical Analysis:
Current Price: ₹885
Stop Loss: A closing basis stop loss at ₹785 provides a defined risk level.
Target: Your target of ₹1500 suggests a significant potential upside.
Descending Triangle Breakout: A breakout from a descending triangle is typically considered a bearish signal, indicating a potential continuation of a downtrend. However, in some cases, a breakout in the opposite direction (above the upper trendline) can occur, which would be considered bullish. It's crucial to confirm the direction of the breakout you are observing.
Time Frame: A 3 to 6-month timeframe is reasonable for a pattern like this to play out.
Understanding Descending Triangle Breakouts:
Typical (Bearish) Scenario: In a typical descending triangle, the price makes lower highs while the lows remain around a horizontal support level. The breakout usually happens below this support, indicating further downside.
Atypical (Bullish) Scenario: If the price breaks decisively above the descending upper trendline of the triangle, it can signal a bullish reversal or a strong upward move, negating the typical bearish implication. This is what you seem to be anticipating.
Key Factors to Consider for a Bullish Breakout:
Breakout Confirmation: For a bullish scenario, the price needs to break clearly above the upper descending trendline of the triangle with strong volume.
Sustainability: The price should sustain above the breakout level and not fall back into the pattern.
Market Context: The overall market sentiment and the performance of the pharmaceutical/healthcare sector can influence MEDPLUS's price action.
Company Fundamentals: While you haven't mentioned fundamental analysis, it's always wise to consider the company's financial health and future prospects alongside technical patterns. Recent positive financial results for MEDPLUS could support a bullish move.
Target of ₹1500:

Bitcoin can drop from wedge to 100K pointsHello traders, I want share with you my opinion about Bitcoin. After consolidating for an extended period within a triangle pattern, the price eventually broke out with strong bullish momentum. The move was supported by a solid rebound from the buyer zone and a clean breakout above the 92800 - 94200 support area. This breakout initiated a steep climb, forming a new upward wedge structure, defined by narrowing trend lines and rising local highs. Currently, the price is trading near the resistance boundary of the wedge, around the 104000 - 105000 zone. This zone has already triggered one rejection and is showing signs of weakening bullish strength. Given the rising wedge geometry and the fading impulse strength, the risk of a correction is increasing. The current structure typically leads to a pullback, especially after such a steep rise. I expect that BTC may rise to the resistance line of the wedge and then drop below the support line, thereby exiting from this pattern. That's why I set my TP 1 at the 100K points. Please share this idea with your friends and click Boost 🚀

Gold can correct to support line of channel and then start growHello traders, I want share with you my opinion about Gold. In this chart, we can see how the price, after forming a triangle structure and breaking out to the upside, Gold entered a downward channel, where it has been consistently respecting both the resistance and support lines. Each bounce from the lower boundary of this channel signals local buyer interest, especially near the support level around 3060, which also overlaps with the buyer zone. Recently, the price rebounded from this support line, indicating a potential start of a bullish correction inside the channel. This move is consistent with past price behavior, strong impulses from the bottom boundary followed by gradual movement toward the upper resistance line. Given the structure and the ongoing bounce, I expect Gold can correct the support line of the channel, after which it turns around and starts to grow to the 3290 resistance level, which aligns with the upper boundary of the pattern and the beginning of the seller zone. That’s why my TP 1 is set at 3290 points - a reasonable technical target within the current channel formation. Please share this idea with your friends and click Boost 🚀
Disclaimer: As part of ThinkMarkets’ Influencer Program, I am sponsored to share and publish their charts in my analysis.

BDP. Deep Underrated Value.Market veteran and remains in business - building, researching for five years. The chart is global - weekly and a global downward channel is visible, in which the price can move x50 - amazing. Possible channel breakout will send the price to x360 and capitalization to 500 million, which is not unattainable given the niches in which the project positions itself. Me in game, sirs, prepare.

Bitcoin Ascending Triangle (4H)BINANCE:BTCUSDT might be forming an ascending triangle on the 4H chart, with a horizontal resistance at $105k and support being the resistance of the broadening wedge we identified last week: Bitcoin Ascending Broadening Wedge (4H)
A sustained break above $105k would set the target at $109k, very close to ATH.

Triangle Breakout Alert: IOLCP Eyes ₹100!Key Observations:
Symmetrical Triangle Pattern:
The price was consolidating within a symmetrical triangle, marked by:
Descending trendline (upper resistance)
Ascending trendline (lower support)
Breakout:
On May 15, 2025, the stock broke out above the descending trendline with a strong bullish candle.
The breakout is accompanied by a significant increase in volume (5.3M), which validates the breakout strength.
Price Movement:
The stock closed at ₹77.04, up 9.56% for the day.
This strong move above resistance suggests the beginning of a potential uptrend.
Technical Implications:
Bullish Signal: The breakout from a consolidation pattern with high volume is a classic bullish indicator.
Resistance Turned Support: The breakout level around ₹68-₹70 could now act as a support zone.
Upside Targets (based on pattern height):
Approximate height of triangle: ₹88 (peak) - ₹58 (base) = ₹30
Projected target = Breakout level (₹70) + ₹30 = ₹100 (short- to medium-term target)
Conclusion:
This is a bullish breakout setup. Traders might consider this a buy signal with potential targets around ₹90–₹100, and a stop-loss near ₹68 to manage risk.

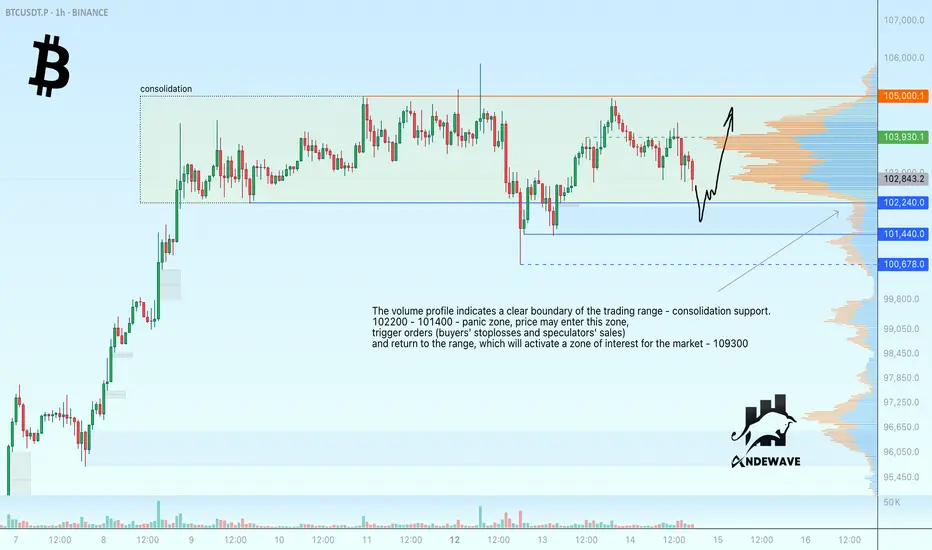
Bitcoin ready to test support before risingThe volume profile indicates a clear boundary of the trading range - consolidation support as a target for the current local movement.
102200 - 101400 - panic zone, price may enter this zone, provoke bids (buyers' stoplosses and speculators' sales) and return to the range, which will activate a zone of interest for the market - 103930.
Scenario: the price is trading inside the consolidation with clear boundaries - support and resistance. The price is aiming for the support within a bullish trend. False breakdown of support may trigger a rebound and growth. Target 103930 - 105000
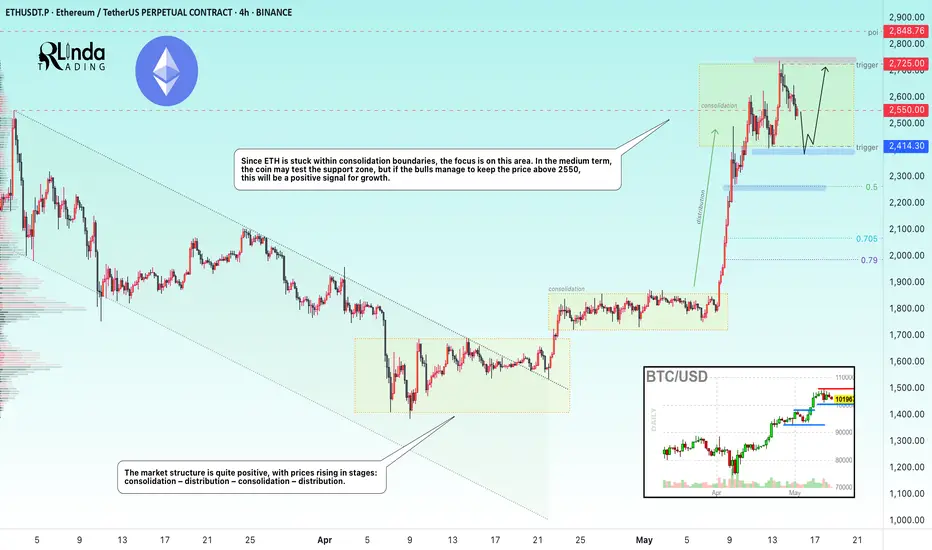
ETHEREUM → Consolidation. Which way will the distribution go?BINANCE:ETHUSDT.P has moved into a consolidation phase after the distribution phase. Focus on the 2414-2725 range. A retest of support is possible during the current phase. Despite the bullish trend, there are risks of a reversal...
ETH has been a fairly unprofitable project over the past few years, with the price hitting one bottom after another. While Bitcoin and altcoins were flying high, ETH has only shown itself to be a bull in the last few days.
In the current phase, the focus is on the consolidation boundaries, as well as the 2550 level. If the bulls keep the market above 2550, then the coin could strengthen to 2725, which would be a positive sign for us that buyers are interested in continued growth.
If ETH continues its correction towards support at 2414, then we will need to monitor the market's reaction to this level. I remain skeptical about ETH due to its weak long-term performance despite a strong fundamental backdrop.
Resistance levels: 2550, 2725
Support levels: 2414, 2260
Further movement will determine the price's exit from consolidation: a breakdown of support means a fall, a breakout of resistance means growth. But the current scenario is trading within the range. If ETH trades near 2725 and forms a pre-breakout consolidation, then we will have a chance for growth.
The opposite scenario is if the price falls below 2550 and begins to test 2414. In this case, sticking to the support level and numerous retests will indicate that the bull market has exhausted its strength and we can expect a correction to 2260-2065.
Best regards, R. Linda!
LTC/USDT 1-Hour Chart – Symmetrical Triangle Alert! Litecoin is gearing up for a big move on the 1-hour chart!
We’ve got a textbook Symmetrical Triangle forming, with LTCUSDT squeezing tighter and tighter between converging trendlines. The price is now approaching the upper resistance of the triangle around $104. This setup is screaming breakout potential!
If LTC clears the triangle’s resistance, we could see a strong push toward the $111.01 target — a key resistance level to watch. On the flip side, if it fails to break out, the $92.16 level (now potential support) will be critical to hold. Volatility is coming, and I’m ready for it — are you? Let’s see if Litecoin can spark a rally!
Key Levels to Watch:
Support: $92.16 (previous resistance, now support)
Resistance: $104 (triangle upper boundary)
Target: $111.01 and $125 (next major resistances)
What’s your take, traders? Are we breaking out or pulling back? Drop your thoughts below!

GOLD → One step away from a bullish trend reversalFX:XAUUSD is emerging from the local corrective channel “flag.” Pre-breakdown consolidation relative to the base of the reversal pattern continues. All eyes are on 3200...
Gold is losing ground amid trade optimism and a strong dollar. The price is falling at the start of Wednesday as traders take profits after a rise from weekly lows. Weaker-than-expected US inflation has not justified expectations, but the Fed's refusal to cut rates soon is weighing on the metal. Optimism surrounding new trade agreements between the US and China, the UK, and other countries, as well as hopes for peace talks between Russia and Ukraine, are reducing demand for gold as a safe-haven asset.
Technically, the overall situation looks bearish. There is no deep pullback from support, which means pressure from sellers in the market. Consolidation is forming before an attempt to break through the 3200 level.
Resistance levels: 3243, 3257, 3269
Support levels: 3222, 3200
If the price continues to consolidate in the current local range and continues to attack support at 3222-3200, then in the short and medium term, we can expect the decline to continue. However, knowing the tricks of MM, the price may form a short squeeze relative to local resistance zones before falling further.
Best regards, R. Linda!

Symmetrical TriangleLong position opportunity
Symmetrical Triangle Pattern ( 4HR Timeframe )
Look for price to continue upwards if the monthly candle finishing as a rejection
MAGIC Breaking Out – Next 100% Move on the Horizon?🚀 MAGIC Breakout Alert – 100% Potential Incoming?! 👀🔥
Hey Traders! If you're all about high-conviction plays and real alpha, smash that 👍 and tap Follow for more setups that actually deliver! 💹💯
MAGIC has finally broken out from a long-standing symmetrical triangle on the 4H chart — a classic bullish reversal pattern. After consolidating tightly, it's now flashing signs of a strong upward impulse! ⚡
📌 Entry: CMP ($0.200) and add more on dips up to $0.195
🎯 Targets: $0.25 / $0.29 / $0.33 / $0.39
🛑 Stoploss: Close below $0.176
⚙️ Leverage: 5x (Max)
✨ Previous breakout delivered over 100% gains — this one could be next!
Chart structure + volume looks perfect. If BTC stays calm, we might witness another explosive move in MAGIC.
💬 What are your thoughts on this setup? Drop your opinions below and don't forget to like & follow for more high-conviction trade setups! 💥

ROKU Close to Key Support After the Selloff Roku fell after its earnings report and updated guidance. Despite reporting EPS that beat expectations by 27.14%, Roku lowered its revenue guidance to $4.55 billion, down from the previous estimate of $4.61 billion. However, the sharp decline in price may present a buying opportunity for a medium-term swing trade.
Roku’s EPS is expected to turn positive in the third quarter, supported by increasing revenue in each quarter. The 12-month analyst consensus price target is $83.76, which is approximately 38% above the current price.
From a technical perspective, an ascending triangle formation appears to be developing at the bottom. While ascending triangles are typically continuation patterns, and rarely form at bottoms, it is still a positive sign for Roku. The lower line of the channel, which is near the 52 level and aligned with key horizontal support, can be viewed as solid support. As long as this support holds, an upward move toward the 200-day SMA and then to the 82.50 level is possible.

GOLD → Retest resistance before fallingFX:XAUUSD is forming a correction and retesting a strong resistance and liquidity zone within a downtrend. The global trend is one step away from a reversal...
Gold stabilized ahead of the release of US inflation data. After falling 3%, gold is holding steady at around $3,200, consolidating against a weaker dollar. Investors are awaiting US CPI data, which could set a new direction.
Optimism about the US-China trade agreement, geopolitical détente, and profit-taking on the dollar are holding back the price decline. The market is assessing how inflation data will affect Fed policy and demand for safe-haven assets.
Globally, the market doubts that the upward trend will continue, and there are reasons to look for points from which the price could start to fall sharply...
Resistance levels: 3269, 3284
Support levels: 3246, 3200, 3167
The news may cause a shake-up, but if there are no surprises, a false breakout of 3260-3270 and consolidation of prices in the selling zone could trigger a decline to 3200-3150.
Best regards, R. Linda!

SUIUSDT → False breakdown of support before growthBINANCE:SUIUSDT has entered a consolidation phase within a bullish trend. The chart shows a zone of interest and a trigger area that are worth paying attention to...
The coin looks quite positive. An upward trend is forming, which is also supported by the growth of Bitcoin and a relatively positive fundamental background.
Technically, SUI is consolidating between 4.110 and 3.811. Below the support level, a huge liquidity pool has formed, which has not yet been tested. There is a high probability of a false breakdown before the growth continues, but if the market turns out to be more aggressive, buyers may not let the price fall to 3.811, in which case we can consider a breakout of the resistance at 4.11-4.275 and consolidation of the price above these levels with the aim of continuing growth.
Support levels: 3.811, 3.667
Resistance levels: 4.11, 4.275
The movement of Bitcoin shows that the market is gathering liquidity as part of a local correction against the backdrop of a bullish trend. Yesterday, we all witnessed a local liquidation, but there are no reasons for a decline yet. SUI, in an ideal scenario, may test support at 3.811 and form a false breakdown before continuing to grow.
Best regards, R. Linda!

AUDUSD: Bullish Move After Breakout 🇦🇺🇺🇸
AUDUSD broke and closed above a key horizontal resistance yesterday.
Retesting the broken structure, the price formed a tiny ascending
triangle pattern on an hourly time frame.
I expect a bullish continuation now.
Goal - 0.6492
❤️Please, support my work with like, thank you!❤️
I am part of Trade Nation's Influencer program and receive a monthly fee for using their TradingView charts in my analysis.

Nasdaq-100 Wave Analysis – 13 May 2025- Nasdaq-100 broke resistance area
- Likely to rise to resistance level 21500.00
Nasdaq-100 index recently broke the resistance area between the resistance level 20220.00 (which has been reversing the index from March) and the resistance trendline of the Ascending Triangle from April.
The breakout of this resistance area accelerated the active short-term ABC correction 2 from last month.
Nasdaq-100 index can be expected to rise to the next resistance level 21500.00 (target price for the completion of the active wave 2).

Bullish BO of a descending channel and triangleJD has been pulling back for quite a while, and has just recently broken from the descending channel, after touching a higher TF dynamic support level, reacting from it and today with volume, obviously, every trade has their risks, plus tomorrow is it's earnings release so keeping that in mind... Need to act quickly if investors don't like the results and actually pull the market back down, however, it could go positively and allow us to capitalize on the uptrend as well.
So it is a slight risky trade, however, never invest the whole lot in one go, and accumulate as the price allows you to do it!

Gold outlook: inflation, tariffs, and the key level to watchI'm long-term bullish on gold. With Trump pushing for 10% tariffs across the board, inflation risks are rising. Add tax cuts and already low unemployment, and you have a recipe for more upside. But why is there a risk that the price drops first, before heading higher? Watch the video to learn.
This content is not directed to residents of the EU or UK. Any opinions, news, research, analyses, prices or other information contained on this website is provided as general market commentary and does not constitute investment advice. ThinkMarkets will not accept liability for any loss or damage including, without limitation, to any loss of profit which may arise directly or indirectly from use of or reliance on such information.

CAKE is retestingAfter a successful breakout of triangle pattern from the top side, CAKE is now going to retest the resistance line.
So far so good.
Golden long is coming soon ...
-------------------------------------
Share and follow me for further analyses.

Ethereum Is Quietly Preparing for a Massive Move !Hello Traders 🐺
In this idea, I want to show you one of the coolest charts I’ve ever seen in my life — seriously!
These kinds of patterns, especially on the monthly time frame, take multiple years to form, and that’s exactly why they are extremely valid. When a structure develops on higher time frames, we can rely on it more confidently and make smarter decisions 📊
As you can see on the chart, ETH price is moving inside a very clear ascending channel, and its reactions to the channel lines are simply beautiful. Let’s take a closer look:
In addition to the top and bottom of the channel, we also have a “make or break” level, shown by the blue dotted line (which is the middle line of the channel).
Price reactions to this line throughout different time periods have been amazing. And here's the more interesting part:
👉 Price is currently above the middle line, and on its way up, it’s approaching one of the most critical resistance levels — the orange descending trendline.
If we zoom out, we’ll see that ETH is actually squeezed between this descending resistance and the ascending channel's middle line, forming a beautiful triangle 🔺
If ETH can break above this triangle, we could see a massive surge, possibly taking price all the way up to the top of the channel, which in my opinion is somewhere around $15,000 🚀
Now let’s talk about RSI:
If you take a closer look at the RSI below the chart, you’ll notice a repetitive pattern.
Each time ETH enters a major bull run or makes a new all-time high, RSI touches the upper resistance in the overbought zone.
We’re still in the early stage of this cycle — and both technically and indicator-wise, there seems to be plenty of room to grow.
Hope you enjoy this idea — I’ll be happy to answer your questions in the comments below 👇
And as always, remember our golden rule:
🐺 Discipline is rarely enjoyable, but almost always profitable 🐺
🐺 KIU_COIN 🐺

EPT/USDT Breakout Alert – Triangle Resolved, Targets Set!🚀 EPT Breakout Alert – 100% Potential Incoming?! 👀🔥
Hey Traders! If you're all about high-conviction plays and real alpha, smash that 👍 and tap Follow for more setups that actually deliver! 💹💯
EPT has just broken out from a symmetrical triangle on the 2H chart, indicating the start of a potential bullish wave. After weeks of consolidation, this breakout looks strong and is supported by increasing momentum.
📌 Entry: Current Market Price (CMP) – $0.0110
📉 Add More on Dip: Down to $0.0104
🎯 Targets:
TP1: $0.0138
TP2: $0.0165
TP3: $0.0194
TP4: $0.0223
🛑 Stop Loss: $0.0092
⚙️ Leverage (Optional): 3x–5x
A clean structure, breakout confirmation, and tight invalidation level make this setup attractive for short-to-mid-term swing traders.
💬 What do you think about this move? Are you in? Drop your thoughts below!
