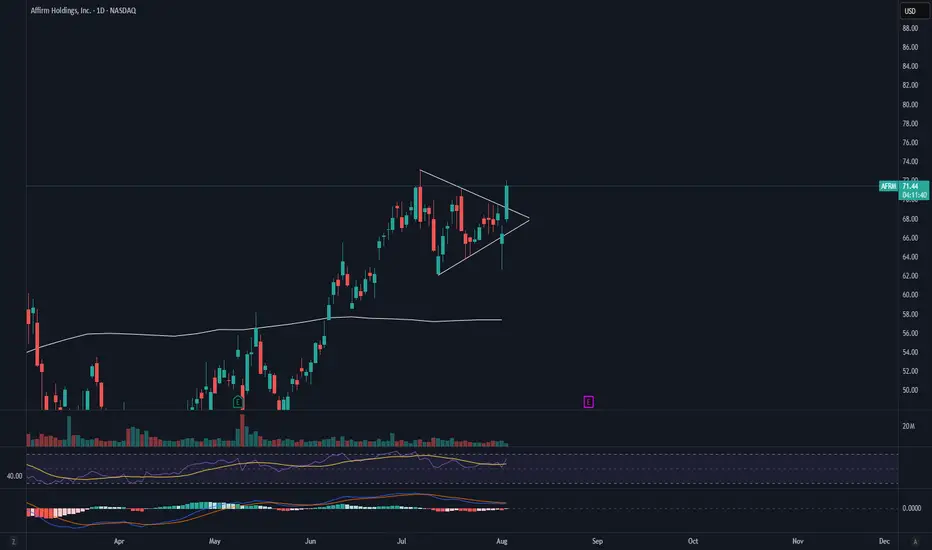
AFRM Pre Earnings Triangle BreakAFRM has broken the symmetrical triangle to the upside. If this holds we could see a strong rally into earnings. I would want to see strong volume added to this equation for the move up to be confirmed.
My STOP on this position would be a daily candle close back under the trendline with confirming volume. A retest of the triangle would be my spot to add to the position.
Triangle
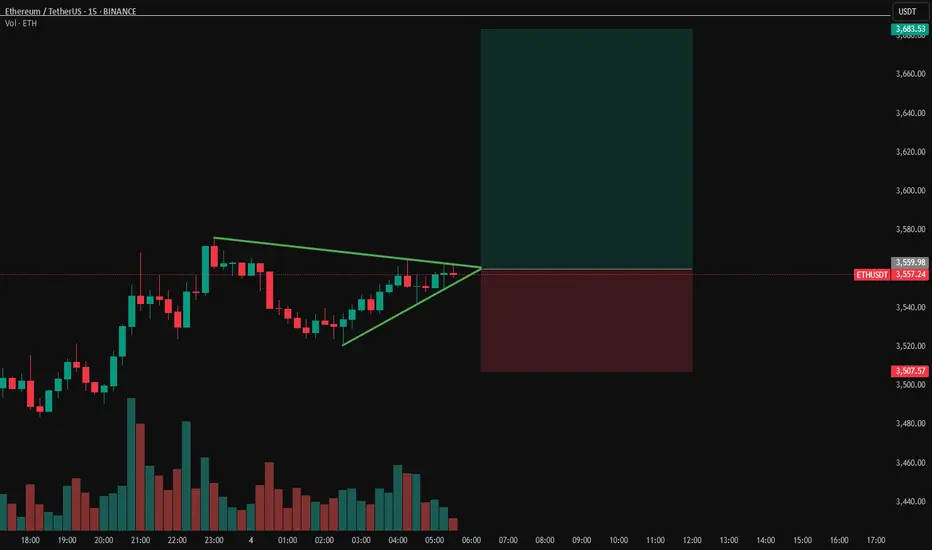
ETHUSDT Breakout ImminentETH sitting on $3500 support after reclaim
Price action is tight and indecisive.. lots of dojis and back-and-forth engulfing candles. Buyers and sellers clearly fighting it out.
We’re coiled in a symmetrical triangle, right on a key level that used to be strong support. It got broken but now reclaimed, im leaning bullish.
S&P and Nasdaq opened strong. If we break out of this triangle to the upside with volume, we could see a quick move toward $3650-3700.
USDJPY → False breakdown of upward trend supportFX:USDJPY is testing trend support as part of a correction triggered by news. The dollar has been recovering since the start of the session, giving the pair a chance to rise.
As part of a correction against the backdrop of sharp and unexpected Friday NFP data, the currency pair is forming a false breakdown of trend support and testing the 0.7f buy zone. The market is reacting to the retest of support. Momentum is forming. Focus on the local range of 147.6 - 147.9. If the bulls keep the price above this consolidation, the price may continue to rise
Resistance levels: 147.95, 149.02
Support levels: 157.55, 147.0
Focus on the trend and the indicated consolidation, which may move into the realization phase. If the bulls take the initiative, the pair will have a chance to rise to 149 - 150.8.
Best regards, R. Linda!

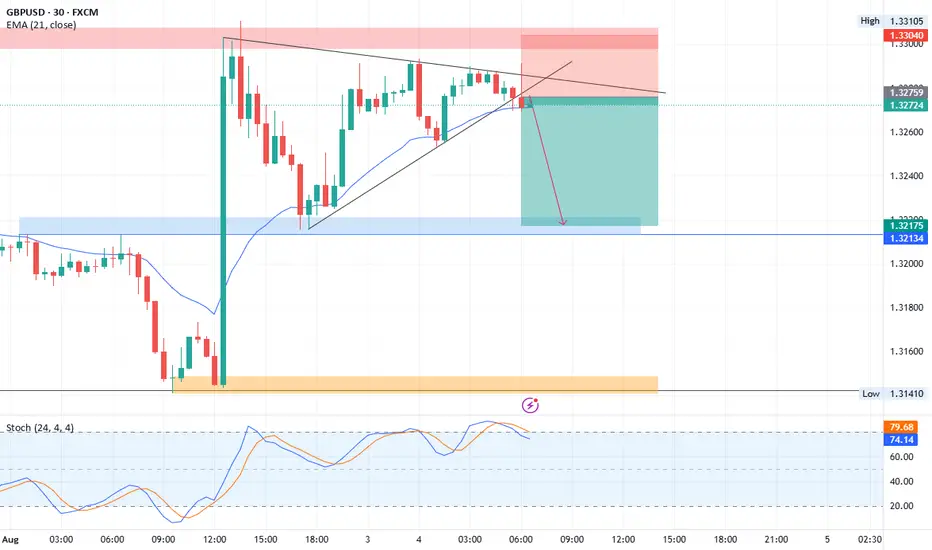
GBPUSD short setupGBPUSD rising trendline break and retest falling trend line finnly breakout triangel.
Sell below: 1.3275
Stop Loss: 1.3305
1st target: 1.3250
2nd target: 1.3215 FOREXCOM:GBPUSD
XAUUSD sclping setupXAUUSD M15 create double doji evning shoting star.
Sell below: 3361.00
Stop Loss: 3364.00
1st TP: 3355
2nd TP: 3351
3rd TP: 3347
4th TP: 3341
If breakout rising trendline and 3340 then gold more downward move 3330, 3318 and 3302.

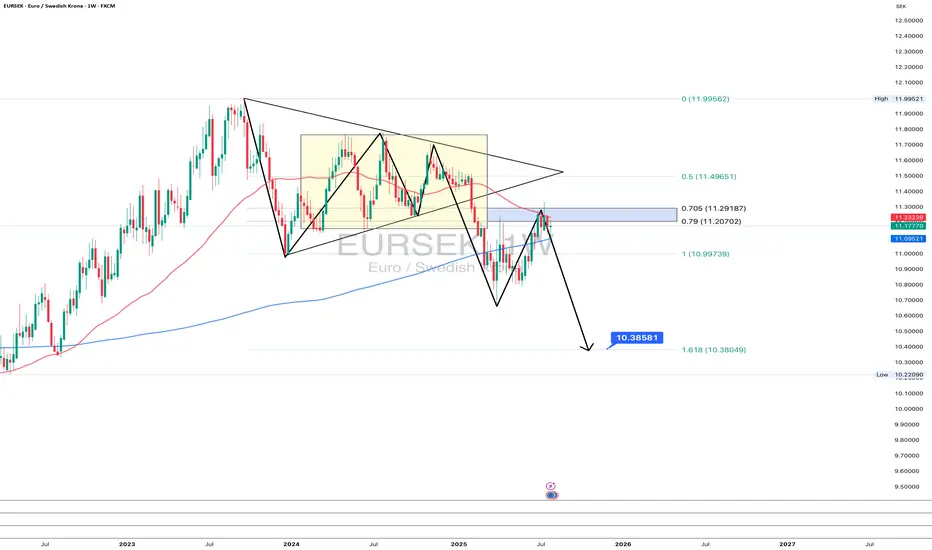
EURSEK 1W: triangle breakdown - bearish retest in playOn the weekly chart, EURSEK completed a symmetrical triangle pattern followed by a clean breakdown. The recent bullish move is now testing the 0.705–0.79 Fibo zone ($11.29–11.20), which aligns with the lower boundary of the former consolidation and 200 EMA resistance. So far, the price fails to break and hold above — suggesting a bearish continuation is likely.
Technical outlook:
Symmetrical triangle broke downward
Price is retesting Fibo zone 0.705–0.79
Strong resistance near 11.29
EMA200 adds overhead pressure
Next downside target: 1.618 Fibo at 10.38
From a macro perspective, the Swedish krona is holding better due to domestic rate expectations, while the euro may weaken further if the ECB pauses tightening. If the trend holds, EURSEK could break 11.00 and head toward 10.38 in the coming weeks.
When structure and fundamentals align - markets tend to follow.
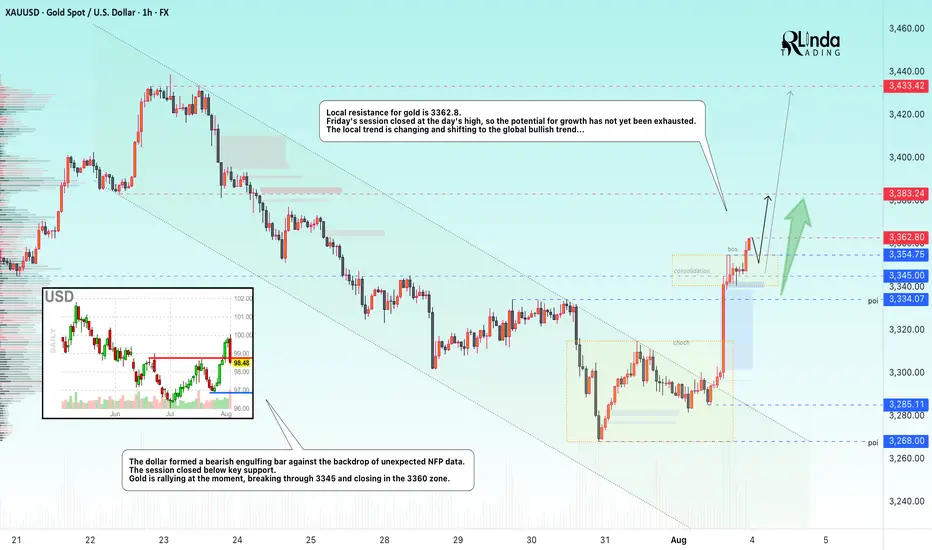
GOLD → The rally following weak NFP data may continueFX:XAUUSD is moving into distribution (rally) on the back of unexpected NFP data released on Friday. The dollar is plummeting...
Fundamentally, the gold market is getting support from an influx of funds after the unexpectedly weak NFP report. Against this backdrop, Trump said that the employment data had been “rigged” to make him look bad...
I believe that the situation is somewhat different: the president's administration failed to control this moment, hoping to see positive dynamics. Powell now has a small trump card to control his actions. The reduction in interest rates will most likely be postponed until the fall.
Technically, on D1, gold is rebounding from the support of the global trading range, forming a local bullish trend that coincides with the global one.
Resistance levels: 3362.8, 3383, 3433
Support levels: 3345, 3334
Gold is exiting the local downward channel, breaking through resistance at 3334 and 3345. Consolidation is forming, and by the end of the session, the price will break through resistance at 3354.75. The market is quite strong. Focus on two levels: 3362.8 and 3354.7. At the opening of the session, the price may attempt to break through the resistance level of 3362.8. If gold consolidates above this level, growth may continue. If not, then before further growth, the market may test the support level...
Best regards, R. Linda!
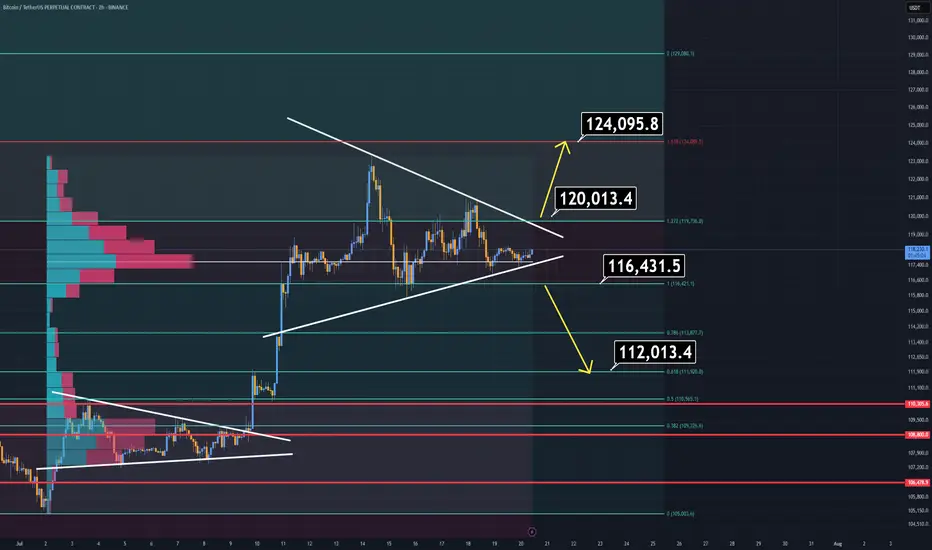
BTC Analysis (2H)Bitcoin is currently consolidating within a symmetrical triangle, suggesting indecision in the market. However, a breakout is imminent — and when it comes, it will likely be sharp.
🔹 Bullish Scenario:
A breakout above $120K would likely lead to a new All-Time High near $124K.
🔹 Bearish Scenario:
A breakdown below $116,400 opens the door for a quick drop toward the $112K–$110K zone, which should be considered a buy opportunity.
⚠️ Pro Tip:
There’s a volume imbalance just below the $116.4K level. If price breaks below it, the move down may be faster and more aggressive than expected — so plan accordingly.
Regardless of short-term volatility, the macro trend remains bullish, and Bitcoin will rise again.
Thanks for reading.
SOLANA's Situation, A Comprehensive Analysis !!!The price on the 3d timeframe is within an ascending triangle, which can be promising. If the price breaks this pattern with bullish candles, it could easily rise by the distance of AB=CD .
Best regards CobraVanguard.💚

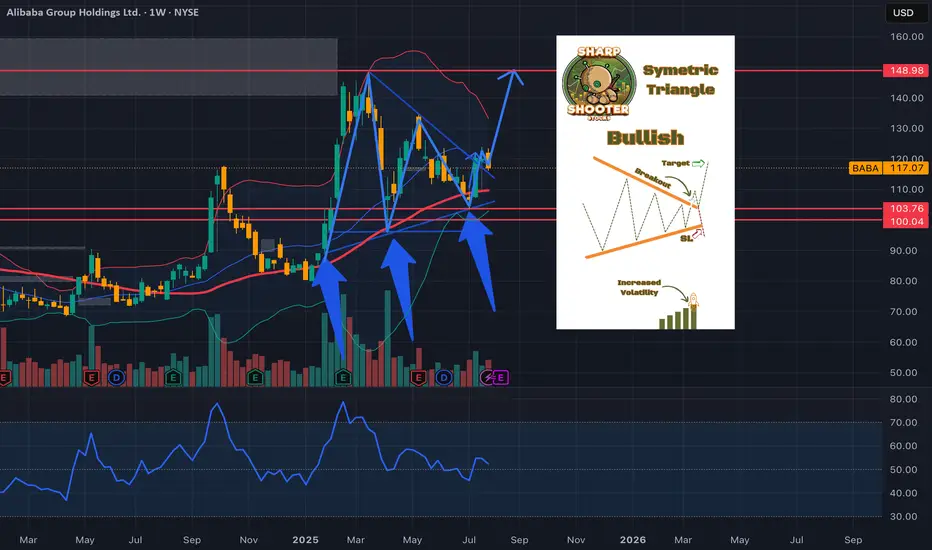
BABA could BREAKOUT back to ALL TIME HIGHS!I believe NYSE:BABA is priming up for a breakout, returning to All-Time Highs and possibly Higher!
- Technicals: Break and Retest (Symmetric Triangle)
- Upcoming Earnings: August 14th
- Potential Catalyst: US / China Trade Deal or Extension
Telusdt Buy opportunitySpotted a potential ascending formation with price currently developing a mini bullish flag. This structure suggests an underlying accumulation phase ahead of a potential breakout.
The strategic focus is the Buy Back Zone, a key area for strong accumulation entries. Targets are clearly mapped on the chart, with 0.009896 as the first short-term objective, followed by 0.061317.
The final critical area to monitor is the Crucial Resistance Zone, acting as the neckline of the entire setup—its breakout will confirm a long-term structural shift. Watching closely for sustained momentum.

ETH Targets $12,500 With Potential Ascending Triangle BreakoutThis post updates my earlier post and revises the previous prediction upwards.
Pattern
As we can see on the 3-Month ETH/USD log chart, ETH price compresses within an Ascending Triangle formed by trendlines set at the candle bodies (not wicks). The upper trendline is almost perfectly horizontal and sits at $3600. ETH is currently attempting breakout, but would need a 3-Month close (end of Q3) above the upper trendline at $3600 to confirm the new uptrend.
Target Price
As someone new to Technical Analysis, my original chart used the linear layout, which I have come to learn is less well suited for charting patterns on long timeframes. The updated chart here shows a much more reliable pattern, but also suggests a much higher, yet still conservative, price target of $12,500. I am unsure of the timeline for which ETH could achieve this price, but I assume it would occur this cycle, which is consistent with other bullish ETH predictions, such as Tom Lee's recent call for $10k - 15k.
Method
Ascending Triangles are bullish continuation patterns. The breakout price target is obtained by measuring the percentage distance from the widest part of the triangle and projecting that same percentage above the upper trendline.
Please feel free to offer your criticisms and observations. This is not financial advice.

Gold long: Completion of Cycle degree Wave 4Hello, in this video, I go through Gold Elliott Wave structure on a cycle level (again) before zooming in on the latest 5-waves structure that is Cycle level wave 4. I talk about using existing broken trendlines and how that allows me to determine the strength of a move when there are false breakouts, whether to the upside or the downside.
Lastly, I discuss on how to trade this on the short-term using lower timeframe and price action. Most importantly, where to set the stop and the rationale for it.
Good luck!

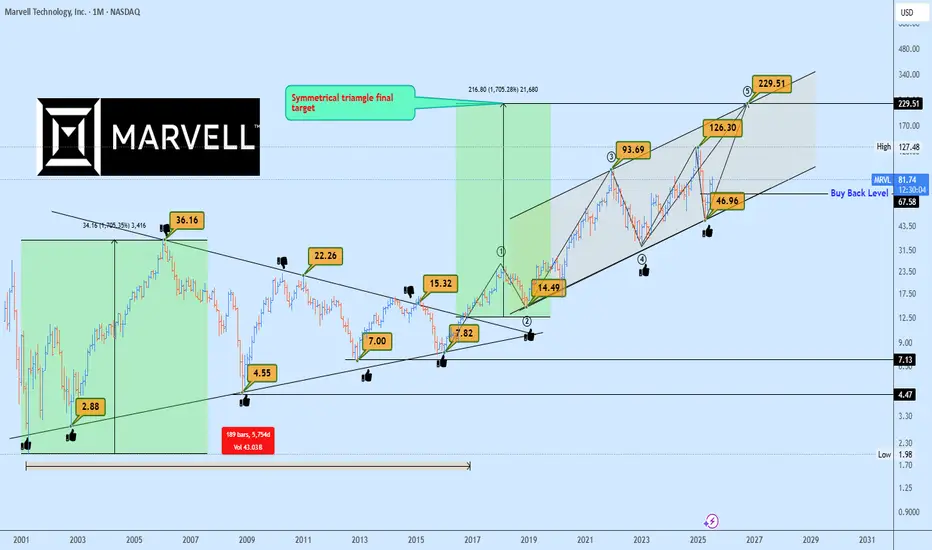
MRVL Massive 15-Years Symmetrical Breakout Targets AheadMarvell Technology (MRVL) has just completed a monumental breakout from a 15-years symmetrical triangle, a rare and powerful long-term accumulation structure. This type of macro consolidation typically precedes a major directional expansion, and in this case, the breakout confirmed bullish continuation.
Currently, MRVL is forming a rising channel structure, with price bouncing cleanly from the lower boundary confirming demand and the continuation phase of the macro move.
The 1:1 projection from the symmetrical triangle gives us a clear target trajectory, with the final leg potentially extending to $229, aligning perfectly with the upper boundary of the rising channel.
In the short to mid-term, the ideal buyback opportunity rests near $67.50, should the market retest previous breakout support or the lower boundary of the channel once more. This zone offers asymmetric risk-to-reward potential for long-term investors and swing traders alike.
Key Targets
📈 $67.50 – Buyback Opportunity Zone
📈 $229 – Rising Channel Top / 1:1 Expansion Target
A breakout this large is no coincidence, it’s backed by years of price compression and institutional positioning. Now is the time to watch closely.
📩 Drop your view in the comments and share your stock requests for quick analysis.
Only stock assets will be accepted under this post.
TSLA LONGQuite a simple set up. Confirmation is still needed on 3d, and daily. Bullish candles and volume is desperately needed for validation of symmetrical setup.
Volatility incoming. Break of ATH with strength leads to price discovery into $500+.

ADA Ready for PUMP or what ?The price on the 3d timeframe is within a triangle, which can create some uncertainty about which direction it will move. Here, we should wait to see which side of the triangle the price breaks out from. Remember, the trend is our friend.
Best regards CobraVanguard.💚

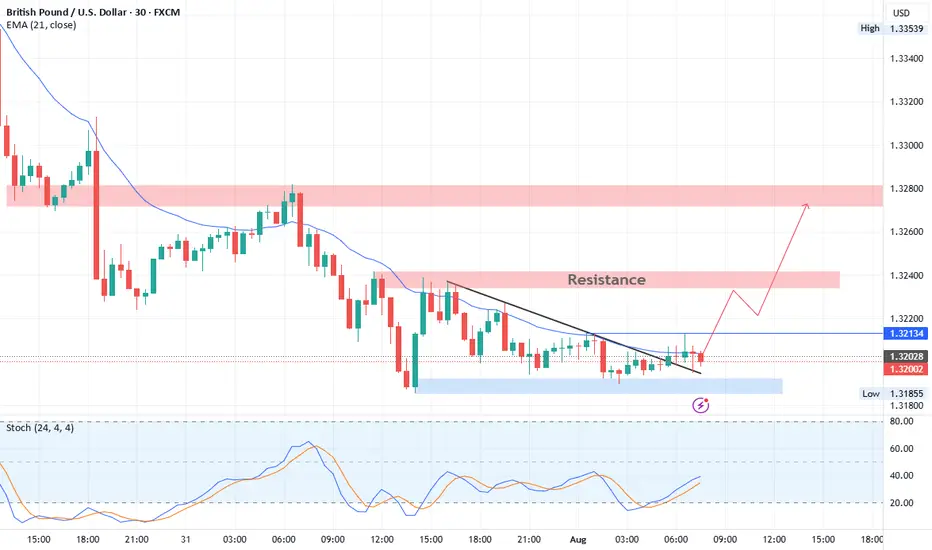
GBPUSD Technical BreakdownTrendline Breakout:
Price has decisively broken above a short-term descending trendline, signaling a potential shift in intraday momentum from bearish to bullish.
Support Zone (1.3185 – 1.3195):
This demand area has provided a strong base, with multiple successful rejections confirming buyer interest.
Resistance Levels:
Near-term resistance: 1.3213 (minor breakout level – watch for retest)
Key upside targets: 1.3240 followed by the major supply zone at 1.3275 – 1.3290
📈 Trade Outlook:
Bias: Bullish above 1.3213
Entry Idea: Look for bullish confirmation on a retest of 1.3213 as support
Targets:
TP1: 1.3240
TP2: 1.3275 – 1.3290
Invalidation: A sustained move below 1.3185 would invalidate the setup and reopen downside risk.
Gold can reach resistance area and then continue to fallHello traders, I want share with you my opinion about Gold. Over an extended period, the price action of Gold has been contained within a large descending triangle, a pattern characterized by a series of lower highs testing a descending resistance line and a relatively flat support base. The major seller zone around the 3415 resistance level has consistently capped upward rebounds, establishing a clear downward pressure on the asset. The most critical recent development has been a decisive breakdown, where the price broke below a key ascending trend line and, more importantly, below the horizontal support at 3310. This structural break has shifted the immediate market dynamics, turning the former support area of 3310 - 3320 into a new ceiling of resistance. The primary working hypothesis is a short scenario based on the principle of a breakdown and retest. It is anticipated that the price will attempt a corrective rally back towards this new resistance area around 3310. A failure to reclaim this level, confirmed by a strong rejection, would validate the breakdown and signal the continuation of the larger downward trend. Therefore, the tp for this next bearish leg is logically placed at the 3240 level. This target represents a significant area of potential support and a measured objective following the resolution of the recent consolidation. Please share this idea with your friends and click Boost 🚀
Disclaimer: As part of ThinkMarkets’ Influencer Program, I am sponsored to share and publish their charts in my analysis.

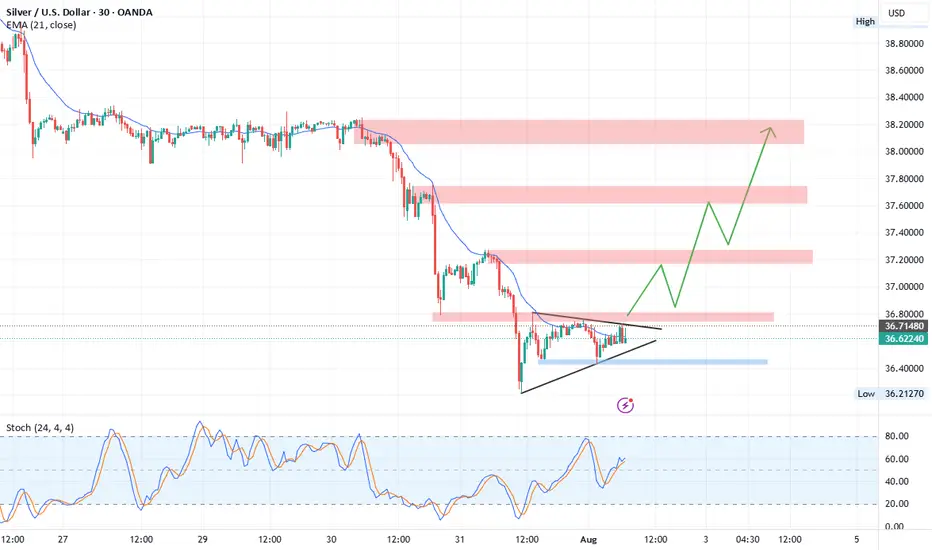
XAGUSD Technical Outlook (Silver/USD)Currently, Silver is trading inside a symmetrical triangle formation , signaling a potential breakout.
Upside Scenario:
A breakout above 36.80 resistance may trigger strong bullish momentum. The next target zone lies at 37.18 – 37.30, which is a relatively weak resistance and could potentially form a Head and Shoulders pattern . If momentum continues, Silver could extend gains toward 37.75 and 38.00 resistance levels.
Downside Scenario:
If the triangle breaks to the downside, we may see a short corrective move toward 3 6.25 – 36.20 support zone before any possible rebound.
Overall, the chart structure currently favors an upside breakout with continuation toward higher resistance zones.
OGDC Breakout?On a daily timeframe, OGDC has given breakout of a triangle pattern. This will open up doors for it to move towards its all-time high i.e. ~290 region.
This is my personal opinion, not a buy / sell call.
All other indicators e.g. RSI, Stoch and MACD are bullish as well.

Ascending Triangle busted- Bajaj finance 📉 Bajaj Finance Breakdown Alert 🚨
Ascending Triangle busted!
Bearish RSI Divergence + Trendline Break = Trouble brewing.
High volume node - ₹920 could cap any retest.
Next support zone?
👀 ₹840–₹800 range looks like the battleground!

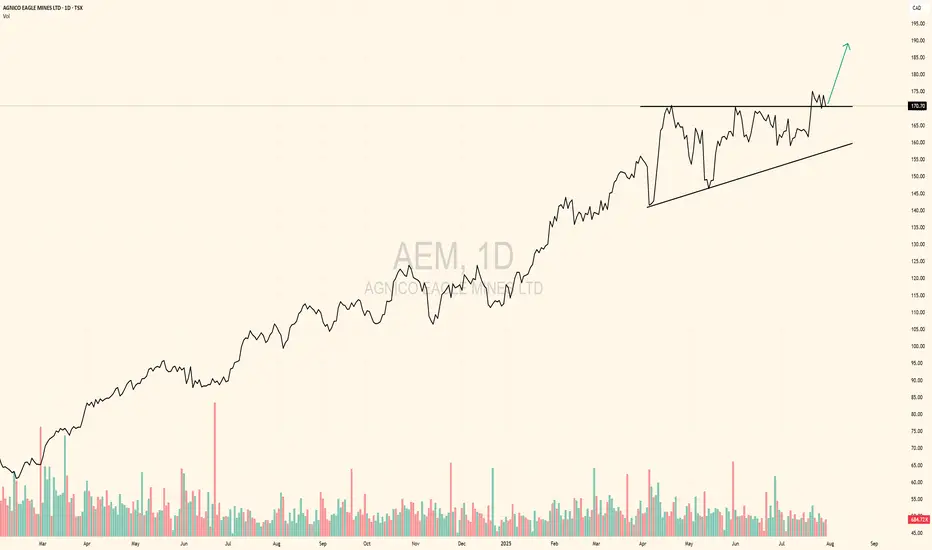
Lettuce hands will buy back at higher pricesAs the market capitulated on gold miners after FOMC, amazing earnings came out after the market closed.
Those sellers will fomo back in at higher prices.
Ascending triangle breakout to commence.
Intel: Still Not Cheap Enough?Intel has been falling for years, but some traders may think it’s still not cheap enough.
The first pattern on today’s chart is the series of higher lows since April, combined with lower highs since February. That converging range is a potential consolidation pattern.
Second, the chipmaker broke that range by gapping lower on Friday following a weak quarterly report.
Third, traders may eye $17.67 as the next important level. That April low was also the lowest price since August 2010.
Fourth, the 50-day simple moving average (SMA) inched toward the 200-day SMA this month but failed to cross above it. Is a longer-term bearish trend in effect?
Next, the 8-day exponential moving average (EMA) is below the 21-day EMA and MACD is falling. Both of those signals may be consistent with bearishness in the short term.
Finally, INTC is an active underlier in the options market. (Its average daily volume of about 350,000 contacts ranks 10th the S&P 500, according to TradeStation Data.) That could help traders take positions with calls and puts.
TradeStation has, for decades, advanced the trading industry, providing access to stocks, options and futures. If you're born to trade, we could be for you. See our Overview for more.
Past performance, whether actual or indicated by historical tests of strategies, is no guarantee of future performance or success. There is a possibility that you may sustain a loss equal to or greater than your entire investment regardless of which asset class you trade (equities, options or futures); therefore, you should not invest or risk money that you cannot afford to lose. Online trading is not suitable for all investors. View the document titled Characteristics and Risks of Standardized Options at www.TradeStation.com . Before trading any asset class, customers must read the relevant risk disclosure statements on www.TradeStation.com . System access and trade placement and execution may be delayed or fail due to market volatility and volume, quote delays, system and software errors, Internet traffic, outages and other factors.
Securities and futures trading is offered to self-directed customers by TradeStation Securities, Inc., a broker-dealer registered with the Securities and Exchange Commission and a futures commission merchant licensed with the Commodity Futures Trading Commission). TradeStation Securities is a member of the Financial Industry Regulatory Authority, the National Futures Association, and a number of exchanges.
Options trading is not suitable for all investors. Your TradeStation Securities’ account application to trade options will be considered and approved or disapproved based on all relevant factors, including your trading experience. See www.TradeStation.com . Visit www.TradeStation.com for full details on the costs and fees associated with options.
Margin trading involves risks, and it is important that you fully understand those risks before trading on margin. The Margin Disclosure Statement outlines many of those risks, including that you can lose more funds than you deposit in your margin account; your brokerage firm can force the sale of securities in your account; your brokerage firm can sell your securities without contacting you; and you are not entitled to an extension of time on a margin call. Review the Margin Disclosure Statement at www.TradeStation.com .
TradeStation Securities, Inc. and TradeStation Technologies, Inc. are each wholly owned subsidiaries of TradeStation Group, Inc., both operating, and providing products and services, under the TradeStation brand and trademark. When applying for, or purchasing, accounts, subscriptions, products and services, it is important that you know which company you will be dealing with. Visit www.TradeStation.com for further important information explaining what this means.
