FORM / USDT Long Setup – Major Breakout Alert!🚀 FORM Breakout Alert – 50% Potential Incoming?! 👀🔥
Hey Traders! If you're all about high-conviction plays and real alpha, smash that 👍 and tap Follow for more setups that actually deliver! 💹💯
FORM has officially broken out of a massive symmetrical triangle on the 4H chart after weeks of tight consolidation. This is a classic technical setup that often leads to explosive moves, and the market is starting to pay attention! ⚡📈
📍 Entry Zone: $2.12 – $2.16
✅ Entry around the current breakout zone to catch early momentum.
🎯 Targets:
• Target 1 → $2.60 (key horizontal resistance)
• Target 2 → $2.90 (major breakout extension zone)
• Target 3 → $3.10+ (blue-sky breakout level)
🛡 Stop Loss (SL): $2.06 (just below the lower trendline and support zone)
💥 Why this setup is exciting:
✅ Clean triangle breakout after multi-week compression
✅ Strong historical pattern — last breakout ran over +50%
✅ EMA alignment turning bullish
✅ Volume spike on breakout confirmation
✅ Market sentiment improving with higher lows on the chart
🔑 Pro Trading Tips:
Watch for a retest of the $2.15 breakout zone — it may offer a second-chance entry.
Scale out profits gradually at each target zone to lock in gains.
Always use proper position sizing and stick to your SL to manage risk.
📢 Final Thoughts:
This setup has the technicals lined up for a potential trend expansion. If momentum continues and we see a confirmed retest, NASDAQ:FORM could deliver a textbook bullish move. Don’t ignore the opportunity — but trade smart!
💬 What’s your game plan for NASDAQ:FORM ? Share your targets, strategies, and thoughts below — let’s learn and win together! 👇👇👇
Triangle

Chat analysis for WAL/USDTCurrent Price: $0.6162
EMA Levels:
EMA 20: 0.5855
EMA 50: 0.5762
EMA 100: 0.5504
EMA 200: 0.5133
➤ Price is currently above all EMAs, indicating short-to-mid-term bullish momentum.
RSI (14): 60.93
RSI is below the overbought zone (70), suggesting room for more upside before a potential pullback.
Key Support & Resistance Levels:
Immediate Resistance: Around $0.70
Next Strong Resistance: $0.90 – $1.00 (psychological level)
Immediate Support: $0.58 – aligns with EMA20/50
Major Support Zone: $0.50 – $0.52 (close to EMA100/200)
Potential Trading Insight (Not Financial Advice):
The price action shows a bullish structure with higher lows.
If it breaks and holds above $0.70, WAL could potentially rally toward $0.90 or higher.
Watch for a rejection at $0.70 — it could lead to a retest of the $0.58–$0.60 zone.

EURUSD BUY OPPORTUNITY ALERT!!Price just rebounded at the symmetrical triangle lower band support level and currently trade at 1.13628 a buy opportunity is envisaged from the current market price. Out target profit is 1.14002

BITCOIN → Correction to the risk zone. Rise or fall?BINANCE:BTCUSDT has updated its local maximum to 97,900, the market structure is quite positive, but still depends on the fundamental background and the behavior of the S&P 500.
The fundamental reasons that influenced the growth are the improvement in the tariff situation in the US and relations with China. Bitcoin's growth strengthened as the SP500 index rose, with which it has a fairly high correlation. In the second half of this week, the price broke out of the two-week consolidation, breaking through the resistance level of 95,500 and updating the local maximum. A correction is forming within the local upward channel.
95,000 is the liquidity and risk zone. That is, if the bulls hold their defense above 95K during the retest, Bitcoin will continue to grow in the short and medium term. Otherwise, a break of 95K could trigger a drop to 92K-88K.
Resistance levels: 97,425, 99,475
Support levels: 95,500, 92,000
All eyes are on the 95.5K support level, below which a huge liquidity pool has formed. Growth may be influenced by a retest (false breakout of support) and an imbalance of forces in the market. But we need to be careful, as the market will react to economic data. BUT! A return of prices to the selling zone (below 95000 - 95500) and the inability to continue growth could trigger a correction and liquidation.
Best regards, R. Linda!

Gold's Symmetrical Triangle Near Break – Support Test Imminent!Gold ( OANDA:XAUUSD ) moved as I expected in my previous post and attacked the Support zone($3,282-$3,245) and Support lines for the second time . The question is, can Gold break the Support zone($3,282-$3,245) and Support lines or not!?
Please stay with me .
Gold is moving between Support zone($3,282-$3,245) and Resistance zone($3,386-$3,357) again . In fact, it can be said that Gold has been moving in a range for the past 5-6 days .
From a Classical Technical Analysis perspective, Gold appears to be forming a Symmetrical Triangle Pattern. A break of either line could indicate the next direction for Gold, but since the Symmetrical Triangle Pattern is a Continuation Pattern , the lower line is more likely to break .
In terms of Elliott Wave Theory analysis , it seems that we still have to wait for the next five downwaves .
------------------------------------------
Today, important U.S. data — JOLTS Job Openings and CB Consumer Confidence — will be released.
Let’s quickly review their potential impact on Gold:
JOLTS Job Openings :
If the number comes lower than expected , it signals a weakening labor market, increasing the chances of a dovish Fed → Bullish for Gold .
If the number is stronger than expected , it indicates a robust labor market, pushing the Fed to stay hawkish → Bearish for Gold .
CB Consumer Confidence :
A drop in consumer confidence reflects economic worries , driving demand for safe-haven assets like Gold → Bullish .
A rise in consumer confidence shows economic strength, reducing the appeal of Gold → Bearish .
Historical Impact :
Both indices have caused strong intraday moves in Gold recently, especially if the figures surprise the market.
Summary :
Weak JOLTS and low Confidence → Gold bullish
Strong JOLTS and high Confidence → Gold bearish
Be prepared for high volatility during the releases. Always manage your risk carefully!
------------------------------------------
I expect Gold to attack the Support zone($3,282-$3,245) and Support lines for at least the third time , and if it breaks, the next target could be $3,223 .
Note: If Gold can move above $3,393, we can expect more pumps and maybe make a new All-Time High(ATH).
Gold Analyze ( XAUUSD ), 1-hour time frame.
Be sure to follow the updated ideas.
Do not forget to put a Stop loss for your positions (For every position you want to open).
Please follow your strategy; this is just my idea, and I will gladly see your ideas in this post.
Please do not forget the ✅' like '✅ button 🙏😊 & Share it with your friends; thanks, and Trade safe.

Ethereum's $2k Crossroads: Squeeze Up or Crash Down?Ethereum at a Crossroads: Eyeing $2,000 Amidst Short Squeeze Hopes, Crash Warnings, and Existential Questions
Ethereum (ETH), the bedrock of decentralized finance (DeFi) and the engine behind countless non-fungible tokens (NFTs), finds itself ensnared in a complex web of conflicting market signals and divergent analyst opinions. On one hand, recent price action shows resilience, with ETH powering through previous resistance levels and setting its sights on the psychologically significant $2,000 mark. This move is potentially bolstered by intriguing on-chain data, such as declining supply on major exchanges like Binance, sparking whispers of an impending short squeeze. Yet, casting a long shadow over this optimism are stark warnings: technical analysts point to rare, potentially bearish patterns forming, prominent trading firms question its fundamental value proposition compared to Bitcoin (BTC), highlighting its staggering year-to-date losses, and some even provocatively label it more akin to a "memecoin."
This cacophony of bullish hopes and bearish alerts places Ethereum at a critical juncture. Is the recent surge the beginning of a sustained recovery, fueled by tightening supply and renewed developer activity? Or is it merely a deceptive bounce within a larger downtrend, vulnerable to a potential crash as underlying weaknesses and unfavorable comparisons to Bitcoin take hold? Dissecting these opposing narratives is crucial for understanding the intense battleground Ethereum's price chart has become.
The Bullish Ascent: Powering Through Resistance, Eyeing $2,000
The immediate catalyst for renewed optimism stems from Ethereum's recent price performance. After a period of consolidation and, at times, significant downward pressure, ETH has demonstrated notable strength. Headlines proclaiming "Ethereum Price Powers Through Resistance — Eyes on $2,000?" capture this sentiment. Breaking through previously established resistance levels (potentially building on support found around the $1,800 mark) is a technically significant event. It suggests buyers are stepping in with enough conviction to overcome selling pressure that had previously capped advances.
Successfully reclaiming and holding levels above former resistance transforms these zones into potential new support floors, providing a base for further upward movement. The $2,000 level looms large, not just as a round number, but often as a key area of historical price interaction – a zone where significant buying or selling interest has previously materialized. A decisive break above $2,000 could inject further confidence into the market, potentially attracting momentum traders and reinforcing the bullish narrative.
The Binance Supply Drop and Short Squeeze Speculation
Adding intrigue to the bullish case is the observation of declining Ether supply on major exchanges, specifically Binance. Exchange supply is a closely watched metric. When the amount of ETH held on exchanges decreases, it generally implies that investors are withdrawing their coins to private wallets, often for longer-term holding ("HODLing") or for use within the DeFi ecosystem (staking, lending, etc.). This reduction in readily available supply on exchanges can, in theory, create a tighter market.
This dynamic fuels speculation about a potential "short squeeze." A short squeeze occurs when the price of an asset starts to rise rapidly, forcing traders who had bet against it (short sellers) to buy back the asset to close their positions and cut their losses. This forced buying adds further upward pressure on the price, creating a rapid, cascading effect. If a significant number of traders have shorted ETH, anticipating further price declines, a sustained move upwards coupled with shrinking exchange supply could create the conditions for such a squeeze, dramatically accelerating the price towards and potentially beyond the $2,000 target. While short squeezes are relatively rare and difficult to predict accurately, the declining supply on a major platform like Binance certainly adds a compelling element to the bullish thesis.
Underlying Strengths: The Long-Term Vision
Beyond short-term price action and supply dynamics, Ethereum's bulls point to its fundamental strengths. The successful transition to Proof-of-Stake (PoS) via "The Merge" was a monumental technical achievement, drastically reducing the network's energy consumption and changing its tokenomics by potentially making ETH a deflationary asset under certain conditions (where more ETH is "burned" via transaction fees than is issued as staking rewards). Ongoing scalability upgrades, often referred to under the umbrella of Ethereum 2.0 developments (like proto-danksharding via EIP-4844), aim to reduce transaction fees and increase throughput, making the network more efficient and attractive for developers and users.
Ethereum remains the dominant platform for smart contracts, DeFi applications, and NFT marketplaces. Its vast developer community, established network effects, and continuous innovation pipeline are often cited as core long-term value drivers that short-term price volatility cannot erase. For believers in Ethereum's vision, the current price levels, even after the recent bounce, might represent an opportunity to accumulate an asset with significant future potential.
The Bearish Counter-Narrative: Red Alerts and Worrying Comparisons
However, the optimism is heavily tempered by significant bearish signals and critiques. This serves as a stark warning. Technical analysis involves studying chart patterns and indicators to forecast future price movements. While the specific "rare pattern" isn't detailed, the emergence of such signals often causes significant concern among traders. Patterns like head-and-shoulders tops, descending triangles, or bearish divergences on key indicators can suggest that upward momentum is waning and a significant price decline could be imminent. Such technical warnings cannot be easily dismissed, especially when they align with other concerning factors.
The Stark Reality: Underperformance and the "Memecoin" Jab
Perhaps the most damaging critique comes from the direct comparison with Bitcoin and the assessment of Ethereum's recent performance. A large year-to-date drop is a brutal statistic, especially when Bitcoin, while also volatile, may have fared comparatively better during the same period (depending on the exact timeframe and BTC's own fluctuations).
Why the "memecoin" comparison? Memecoins are typically characterized by extreme volatility, price movements driven largely by social media hype and sentiment rather than clear fundamental value, and a lack of a distinct, widely accepted use case beyond speculation. While some calling Ethereum a memecoin is hyperbolic – given its vast ecosystem and utility – the critique likely stems from its recent high volatility and its struggle to maintain value relative to Bitcoin. The trading firm's assertion that Ether's "risk-reward is now unjustifiable compared to Bitcoin" encapsulates this view. They likely argue that Bitcoin's clearer narrative as a potential store of value or "digital gold," potentially bolstered by institutional adoption via ETFs, offers a more compelling investment case with potentially less downside risk compared to Ethereum, which faces ongoing scalability challenges, competition from other Layer 1 blockchains, and perhaps greater regulatory uncertainty regarding its status (security vs. commodity).
This underperformance raises difficult questions. If Ethereum is the backbone of Web3, why has its price struggled so much relative to its peers or even its own potential? Possible contributing factors include:
1. Capital Rotation: The excitement and capital inflows surrounding spot Bitcoin ETFs may have drawn investment away from Ethereum and other altcoins.
2. Regulatory Uncertainty: Ongoing debates, particularly in the US, about whether ETH should be classified as a security could be creating hesitancy among institutional investors.
3. Competition: Numerous alternative Layer 1 blockchains (Solana, Avalanche, etc.) are competing fiercely for developers and users, potentially fragmenting the market share Ethereum once dominated.
4. Post-Merge Narrative Shift: While technically successful, the immediate post-Merge price action was underwhelming for many, and the narrative focus may have shifted elsewhere.
Synthesizing the Dichotomy: A Market Divided
Ethereum's current situation is a textbook example of a market grappling with deeply conflicting data points and narratives.
• Bullish Signals: Price breaking resistance, targeting $2k, falling exchange supply, potential short squeeze, ongoing network development, strong ecosystem.
• Bearish Signals: Severe YTD underperformance, concerning technical patterns ("red alert"), critical comparisons to Bitcoin's risk/reward, being labeled "memecoin-like" by traders, regulatory overhang, Layer 1 competition.
This dichotomy creates significant uncertainty. Is the falling supply on Binance a sign of HODLer conviction paving the way for a short squeeze, or simply users moving assets to DeFi protocols, with little bearing on immediate price direction? Is the push towards $2,000 the start of a real trend reversal, or a bull trap set by bearish technical patterns? Is Ethereum's fundamental value being overlooked amidst short-term noise, or are the critiques about its risk/reward profile relative to Bitcoin valid warnings?
Investor Sentiment and Key Factors to Watch
This environment fosters polarized investor sentiment. Optimists see a buying opportunity, focusing on the recent strength and long-term potential. Pessimists see confirmation of underlying weakness and prepare for further declines. The path forward will likely be determined by several key factors:
1. Bitcoin's Trajectory: As the market leader, Bitcoin's price action heavily influences the broader crypto market, including Ethereum. Continued strength in BTC could provide a tailwind for ETH.
2. Technical Levels: Whether ETH can decisively breach and hold $2,000, or if it gets rejected, will be a critical short-term indicator. Equally important is whether current support levels hold during any pullbacks.
3. Exchange Flows & On-Chain Data: Continued monitoring of exchange supply, staking activity, and transaction volumes will provide clues about investor behavior.
4. Regulatory Developments: Any clarification on Ethereum's regulatory status, particularly in the US, could significantly impact sentiment.
5. Macroeconomic Environment: Broader market risk appetite, influenced by inflation, interest rates, and economic growth prospects, will continue to play a role.
Conclusion: Navigating Ethereum's Uncertain Path
Ethereum stands at a precarious crossroads. The recent climb towards $2,000, supported by encouraging signs like falling exchange supply, offers a glimmer of hope for bulls anticipating a recovery and perhaps even a short squeeze. However, this optimism is aggressively challenged by alarming technical warnings, significant underperformance compared to market expectations and Bitcoin, and pointed critiques questioning its current investment viability.
The "memecoin" comparison, while harsh, reflects a genuine frustration and concern among some market observers about ETH's volatility and perceived lack of decisive direction relative to the "digital gold" narrative solidifying around Bitcoin. The formation of rare bearish patterns adds a layer of technical urgency to these concerns.
Ultimately, the market remains deeply divided on Ethereum's immediate future. The battle between the potential for a supply-driven squeeze towards $2,000 and the risk of a pattern-induced crash is palpable. Investors must weigh the platform's undeniable long-term technological significance and ecosystem strength against the immediate headwinds of poor recent performance, regulatory ambiguity, and concerning technical signals. The coming weeks are likely to be crucial in determining whether Ethereum can overcome the prevailing skepticism and validate the recent bullish momentum, or if the bears will regain control, confirming the warnings of a continued downturn. The price action around the $2,000 level will be a key battleground in this ongoing struggle.
Disclaimer: The information presented in this article is for informational and educational purposes only. It is based on the analysis of the provided headlines and general market knowledge. It does not constitute financial advice. Investing in cryptocurrencies involves significant risk, including the potential loss of principal. Readers should conduct their own thorough research and consult with a qualified financial advisor before making any investment decisions.

GOLD → Correction before NFP. What are the chances of a decline?FX:XAUUSD strengthens amid dollar correction. The market is correcting ahead of NonFarm Payrolls, trying to accumulate potential before high volatility.
Gold recovers ahead of US employment report
On Friday, gold rebounded from a two-week low, recouping some of its losses ahead of the release of US labor market data (NFP), which could set the tone for prices going forward. Amid optimism over trade talks and a strong dollar, gold ended its worst week in two months, but geopolitical tensions and a potentially weak jobs report could boost demand for safe-haven assets again.
The correction in the dollar gives gold a small chance to strengthen. However, fundamentally, the overall trend has already set the tone and gold may continue to fall.
Resistance levels: 3268, 3285, 3295
Support levels: 3227, 3204
The correction may reach a local zone of interest (money pool) — liquidity above 3270, or the 0.7 Fibonacci zone, after which the price may continue its course along the new trend — down to 3193.
However, unpredictable and unexpected data could disrupt the structure and push the price up to 3320-3350.
Best regards, R. Linda!

CADJPY Wave Analysis – 1 May 2025- CADJPY broke the resistance zone
- Likely to rise to resistance level 106.00
CADJPY currency pair recently broke the resistance zone between the resistance level 104.00 and the resistance trendline of the Descending Triangle from February.
The breakout of this resistance zone continues the earlier sharp upward correction from the major long-term support level 102.00, which has been reversing the price from August.
CADJPY can be expected to rise to the next resistance level 106.00 (top of the previous minor correction 2 from March).

BITCOIN (BTCUSD): Strong Bullish Signs?! ₿
Bitcoin has probably completed the accumulation
stage after a completion of a strong bullish wave a week ago.
I see a breakout of a resistance line of a symmetrical triangle
on a daily time frame.
It is an important sign of strength of the buyers.
The price may continue going up now and reach 98.180 level.
❤️Please, support my work with like, thank you!❤️

MEME/USDT: BREAKOUT ALERT!!🚀 MEME Breakout Alert – 40%+ Potential Incoming?! 👀🔥
Hey Traders! If you're all about high-conviction plays and real alpha, smash that 👍 and tap Follow for more setups that actually deliver! 💹💯
🚀 AMEX:MEME / USDT Long Setup – Breakout Watch! 🚀
AMEX:MEME is squeezing inside a symmetrical triangle on the 1H chart and is now testing breakout levels! Get ready for a potential explosive move! 📈⚡
📊 Trade Setup:
✅ Entry: CMP and add more in dip
✅ Targets:
• Target 1 → $0.00260
• Target 2 → $0.00290
• Target 3 → $0.00302+
🛡 Stop Loss (SL): $0.00207 (below triangle support)
📌 Why this setup?
Tight consolidation near apex
Strong EMA support
Previous breakout gave ~40% move!
⚠️ Risk management is key! Wait for confirmation, and always stick to your SL.
💬 Share your thoughts below — bullish or cautious on MEME? Let’s discuss! 👇👇

GOLD → Trend reversal, downward distribution, and new targetsFX:XAUUSD breaks through 3270 and enters a distribution phase amid a rising dollar. We are most likely at the beginning of a trend reversal...
On Thursday, gold remains under pressure, trading at a two-week low, as the market reacts to Trump's statements about potential trade agreements with a number of countries, including China. Optimism surrounding the negotiations is boosting risk appetite, reducing interest in gold as a safe-haven asset. Even weak US GDP and inflation data failed to halt the rise in gold prices, as traders' attention is focused on the trade agenda and upcoming labour market statistics.
Gold is changing its trend due to the rise of the dollar and a shift in the fundamental background. A breakout of the local low could reinforce the decline. The first target is 3190. There is a possibility of a retest of the previously broken consolidation support at 3268 before the decline continues.
Resistance levels: 3245, 3270
Support levels: 3190, 3186, 3167
A breakout of the local low of 3221 could trigger a further decline. The first stop could be around 3190. From this level, a small correction or consolidation may follow before the decline continues.
I do not rule out the possibility of a retest of 3245-3270 before the decline continues.
Best regards, R. Linda!

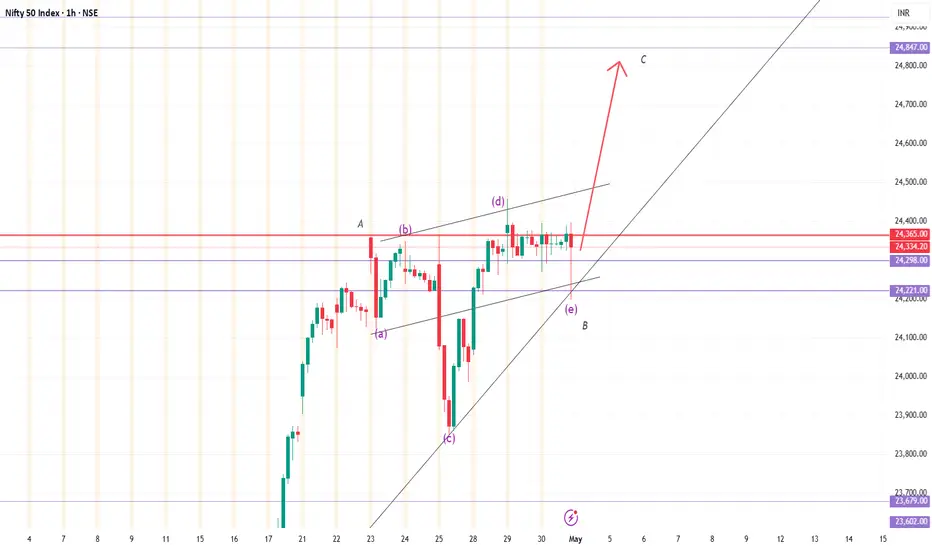
XAU/USD Wave Count UpdateLooks like wave (B) (red) forms in a triangle structure and now price has broken down below the end of wave (A) and soon will complete wave (C) before climbing back again to finish off wave ((5))

FARTCOIN → Moving into the realisation phase. A rally?BINANCE:FARTCOINUSDT.P has entered the buying zone, or the realization phase, after breaking through the resistance of the ascending triangle. The altcoin is within an upward trend.
Bitcoin continues to consolidate ahead of a possible rise. FARTCOIN has entered the buy zone at this time. The realization of Bitcoin could trigger continued growth in altcoins
FARTCOIN is entering the realization phase after consolidating within an uptrend and an ascending triangle. The coin looks quite positive overall, but a retest of 1.2100 may form before growth.
Resistance levels: 1.2933
Support levels: 1.0719, 1.0632
There is significant resistance ahead on D1, and a small correction to the nearest liquidity zone at 1.2097 may form. However, consolidation against 1.2933 is expected before a breakout and continued growth.
Best regards, R. Linda!

Neutral Triangle completion | Breakout AbvThe Neutral Triangle pattern.
- Either e-wave is still in making if down move continues.
- But Breakout upside looks imminent.. completing the neutral triangle pattern.
The upside breakout should retrace e-wave in lessor time.
BOME/USDT BullishMeme Coin Bome bullish, break the trendline, trend is change of character.
Let's see.
BINANCE:BOMEUSDT

GOLD → Consolidation. Traders are waiting for news...FX:XAUUSD remains in consolidation at 3370-3270. Traders are in no hurry to take any action, as there is a lot of important news ahead. Let's take a closer look at the situation...
On Wednesday, gold is trading lower, remaining in a sideways range as traders await the release of US GDP data for the first quarter. A sharp slowdown in growth is expected, and a possible contraction in the economy could increase bets on a Fed rate cut and support gold. Meanwhile, the dollar is holding steady amid tariff news and expectations for key employment and inflation data.
A retest of the range support is forming. The approach is quite sharp, and the pre-breakout potential has been exhausted. A false breakout of support could trigger an upward correction.
Support levels: 3270, 3245
Resistance levels: 3314, 3329, 3352
If the dollar continues to fall after the news, this could support gold and the price could continue to trade between 3370 and 3270. Unpredictable news could trigger a breakout and a fall.
Best regards, R. Linda!

NZDUSD Continues to Trade Under the Pressure of a Strong DollarHey Traders, in today's trading session we are monitoring NZDUSD for a selling opportunity around 0.59400 zone, NZDUSD is trading in a downtrend and currently is in a correction phase in which it is approaching the trend at 0.59400 support and resistance area.
Trade safe, Joe.

ETH/USDT 1H Chart: Breakout on the Horizon? Hey Ethereum traders! Let’s dive into this 1-hour ETH/USDT chart.
I didn’t manage to post in time, and ETH has made its move — unfortunately, it’s not the one we hoped for!
We had a classic triangle forming, with ETH consolidating between converging trendlines. The price was sitting around $1,803.65, teasing the daily high resistance at $1,842.89. I thought about a potential breakout toward the weekly high of $1,864.20, but instead, ETH broke below the triangle’s support line!
Now that the breakdown has happened, we’re likely heading toward the weekly low at $1,754.28, or even the breakdown target of $1,691.30.
Key Levels to Watch:
Resistance: $1,842.89 (daily high), $1,864.20 (weekly high)
Support: $1,780.47 (daily low), $1,754.28 (weekly low)
Breakdown Target: $1,691.30
The bears have taken control for now — where do you think ETH is headed next? Let’s discuss below!

USDCHF short: Sellers Getting Ready to DominateAfter a strong impulse from buyers, we saw exhaustion near the highs. Price retraced to a major support zone, but instead of a strong bounce, we got a tight, controlled accumulation range.
the higher timeframe, i.e 4H is in a strong downmove
What’s interesting is the structure within that box: the breakout attempts are weak, volatility is contracting, and there’s a noticeable lack of bullish follow-through—just coiling.
Smart money doesn’t chase—they trap. This triangle near key support is exactly where larger players hide intentions behind "indecision." But to me, the silence screams. This doesn’t look like preparation for a markup—it feels like a setup for distribution under the disguise of consolidation.
I’m anticipating a sellers' takeover.
Entry Idea: Short on breakdown of triangle structure or on a faker as shown on the chart
Stop: Above false breakout wick
Target: Near 0.80408 (based on prior imbalance + clean levels below)
Risk-reward speaks for itself.
Let’s see if the tape reveals what I believe it’s been hiding in plain sight.

NEAR/USDT 1H Chart: Breakout or Breakdown?Hey crypto traders! Let’s zoom into this 1-hour chart, because NEAR is serving up some serious action!
We’ve got a massive triangle forming, with the price squeezing tighter and tighter between converging trendlines. NEAR is currently dancing around $2.466, teasing a breakout after bouncing between resistance at $2.729 and support at $2.419. This pattern is a pressure cooker, and a big move is coming — will it soar to new highs or crash back down?
A bullish breakout above the upper trendline could propel NEAR past $2.610, potentially targeting $2.729 or higher! But if it fails to hold support at $2.540, we might see a dip toward $2.419 or even lower.
Key Levels to Watch:
Resistance: $2.610
Support: $2.540
Breakout Target: $2.729+
Breakdown Risk : $2.419
What’s your take — bullish surge or bearish pullback? Let’s hear your predictions below!

GOLD → Consolidation ahead of news. What to expect?FX:XAUUSD is consolidating. Focus on 3370 - 3269. Economic data is expected tomorrow, and gold is likely to trade within the consolidation range for several days.
Optimism about US trade talks with key partners boosted risk appetite and supported the dollar. The US Treasury Secretary reported progress with India, while President Trump softened his rhetoric on China, which also strengthened the dollar. At the same time, traders took a wait-and-see stance ahead of the release of US GDP data for the first quarter. If the figures turn out to be weak, gold could rise sharply as a safe-haven asset. Thus, the gold market remains sensitive to trade news and macro data, especially against the backdrop of rebalancing at the end of April.
At the moment, as part of the current momentum and correction, I expect prices to recover from the 0.5 - 0.7 Fibonacci zone. Gold may test 3323-3325 before resuming its correction within the consolidation.
Resistance levels: 3323, 3352, 3370
Support levels: 3290, 3270
Traders are waiting for a resolution in the tariff dispute as well as economic data due tomorrow. However, while the price is consolidating, I expect a rebound from support. BUT! If the price continues to squeeze towards any boundary, with priority to support, then the chances of a breakout from the consolidation base may increase.
Best regards, R. Linda!

NZDCHF → The global bearish trend may continueFX:NZDCHF has been within a local upward wedge pattern for a long time. A breakout of support could trigger a continuation of the downtrend.
After breaking through the wedge support, the currency pair is one step away from the start of the realization. The focus is on consolidation at 0.4982 - 0.4919. A breakout of support could trigger a decline in the currency pair amid a weakening NZD and a rising dollar index, which overall creates a negative backdrop for the pair.
A retest of the previously broken boundary of the figure or resistance at 0.4953 is possible before the decline continues, but a consolidation of the price below 0.4918 will be a good signal for the start of the movement.
Resistance levels: 0.4953, 0.4981
Support levels: 0.4918, 0.4872
Trend pressure plays an important role, as does the fact that the price is coming out of a wedge consolidation. The breakout is directed towards the main trend, and price consolidation below the key support will only confirm this.
Best regards, R. Linda!

BTC/USDT 1H Chart Analysis: Breakout Incoming?Hey traders! Let’s dive into this juicy BTCUSDT 1-hour chart. Bitcoin is teasing us with some serious action!
We’ve got a textbook symmetrical triangle pattern forming, with price consolidating tightly between converging trendlines. This is a classic setup for a big move — Bitcoin is coiling up like a spring, ready to explode!
The chart shows multiple phases of consolidation , with the latest triangle pushing BTC toward a critical decision point near the weekly high of $95,773.15 and the monthly high of $95,119.06.
The price is currently hovering around $95,000, testing resistance. A breakout above the upper trendline could send BTC soaring past $96,600, potentially targeting $97,200 or higher!
On the flip side, a rejection here might see it dip toward the daily low of $92,839.27 or even the lower trendline for support.
Key Levels to Watch:
Resistance: $95,773.15 (weekly high)
Support: $92,839.27 (daily low)
Breakout Target: $97,200+
Breakdown Target: $92,800
✉ What do you think — bullish breakout or bearish?
Drop your thoughts below!
