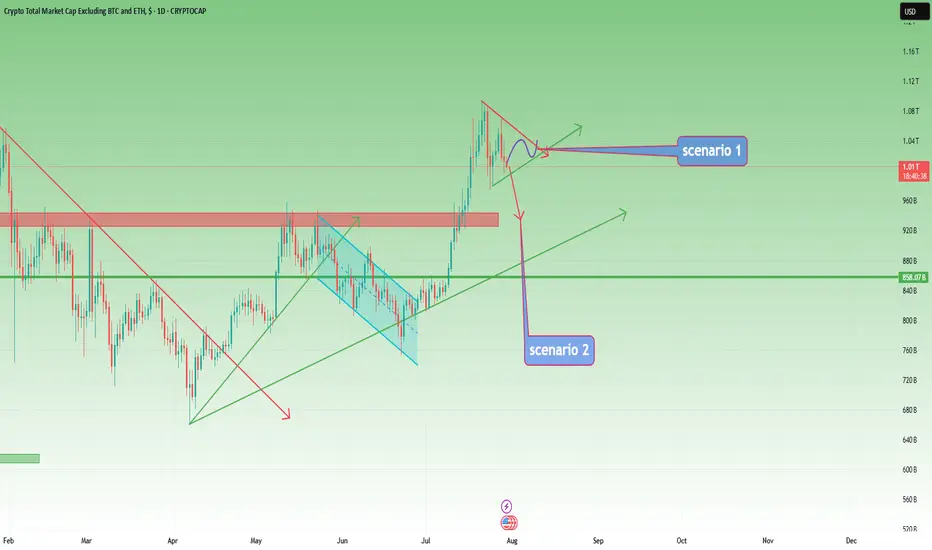
TOTAL3 – Still Bullish, But Waiting for Clarity
In my previous analysis on TOTAL3, I mentioned the high probability of a correction, but also noted that I didn’t expect the 925–940B zone to be reached.
And indeed, price reversed early — finding support around 975B before moving higher.
However, after a push up to 1.07T, the market has started to pull back again.
📊 Current Outlook – Two Scenarios I’m Watching:
Bullish Triangle:
Price may continue to consolidate into a symmetrical triangle, then resume the uptrend from there.
Deeper Pullback into Support:
The market could retest the 925–940B zone, a key support area, before bouncing back up.
⚠️ Bearish Reassessment?
Of course, if price breaks back below 925B and stays there, we’ll have to reconsider the bullish case.
But for now, the trend remains intact, and there’s no technical reason to panic.
📌 My Plan:
I already hold a bag of alts, and I’m not adding for now.
I’ll wait until the pattern becomes clearer — whether it’s a triangle breakout or a dip into support.
Until then, I’m sitting comfortably on what I already hold.
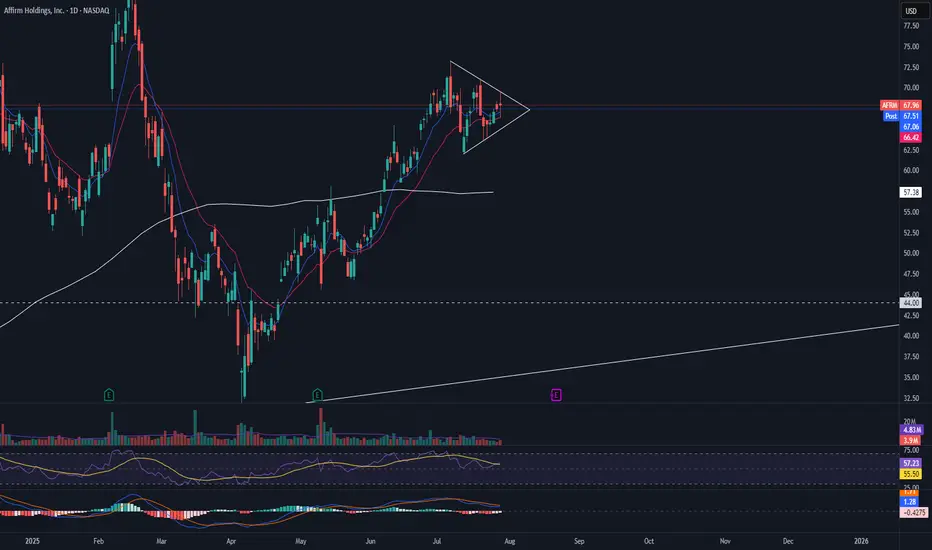
Triangle
AFRM pre earnings triangleAFRM is currently in a symmetrical triangle with RSI and MACD beginning to show the pattern may come to an end. I would want to see this triangle break with volume before entering a long position.
GOLD → Formation of a trading range. 3345?FX:XAUUSD confirms support for the local range. A false breakdown has formed and the price has returned to the buying zone. We are waiting for the bulls to take the initiative...
Gold is trying to recover after falling to $3302, remaining under pressure ahead of key events in the US: the publication of GDP data and the Fed's decision on interest rates. Support is provided by a pause in the dollar's growth, expectations of an extension of the US-China trade truce, and growing demand for safe-haven assets amid a surge in oil prices due to the threat of new sanctions against Russia. However, the sustainability of growth is in question: the dollar may strengthen thanks to optimism about the US economy and progress in negotiations.
A false breakdown of the support range is forming. Focus on 3310-3320. If the bulls keep the price above this zone, gold will have a chance to grow. BUT! If the price starts to contract and stick to 3310, we can expect the decline to continue...
Resistance levels: 3345, 3375
Support levels: 3320, 3310, 3287
The two-day movement has most likely exhausted its potential, or the market has decided to recover slightly due to the unpredictability factor. A false breakdown of support could trigger a pullback to the strong level of 3345, from which a rebound could form (either before growth or before the continuation of the decline; it is necessary to monitor the reaction and the market background...).
Best regards, R. Linda!

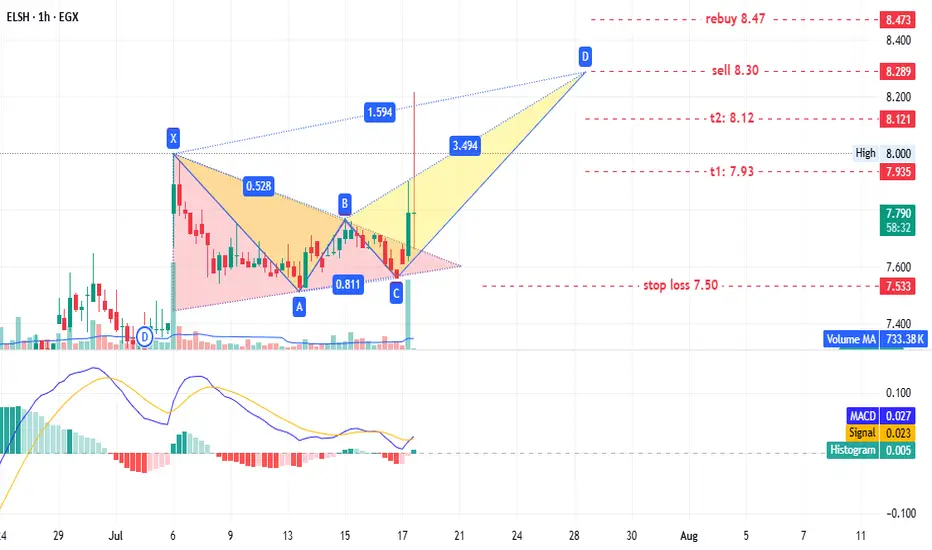
ELSH - old player EGX:ELSH timeframe: 1 hour.
A triangle pattern was identified, targeting 8.20. No new entry is recommended for shareholders, but if prices retest the triangle pattern at 7.65–7.60, it could present a low-risk entry opportunity.
This may also form a potential bearish Gartley pattern with targets:
- T1: 7.93
- T2: 8.12
- T3: 8.30 (sell point)
Stop loss: 7.50.
If prices continue rising and close above 8.47, consider rebuying what was sold at 8.30.
Disclaimer: This is not financial advice, only our analysis based on chart data. Consult your account manager before investing.
Good luck!
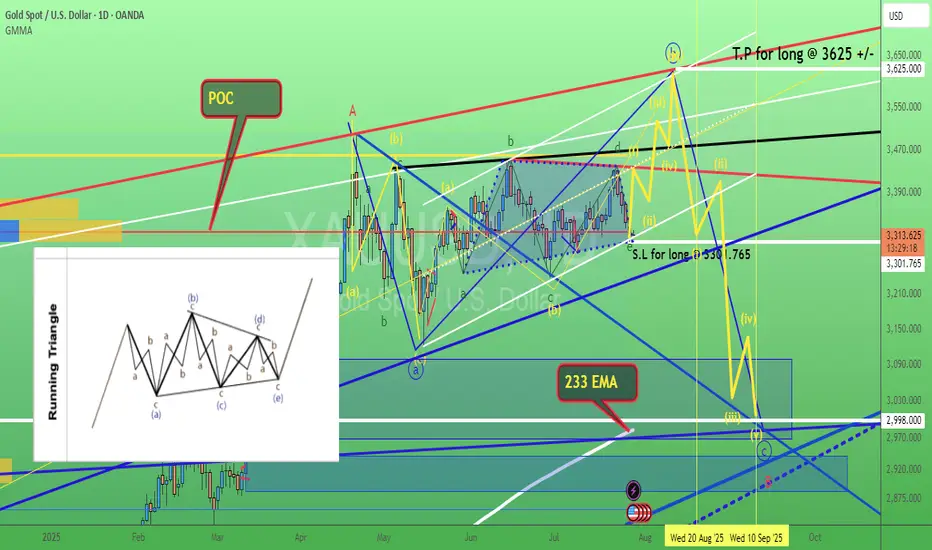
Gold. wave e (green) of triangle possible reached. 29/July/25XAUUSD based on speed of chart + confluence zone 1) Channel Support 2) POC of volume profile 3) Trendline support. Gold probably completed its wave e (green) of triangle.
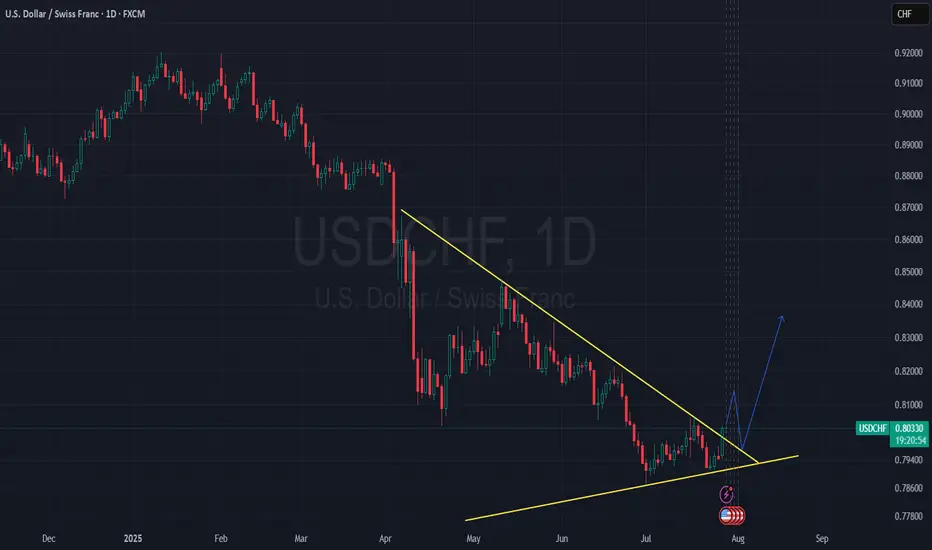
USD/CHF Just Broke Out of an Ascending Triangle - LONG📈 Price has just broken out of an ascending triangle pattern.
I’m now patiently waiting for a retest of the breakout zone to explore a potential long opportunity.
Let’s see if the market gives us a clean entry! 💹🧠
Wall Street's Billion-Dollar BNB Bet Fuels ATHBNB Ignites the Altcoin Market as Wall Street Giants Place Billion-Dollar Treasury Wagers
A perfect storm of technological advancement, surging institutional adoption, and bullish market sentiment has catapulted BNB into the stratosphere, setting the entire altcoin market alight. The native token of the sprawling BNB Chain ecosystem has not only shattered its previous all-time highs but is now the subject of unprecedented attention from major Wall Street players, who are lining up to pour billions into the digital asset. This confluence of factors has analysts and investors buzzing, with predictions of a continued explosive rally that could see BNB’s value enter uncharted territory in the coming months.
The price action has been nothing short of spectacular. In a powerful surge in late July 2025, BNB systematically broke through previous resistance levels, climbing to record peaks of over $860. This rally propelled its market capitalization to soar past $115 billion, a figure that eclipses that of established global giants like Nike. The move signaled more than just a momentary spike; it represented a fundamental repricing of the asset, driven by a narrative that has shifted from one of retail speculation to one of serious, long-term institutional conviction.
At the heart of this frenzy is a seismic shift in how traditional finance views BNB. The token is rapidly transitioning from a utility asset for a cryptocurrency exchange into a strategic reserve asset for corporate treasuries, following a path previously paved by Bitcoin. This new wave of "BNB Treasury" strategies is creating a structural demand floor and signaling a maturation of the asset class that few could have predicted just a few years ago.
The Institutional Stampede: A Billion-Dollar Bet on BNB
The most significant catalyst behind BNB’s recent ascent is the dramatic and public entry of institutional capital. A series of stunning announcements have revealed a coordinated and well-capitalized effort by publicly traded companies and investment firms to acquire substantial BNB holdings for their corporate treasuries.
Leading the charge is a landmark initiative by CEA Industries Inc., a Nasdaq-listed company, in partnership with the venture capital firm 10X Capital and with the backing of YZi Labs. The group announced an audacious plan to establish the world's largest publicly listed BNB treasury company. The strategy involves an initial $500 million private placement, comprised of $400 million in cash and $100 million in crypto. However, the full scope of the ambition is staggering: through the exercise of warrants, the total capital raised for the purpose of acquiring BNB could reach an astounding $1.25 billion.
This move is not being made in a vacuum. The deal has attracted a veritable who's who of institutional and crypto-native investors, with over 140 subscribers participating. The list includes heavyweights like Pantera Capital, GSR, Arrington Capital, and Blockchain.com, indicating widespread and sophisticated belief in the long-term value proposition of the BNB ecosystem. The leadership team for this new treasury venture further underscores its institutional credibility, featuring David Namdar, a co-founder of Galaxy Digital, and Russell Read, the former Chief Investment Officer of CalPERS, one of the largest public pension funds in the United States.
The CEA Industries and 10X Capital venture is the flagship of a growing armada of institutional interest. Before this headline-grabbing announcement, other companies had already signaled their bullish stance. Windtree Therapeutics, a biotech firm, disclosed it had secured $520 million through an equity line of credit to purchase BNB for its treasury. Similarly, the Nasdaq-listed Nano Labs expanded its own holdings to 128,000 BNB tokens, valued at over $100 million. Adding to the wave, Liminatus Pharma, another US-based biotech company, unveiled its own dedicated investment arm, the "American BNB Strategy," with the goal of deploying up to $500 million into BNB over time.
Collectively, these publicly announced plans represent more than $600 million in direct accumulation, with the potential for well over a billion dollars in buying pressure hitting the market. This institutional influx is fundamentally different from retail-driven rallies. These entities are not typically short-term traders; they are establishing long-term strategic positions. By allocating significant portions of their treasuries to BNB, they are effectively removing a large swath of the token's supply from the liquid market, creating a supply shock that can have a profound and lasting impact on price. This trend enhances BNB’s legitimacy, positioning it as a viable, institutional-grade reserve asset and providing a powerful new narrative for its continued growth. The market reaction to this news was immediate and explosive, not only for BNB but also for the companies involved. CEA Industries' stock (ticker: VAPE) skyrocketed over 600% in a single day, demonstrating the immense investor appetite for regulated, publicly-traded vehicles that offer exposure to the BNB ecosystem.
The Maxwell Upgrade: A High-Performance Engine for Growth
While the flood of institutional money has provided the high-octane fuel for BNB's rally, the engine driving its fundamental value has been meticulously upgraded. The recent "Maxwell" hard fork, implemented on the BNB Smart Chain (BSC) at the end of June 2025, represents a pivotal technological leap forward, dramatically enhancing the network's performance and scalability.
Named after the physicist James Clerk Maxwell, the upgrade was engineered to push the boundaries of blockchain efficiency. Its core achievement was the near-halving of the network's block time. Previously, BSC produced a new block approximately every 1.5 seconds; post-Maxwell, that interval has been slashed to a blistering 0.75 to 0.8 seconds. This move to sub-second block times effectively doubles the network's transaction speed and throughput.
For users, the impact is tangible and immediate. Transactions are confirmed faster, decentralized applications (dApps) feel more responsive, and the overall user experience is significantly smoother. Whether trading on a decentralized exchange (DEX), engaging with a DeFi lending protocol, or playing a blockchain-based game, the latency has been drastically reduced.
The Maxwell upgrade was not a simple tweak but a comprehensive overhaul powered by three key technical proposals:
1. BEP-524: This proposal was directly responsible for reducing the block interval, accelerating transaction confirmations and improving the responsiveness of dApps, making interactions in DeFi and GameFi feel closer to real-time.
2. BEP-563: With blocks being produced at twice the speed, the network's validators need to communicate and reach consensus much more quickly. This proposal enhanced the peer-to-peer messaging system between validators, strengthening the consensus process and reducing the risk of synchronization delays or missed blocks.
3. BEP-564: To further accelerate data synchronization across the network, this proposal introduced new message types that allow validator nodes to request and receive multiple blocks in a single, efficient message, ensuring the entire network remains stable and in sync despite the increased tempo.
The real-world impact of these technical improvements was almost immediate. In the month the Maxwell upgrade was rolled out, the 30-day decentralized exchange (DEX) volume on the BNB Chain soared to a record-breaking $166 billion. This figure surpassed the combined DEX volumes of major competitors like Ethereum and Solana, cementing BNB Chain's position as a leader in decentralized trading activity. PancakeSwap, the largest DEX on the chain, was a major beneficiary, handling the lion's share of this volume.
This surge in on-chain activity demonstrates a powerful feedback loop: technological enhancements attract more users and developers, which in turn drives up transaction volume and network utility, further increasing the value of the native BNB token. The Maxwell upgrade has solidified BNB Chain’s reputation as a high-performance, low-cost environment, making it an increasingly attractive platform for high-frequency traders, arbitrage bots, and a wide array of decentralized applications that demand both speed and reliability. The upgrade has also been credited with a significant increase in user engagement, with active addresses on the network surging 37% in the 30 days following its implementation, a growth rate that starkly outpaced competitors.
How High Can It Go? Analysts Eye $2,000 Cycle Top
With institutional floodgates opening and the network’s underlying technology firing on all cylinders, the question on every investor's mind is: how high can BNB price go? Market analysts are increasingly bullish, with many seeing the recent all-time highs as merely a stepping stone to much loftier valuations.
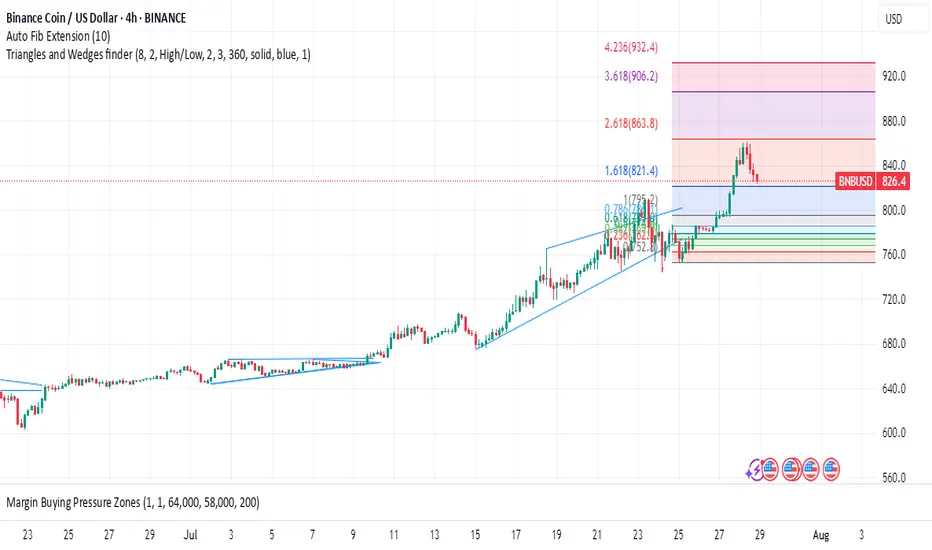
A price target of $1,000 is now widely considered a conservative short-to-medium-term goal. Some technical analysts, looking at the price charts, see a clear path to this milestone, potentially as early as August 2025. They point to BNB’s price action within a long-term ascending channel, with the upper trendline of this channel suggesting a target near the $1,000 mark. This level also aligns with key Fibonacci extension levels, adding technical weight to the prediction.
Beyond the four-figure mark, some of the most compelling forecasts come from analysts studying historical chart patterns, or "fractals." Market analyst BitBull, for instance, has drawn parallels between the current market structure and a pattern observed between 2018 and 2021. During that period, BNB’s price consolidated within a large ascending triangle pattern before breaking out and embarking on a monumental 920% rally. A similar multi-year ascending triangle has just seen a decisive breakout, suggesting history may be poised to repeat itself.
Based on this fractal analysis, BitBull projects a potential cycle top for BNB in the range of $1,800 to $2,000, which could be reached by early 2026. The analyst notes that even if the current rally only captures a fraction of the momentum seen in the previous cycle, a move past $1,000 by the end of the year seems highly plausible. A more aggressive interpretation of the ascending triangle breakout even suggests a speculative target as high as $3,900, though such a move would depend on ideal market conditions.
The derivatives market is also flashing bullish signals, reinforcing the positive sentiment. Open interest in BNB futures contracts—the total value of all active positions—has surged to an all-time high of over $1.7 billion. This indicates that a growing amount of capital is being deployed to bet on the future direction of BNB's price. Furthermore, funding rates have turned positive, meaning traders with long positions are willing to pay a premium to maintain their bullish bets, a sign of strong conviction in continued upward momentum.
This combination of fundamental drivers—soaring institutional demand and a supercharged network—along with bullish technical patterns and derivatives market activity, creates a powerful case for a sustained and significant appreciation in BNB's value. While the crypto market remains inherently volatile and no outcome is guaranteed, the confluence of positive factors currently surrounding BNB is undeniable. The token has set the altcoin market abuzz, not just by reaching new price peaks, but by fundamentally redefining its role in the digital asset landscape, transforming from a simple utility token into a cornerstone of Wall Street's burgeoning crypto treasury strategies. The journey into price discovery has just begun.
Ethereum Price Eyes $5K as Frenzy Fuels Supply ShockEthereum's Ascent: A Perfect Storm of Institutional Frenzy, Dwindling Supply, and Shifting Market Dominance
A palpable sense of anticipation is building in the cryptocurrency market, and its focal point is increasingly not on the reigning king, Bitcoin, but on its heir apparent, Ethereum. A confluence of powerful forces—ranging from bullish proclamations by Wall Street titans and an unprecedented institutional buying spree to compelling on-chain metrics and a shifting market structure—is painting a picture of a potential paradigm shift. The world's second-largest cryptocurrency is not just rallying; it appears to be on the precipice of a significant breakout, with some analysts eyeing targets that would shatter its previous all-time highs. This is not merely a story of price appreciation but a narrative of a "quiet takeover," where Ethereum's fundamental strengths and evolving role in the digital asset economy are finally being recognized by the world's largest financial players.
The chorus of bullish voices has grown louder in recent months, led by influential figures like billionaire investor and Galaxy Digital CEO, Mike Novogratz. A long-time crypto proponent, Novogratz has become increasingly vocal about his conviction that Ethereum is poised to outperform Bitcoin in the near future. He has repeatedly stated that Ethereum has a "really powerful narrative" and that market conditions are aligning for a significant upward move. Novogratz's thesis is built on a simple yet potent economic principle: a demand shock colliding with an already constrained supply. He predicts that Ethereum could outperform Bitcoin in the next three to six months, a bold statement given Bitcoin's own impressive performance.
The catalyst for this potential outperformance, according to Novogratz, is the flood of institutional capital now targeting Ethereum. This isn't just speculative interest; it's a strategic shift by major companies to hold ETH as a treasury reserve asset. This trend, he argues, is creating a supply crunch that will inevitably drive prices higher. The billionaire has identified the $4,000 mark as a critical psychological and technical level. In his view, a decisive break above this price point would launch Ethereum into a phase of "price discovery," where past resistance levels become irrelevant and the asset's value is determined by the sheer force of market demand. Novogratz believes Ethereum is "destined" to repeatedly challenge this $4,000 ceiling, suggesting that a breakout is a matter of when, not if.
This bullish sentiment from one of crypto's most respected voices is not occurring in a vacuum. It is underpinned by a dramatic and sustained price rally that has seen Ethereum's value surge by an astonishing 75% since late June. This powerful uptrend is not fueled by retail FOMO alone; rather, it is the result of a verifiable and accelerating wave of institutional adoption.
The primary engine behind this rally has been the launch and subsequent success of spot Ethereum Exchange-Traded Funds (ETFs). These regulated financial products have opened the floodgates for institutional investors to gain exposure to ETH without the complexities of direct custody. The inflows have been nothing short of staggering. In one remarkable instance on July 25th, Ethereum ETFs registered a net inflow of $452.8 million in a single day, with BlackRock's ETHA fund accounting for the lion's share at $440.1 million. This figure represents a dramatic escalation from the sub-$100 million daily inflows seen in early July, indicating a multifold jump in institutional buying pressure. In a single week, these ETFs absorbed a massive $2.18 billion, showcasing the voracious appetite of big money for a piece of the Ethereum network.
The impact of these ETF inflows is being magnified by a phenomenon known as a "supply shock." Analysts have noted that in a three-week period, ETFs purchased an amount of ETH equivalent to what the network would issue over 18 months. This aggressive absorption of the available supply from the open market, at a time when supply is already constrained due to staking and other factors, creates a powerful upward pressure on price.
The institutional frenzy is not limited to passive ETF investments. A new and significant trend has emerged: the rise of the "Ethereum treasury company." Mirroring the strategy pioneered by MicroStrategy with Bitcoin, corporations are now beginning to add substantial amounts of ETH to their balance sheets, viewing it as a strategic asset and a yield-bearing investment through staking.
Leading this charge is SharpLink Gaming, an online technology company that has made headlines with its aggressive accumulation of Ether. The company recently purchased an additional 77,210 ETH, worth approximately $295 million, in a single transaction. This purchase alone was more than the total net issuance of new Ether over the preceding 30 days. Following this acquisition, SharpLink's total holdings soared to over 438,000 ETH, valued at more than $1.69 billion. This makes SharpLink one of the largest corporate holders of Ethereum, second only to Bitmine Immersion Tech.
SharpLink's strategy is clear and ambitious. The company has filed to increase its stock sale from $1 billion to $6 billion, with the majority of the proceeds earmarked for further ETH purchases. The appointment of Joseph Chalom, a 20-year veteran of the world's largest asset manager, BlackRock, as its new co-CEO, lends further institutional credibility to its crypto-centric strategy. The company has also been vocal about its belief in the Ethereum network, with a recent social media post declaring, "Banks close on weekends. Ethereum runs 24/7." This sentiment captures the essence of why institutions are drawn to the programmable, always-on nature of the Ethereum blockchain.
Other companies, such as BitMine Immersion Technologies and the upcoming Ether Machine, which plans to list on Nasdaq, are also amassing significant ETH treasuries. BitMine has reported holdings of over 566,000 ETH, worth more than $2 billion. Collectively, these corporate players are creating a significant and sustained source of demand, locking up large portions of the circulating supply. This corporate buying spree is a powerful vote of confidence in Ethereum's long-term value proposition, extending far beyond its utility as a digital currency.
The torrent of institutional capital and corporate accumulation is vividly reflected in Ethereum's on-chain data. The network is buzzing with activity, providing a transparent window into the scale of the current buying pressure. One of the most telling metrics has been the explosion in on-chain volume. Over a recent three-week period, on-chain ETH volume surged by an incredible 288%, reaching a staggering $10.38 billion. This indicates a deep and liquid market with robust participation.
Even more compelling is the activity of large holders, colloquially known as "whales." Analysis of blockchain data reveals a sharp increase in the number of "mega whale" addresses—those holding 10,000 ETH or more. Since early July, over 170 new mega whale addresses have appeared on the network. This trend strongly suggests that the massive inflows from ETFs are not just being held by custodians but are being translated into direct, long-term accumulation by large, well-capitalized entities. These are typically "strong hands" that are less likely to sell in response to short-term market fluctuations, providing a stable base of support for the price.
Furthermore, the weekly volume of large transactions, defined as those exceeding $100,000, has hit its highest level since the peak of the 2021 bull run, totaling more than $100 billion in a single week. This explosion in whale activity, coinciding with Ethereum's price breakout into the high $3,000s, confirms that "smart money" is actively and aggressively positioning itself in the market. This is not the speculative froth of a retail-driven rally but the calculated maneuvering of institutional players.
Adding another layer to Ethereum's bullish case is a significant shift in the broader cryptocurrency market landscape: the steady decline of Bitcoin's dominance. Bitcoin dominance, which measures BTC's market capitalization as a percentage of the total crypto market cap, has been trending downwards. This indicates that capital is beginning to flow out of Bitcoin and into alternative cryptocurrencies, or "altcoins," with Ethereum being the primary beneficiary.
This phenomenon, often referred to as a "quiet takeover," signals growing confidence in Ethereum's relative strength. While Bitcoin has already set new all-time highs in the current cycle, Ethereum has yet to surpass its 2021 peak, suggesting it has more room to run. Analysts note that as Bitcoin's momentum has somewhat stalled, investors seeking higher returns are rotating into Ethereum, which offers a compelling combination of a strong narrative, institutional adoption, and significant upside potential.
The outperformance is stark when looking at recent returns. In the last 30 days, while Bitcoin posted respectable gains of around 11%, Ethereum surged by over 61%. This divergence is a classic sign of a market beginning to favor altcoins, a period often dubbed "altcoin season." Ethereum, as the leader of the altcoin pack, typically paves the way for broader rallies across the ecosystem. A rising Ethereum price and declining Bitcoin dominance create a fertile ground for other altcoins to flourish, with some analysts predicting double-digit returns for many smaller projects if Ethereum can successfully break the $4,000 barrier.
From a technical perspective, Ethereum's price chart is flashing multiple bullish signals, suggesting that the recent rally could be the start of a much larger move. Analysts are closely watching several key formations that have been developing over a long period. One of the most significant is a massive consolidation pattern. After a prolonged period of trading within a range, a breakout from such a pattern often leads to a powerful and sustained trend. Some analysts believe a breakout is imminent, with initial price targets set between $4,800 and $5,000.
Even more compelling is the challenge to a 3.7-year descending trendline. This long-term resistance has capped Ethereum's upward movements for years. A decisive weekly close above this trendline would be a major technical victory for the bulls, invalidating the long-term bearish structure and opening the door for a parabolic advance. Technical analysts often view the breach of such a long-standing trendline as a powerful signal of a major trend reversal and the beginning of a new bull market phase.
Should Ethereum successfully break out of its current consolidation and clear the $4,000 to $4,200 resistance zone, chart analysis suggests there is very little historical resistance until the $4,800 to $5,000 range. Some of the more bullish forecasts, looking at the ETH/BTC trading pair and other long-term models, even project potential targets between $7,300 and $10,000 in this market cycle.
Despite the overwhelmingly bullish picture, the path to new all-time highs is unlikely to be a straight line. The $4,000 level has proven to be a formidable barrier. Recently, Ethereum's price was firmly rejected near this psychological milestone, leading to a period of cooling volatility and raising concerns about a potential short-term selloff. The failure to break through has caused some buying pressure to weaken, and on-chain data has shown a temporary decrease in large whale transactions following the rejection.
This price action highlights the classic tug-of-war between buyers and sellers at a key resistance level. Some traders who have enjoyed the 75% run-up may be tempted to take profits, creating selling pressure. The Relative Strength Index (RSI), a momentum indicator, has also shown signs of being "overheated," suggesting that a period of consolidation or a minor correction could be healthy and necessary before the next leg up.
However, a key positive sign is that despite the rejection, buyers have not given up much ground. The price has continued to consolidate just below the resistance area, indicating that dips are being bought and that underlying demand remains strong. This type of price action, where an asset persistently hovers near a major resistance level without a significant pullback, is often a precursor to an eventual breakout.
Crucially, while retail sentiment and short-term trading metrics might show some hesitation, the institutional tide shows no sign of ebbing. Spot ETF inflows have remained consistently positive, providing a steady stream of buying pressure that counteracts short-term selling. This suggests that while there may be some turbulence in the immediate future, the larger, more powerful trend is being driven by long-term institutional accumulators who are less concerned with short-term price swings.
In conclusion, Ethereum finds itself at a historic crossroads, propelled by a perfect storm of fundamental and technical tailwinds. The narrative is no longer just about its technological promise as a world computer but about its emergence as a mature, institutional-grade asset. The vocal support of financial titans like Mike Novogratz, the verifiable flood of institutional capital through ETFs, and the strategic shift by corporations to hold ETH in their treasuries are creating a demand shock of unprecedented scale.
This is being met with a supply that is increasingly constrained, thanks to staking and the aggressive accumulation by these new, large players. On-chain data confirms this story, with volumes and whale activity reaching levels not seen since the last bull market peak. As Bitcoin's dominance wanes, Ethereum is stepping into the spotlight, ready to lead the next phase of the market cycle.
While the $4,000 resistance remains a key hurdle to overcome, and short-term volatility is to be expected, the underlying forces at play suggest a powerful current pulling Ethereum towards new horizons. The "quiet takeover" is becoming louder by the day. A breakout above $4,000 could unleash a wave of price discovery, potentially pushing Ethereum to $5,000 and beyond, and in the process, reshaping the very landscape of the digital asset ecosystem. The stage is set for Ethereum's ascent, and the world is watching.

Bitcoin Correction Maturing – Long Setup Brewing!Bitcoin ( BINANCE:BTCUSDT ) has fallen by more than -4% over the past day.
Let's take a look at the reasons for the decline.
One of the key reasons behind Bitcoin’s decline in the past 24 hours ( July 25 ) could be the reduced likelihood of Jerome Powell being replaced as Chair of the Federal Reserve.
In recent days, market participants were speculating that Donald Trump might replace Powell — a scenario that was considered bullish for risk assets like Bitcoin. However, recent reports of a meeting between Trump and Powell, and signs that Powell might not be dismissed, have weakened this fundamental narrative.
This meeting may signal a truce or reduced tension between Trump’s team and Powell , which could imply a continuation of current Fed policies. That’s bad news for Bitcoin, as it removes a potential psychological tailwind from the market and dampens speculative sentiment.
As a result:
Over $500 million in liquidations(Long Positions) occurred
Weak inflows into Bitcoin ETFs
A stronger U.S. Dollar Index ( TVC:DXY )
And declining Gold( OANDA:XAUUSD ) prices over the past two days
all added additional selling pressure on BTC. Now let's take a look at Bitcoin's conditions on the 4-hour time frame .
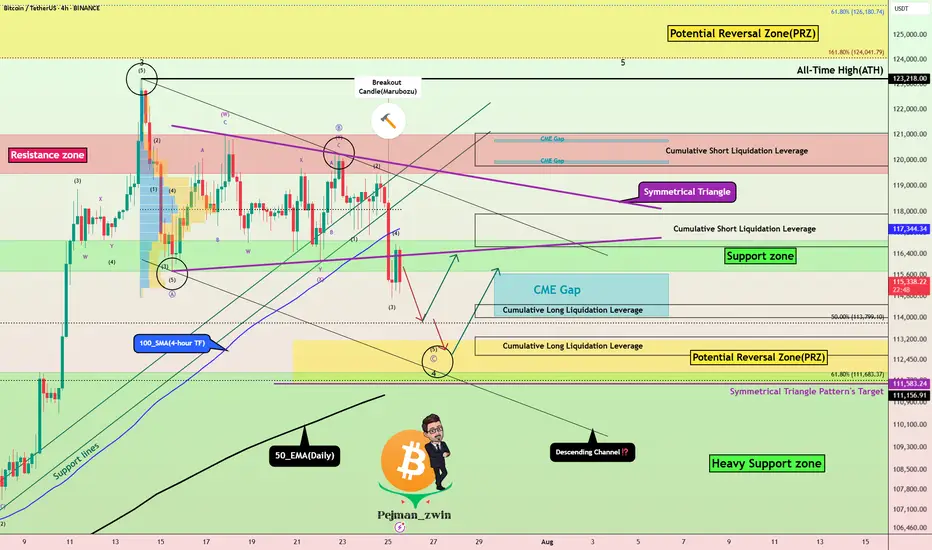
Bitcoin currently appears to have broken the Support zone($116,900-$115,730) , Support lines , 100_SMA(4-hour TF) , and the lower line of the Symmetrical Triangle Pattern with a bearish Marubozu candle .
Note : In general, trading was difficult when Bitcoin was inside a symmetrical triangle (about 10 days).
It also seems that the pullback to these zones has ended and Bitcoin is waiting for the next decline .
In terms of Elliott Wave theory , Bitcoin appears to be completing microwave 5 of microwave C of major wave 4 . There is a possibility that main wave 4 will create a descending channel and complete at the bottom of the descending channel (at Potential Reversal Zone(PRZ) ).
I expect Bitcoin to start rising again after completing the CME Gap($115,060-$114,947) from Cumulative Long Liquidation Leverage($114,480-$114,000) or Cumulative Long Liquidation Leverage($113,284-$112,603) near the PRZ and Heavy Support zone($111,980-$105,820) .
Cumulative Short Liquidation Leverage: $117,904-$116,665
Cumulative Short Liquidation Leverage: $121,046-$119,761
Do you think Bitcoin has entered a major correction, or does it still have a chance to create a new ATH?
Please respect each other's ideas and express them politely if you agree or disagree.
Bitcoin Analyze (BTCUSDT), 4-hour time frame.
Be sure to follow the updated ideas.
Do not forget to put a Stop loss for your positions (For every position you want to open).
Please follow your strategy and updates; this is just my Idea, and I will gladly see your ideas in this post.
Please do not forget the ✅' like '✅ button 🙏😊 & Share it with your friends; thanks, and Trade safe.
Gold. Bull Trap "triangle". 28/July/25XAUUSD, by checking gold latest speed of chart with its cycle. we might have a bull 'trap" triangle. A base for rallying to ATH again before a very deep pullback toward 233 Daily EMA which have not been "touched" for long time...

LUPINLupin Fut broke out of classic descending triangle pattern on daily charts with all 3 indicators suggesting strong buy.
Risk:Reward 1:3
Could b bough wih mentioned stoploss & targets.

BITCOIN UP!!Look really good if someone of you guys know about chart pattern.
Take a look in this chart.
Looking for some goods position this year. Chart Pattern ( Descending triangle ) looking for breakout. Im my opinion, you dont need a breakout here.

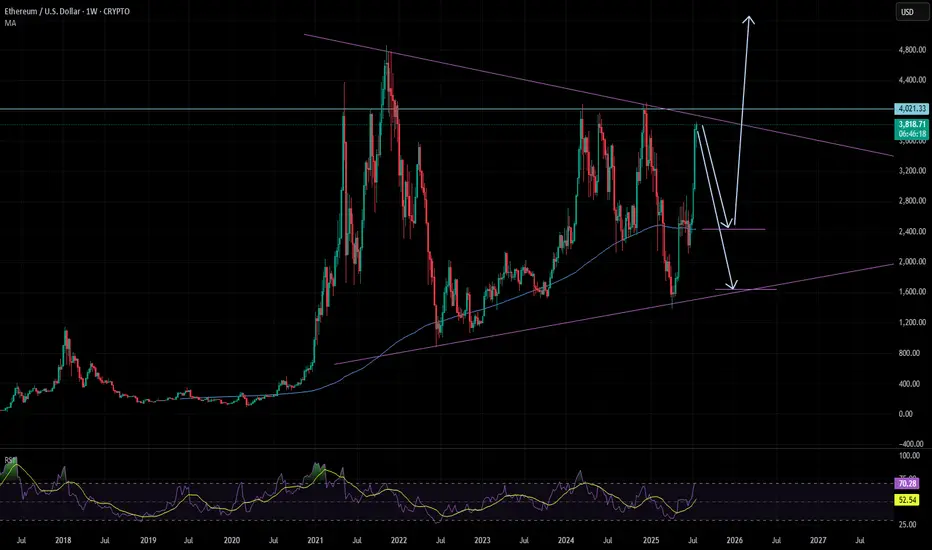
ETH is not going up soonETH made a beautiful bullrun from the trendline.
Now most people will be convinced we will break the 4K level and so straight up.
I'm not convinced, and that is because the last bullist candles are too extended. It's highly unlikely it will go straight up to + 4k from here.
Second we are in a massive triangle that has to play out first.
So what I believe will happen in the next months is that ETH will pullback to 2500 or even lower 1700. Allot of buyers that FOMO in now will be trapped and panic sell.
Then end on the year when QE has done and there is enough fuel to break out of the triangle. It will happen fast maybe arround nov / dec.
So don't fomo in wait
INJUSDT Daily Chart Analysis | Uptrend Brewing at Crucial LevelINJUSDT Daily Chart Analysis | Uptrend Brewing at Crucial Resistance
🔍 Let’s break down the INJ/USDT setup, examining its technical structure and mapping out key opportunities as it gears up for a decisive move.
⏳ Daily Overview
The INJUSDT pair is forming a solid bullish structure, supported by a clear ascending triangle pattern on the daily timeframe. Notably, the 3SMA (7, 25, 99) are crossing to the upside, signaling the early stage of a potential upward trend. This momentum is reinforced by the ascending triangle’s rising trendline, showing steady accumulation and higher lows.
🔺 Bullish Scenario:
Price is consolidating just below the critical resistance at $15.340—a key zone highlighted by multiple rejections in recent months. A confirmed breakout above this level, especially if backed by a surge in volume, would not only trigger a triangle breakout but also complete the weekly candle formation as a bullish hammer, strengthening the bullish case.
If this breakout sustains, short-term targets line up at $20.290, with the long-term roadmap pointing toward $33.970.
📊 Key Highlights:
- 3SMA (7, 25, 99) MA cross signals the beginning of an upward trend.
- Daily ascending triangle points to persistent bullish pressure.
- $15.340 remains a crucial resistance; price has tested and failed here twice before.
- Breakout confirmation (with volume) could ignite a rapid move to $20.290.
- Failure to break may result in another retest of the triangle’s trendline support.
🚨 Conclusion:
All eyes are on the $15.340 resistance. Wait for clear daily close and volume confirmation before entering. A successful breakout aligns with a bullish weekly hammer and could trigger the next phase higher. Beware of fakeouts, as rejection at resistance could send INJUSDT to retest lower trendline zones.
Stay sharp and plan your entries wisely!

XRP prediction🔍 XRP/USDT Weekly Analysis
📊 Technical Overview:
• XRP recently broke out of a long-term descending trendline with strong bullish momentum.
• Key support zone now rests around $2.09 – previous resistance turned support.
• Price is currently consolidating around $3.18 after a strong impulse move.
🎯 Targets:
• First target:
🔸 $4.00 expected around November 2025
• Second target:
🔸 $4.80 expected around March 2026
These targets align with Fibonacci arc projections and historical resistance levels.
📈 Trend Strength:
• Breakout backed by strong volume suggests momentum is sustainable.
• If price holds above $2.94, bullish continuation is likely.
⚠️ Risk Levels:
• Losing support at $2.09 could invalidate the bullish setup and push price back to the lower range.

JINDALSTELNSE:JINDALSTEL
Note :
1. One should go long with a Stop Loss, below the Trendline or the Previous Swing Low.
2. Risk :Reward ratio should be minimum 1:2.
3. Plan your trade as per the Money Management and Risk Appetite.
Disclaimer :
>You are responsible for your profits and loss.
>The idea shared here is purely for Educational purpose.
>Follow back, for more ideas and their notifications on your email.
>Support and Like incase the idea works for you.

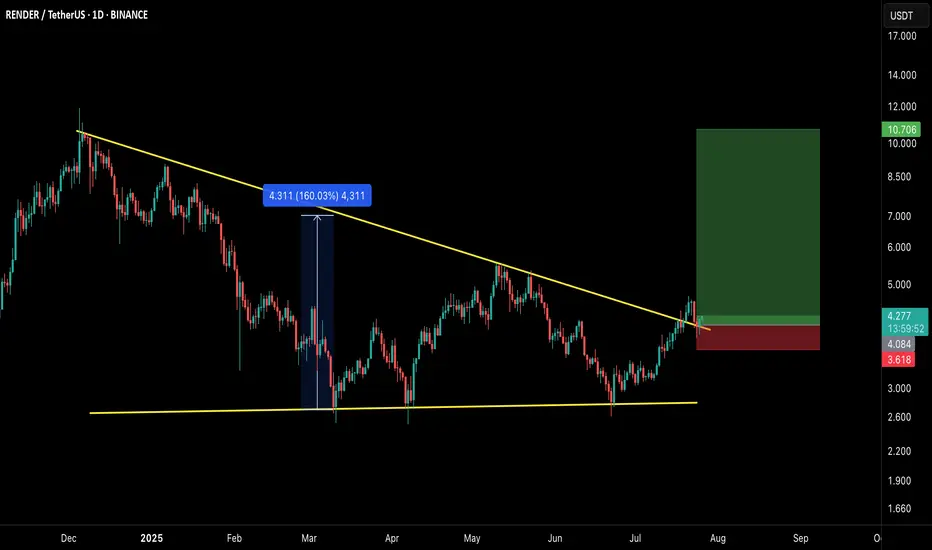
$RNDR/USDT – Breakout Setup Alert!RNDR has officially broken out of the long-standing descending trendline, confirming a bullish reversal structure. This breakout comes after a sustained consolidation phase and successful retest, indicating strength in buyer momentum.
🔍 Technical Breakdown:
Descending triangle breakout confirmed
Previous breakout from similar structure yielded a massive 160% rally
Currently retesting the breakout zone, providing a high R:R long entry opportunity
Clear invalidation point below the recent local support
🟢 LONG Setup:
Entry Zone: $4.00–$4.30
Stop Loss: $3.60 (below breakout retest & structure)
Targets:
TP1: $6.00
TP2: $8.00
TP3: $10.70+ (full breakout projection zone)
🧠 Strategy Insight:
This setup aligns with a broader bullish market structure across multiple altcoins. If momentum continues, this could mirror the prior explosive leg. Always manage risk accordingly.
⚠️ This is not financial advice. DYOR and use proper risk management.
💬 Let me know your thoughts or if you’re riding this wave!
6month log chart on xrpusd suggests crazy potential targetsThe bull pennant we are in shown here on the 6month time frame seems to have a symmetrical triangle for its flag. The breakout target for just the symmetrical triangle is in the $33 range. Factor in the pole of the flag and the potential target skyrockets to 1.2k. Definitely not financial advice and certainly no guarantee it will hit either target as it’s still up in the air if log chart targets reach their full target as reliably as linear chart patterns do. Even if it does hit these targets you can see the apex of the pennant in its current trendline trajectories doesn’t occur until 2026. The only way I see price remaining inside this triangle for that long is indeed if the SEC ripple case is extended through appeal and taken to the Supreme Court. Hopefully not but it isnt impossible. If this were to occur I would simply keep dollar cost average accumulating until it was to break out from the triangle which would give me more opportunity to take some profit at the first target but then also hold onto some of the asset in case it does indeed reach the full bullflag breakout somehow all the way up at 1.2k. Simply posting this hear so I can see how well price action chooses to follow this pattern over the next year or few. Once again *not financial advice*

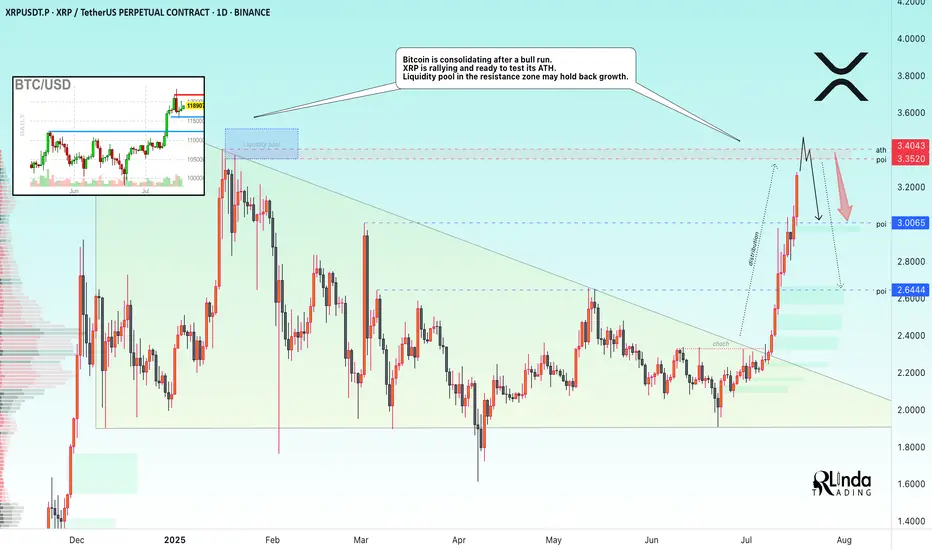
XRP → ATH retest. Reversal or continued growth?BINANCE:XRPUSDT.P is rallying and ready to test the resistance zone - ATH. Against this backdrop, Bitcoin is consolidating after a bull run. The liquidity pool may hold back growth.
Fundamentally, there is excitement across the entire cryptocurrency market. Altcoins are rallying after Bitcoin hit a new high and entered consolidation. The BTC.D index is declining, which generally provides a good opportunity for altcoins to grow. However, the index is approaching technical support, which may affect market sentiment overall...
As for XRP, there is a fairly strong liquidity pool ahead — the ATH resistance zone. The price is in a distribution phase after a change in character and a breakout of the downtrend resistance in the 2.33 zone. The momentum may exhaust its potential to break through the 3.35-3.34 zone, and growth may be halted for correction or reversal (in correlation with Bitcoin's dominance in the market).
Resistance levels: 3.35-3.40
Support levels: 3.0, 2.64
A breakout of resistance without the possibility of further growth, a return of the price below the level (i.e., inside the global flat) will confirm the fact of a false breakout of resistance, which may trigger a correction or even a reversal.
Best regards, R. Linda!
Gold. Could this be the final "shape" of triangle? 26/July/25XAUUSD. back to previous ideas that we possible having a contracting /symmetrical triangle pattern on gold chart..Probarly a "big surprise" on 31 July FED/FOMC meeting?

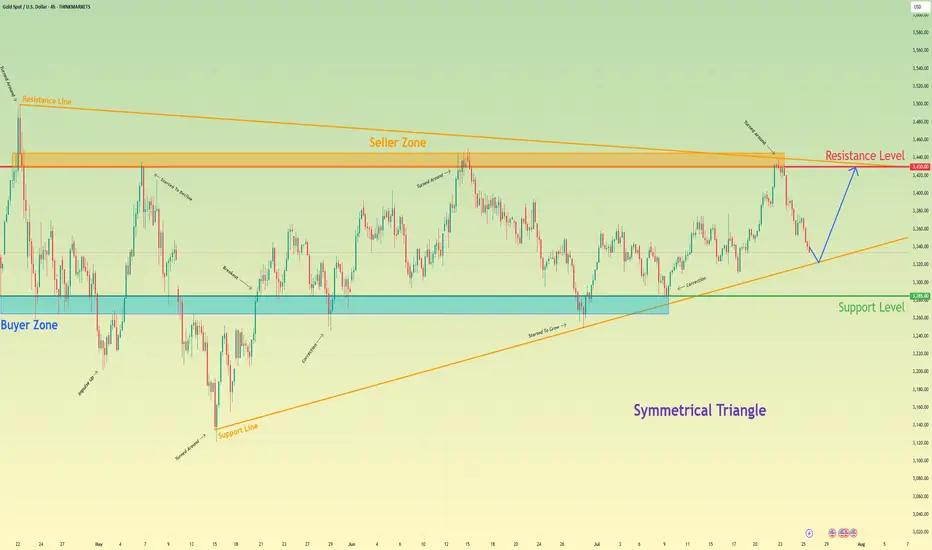
Gold will rebound from support line of triangle and rise to 3430Hello traders, I want share with you my opinion about Gold. Following a sequence of significant upward trends and the subsequent downward corrections that defined its range, gold has entered a broad market zone of consolidation. This battleground is clearly anchored by the historically significant buyer zone around 3285 and a formidable seller zone near 3430. Currently, the asset's price action is coiling and contracting within the confines of a large symmetrical triangle, a classic pattern that signifies a period of equilibrium and energy build-up before a potential high-volatility breakout. After a recent upward rebound was decisively rejected by the upper resistance line, the price is now in a corrective descent, heading towards the crucial ascending support line of the triangle. The primary working hypothesis is a long scenario, which is based on the expectation that this downward move will find strong buying interest on this key trendline, respecting the pattern's integrity. A confirmed and strong bounce from this level would signal another complete upward rotation within the triangle is underway. Therefore, the tp is logically and strategically set at the 3430 resistance level, as it not only aligns with the formation's upper boundary but also represents the major seller zone, a natural magnet for price on such a rebound. Please share this idea with your friends and click Boost 🚀
Disclaimer: As part of ThinkMarkets’ Influencer Program, I am sponsored to share and publish their charts in my analysis.
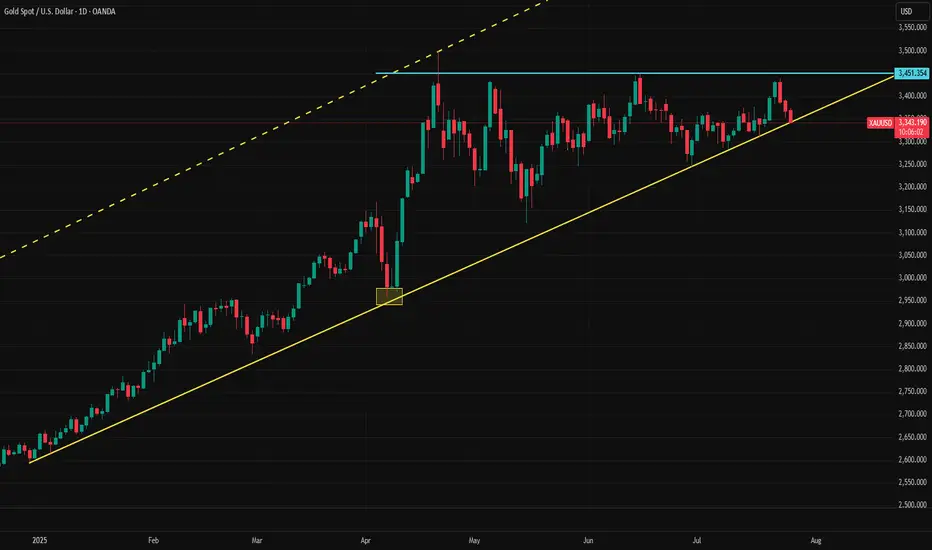
Gold Tests Year-to-Date TrendlineGold is getting a breather from recent newsflow and is now testing the trendline on the daily timeframe. The Japan deal, some positive developments in the EU–US negotiations, and yesterday’s Trump–Powell "sitcom" have helped ease concerns about the economy.
Although the trend began in December, when viewed from April, it clearly forms an ascending triangle pattern. Ascending triangles typically break to the upside, which could favor gold bulls. However, the lower support line is being tested very aggressively and has been challenged multiple times, which is not a good signal.
Today could be decisive, potentially leading to a downside break or an upward move that sets the tone for the weekly close. For gold traders, today and Monday could be key in determining the medium-term direction.
GBPAUD breakdown targets 2.00GBPAUD broke below key triangle support, confirming a bearish pattern with a target near 2.00. A failed retest strengthens the case for further downside. Bounces toward 2.06 may face selling pressure. Reward-to-risk remains attractive around 2.55x.
This content is not directed to residents of the EU or UK. Any opinions, news, research, analyses, prices or other information contained on this website is provided as general market commentary and does not constitute investment advice. ThinkMarkets will not accept liability for any loss or damage including, without limitation, to any loss of profit which may arise directly or indirectly from use of or reliance on such information.
