GOLD → Correction before continuing the rally to 3450FX:XAUUSD updates its local maximum to 3401.5 and enters a consolidation phase ahead of news. The dollar correction gives speculators a chance...
The price of gold is correcting from 3400. The reason is profit-taking ahead of Powell's speech at 12:30 GMT and waiting for clarity on US trade negotiations with the EU and Japan before August 1.
Gold remains sensitive to the progress of negotiations and the dynamics of the dollar, which is weakening amid political uncertainty, declining yields, and pressure on the Fed from Trump.
Technically, after exiting consolidation and retesting 3400, the price is entering a local consolidation phase.
Focus on key levels: 3401, 3382, 3375. A false breakdown of support could trigger a recovery phase.
Resistance levels: 3402, 3393
Support levels: 3382, 3375, 3362.75
The distribution phase has been halted by resistance, and the price has moved into a countertrend correction due to uncertainty. Markets are waiting for positive signals from the Fed. Local and global trends are bullish, which may support the price overall...
Best regards, R. Linda!
Triangle

Gold Bulls Loading Up – Our Short Squeeze Trigger is Set!🚨 Gold Bulls Loading Up – Our Short Squeeze Trigger is Set!
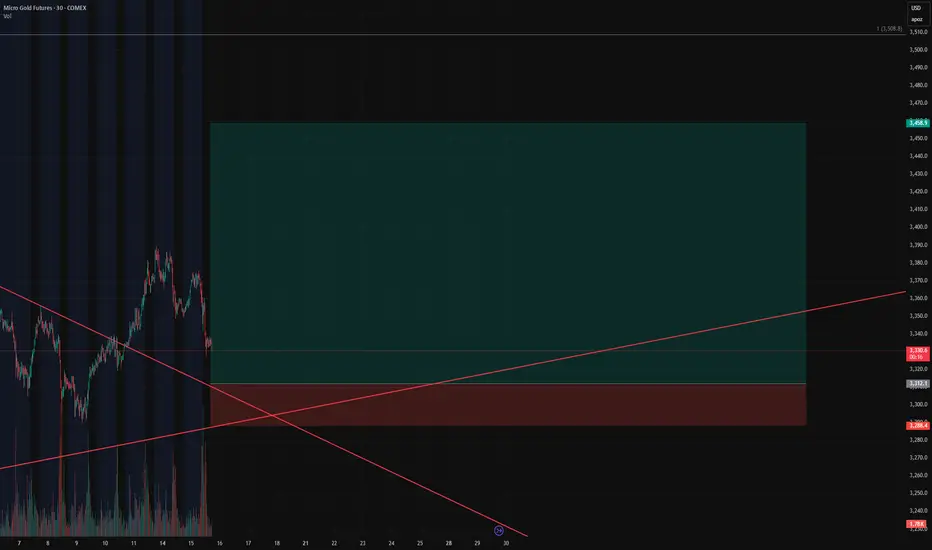
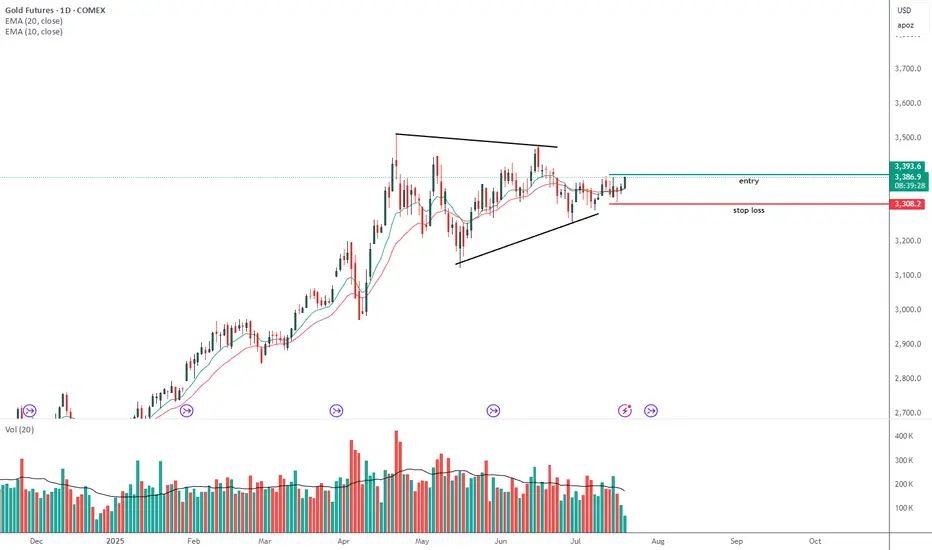
We’re flipping the script on COMEX_MINI:MGC1! After a prolonged downtrend and textbook wedge compression, our breakout long is LIVE – but not without trapping the late shorts first.
💥 Entry: $3,312.1
🛑 Stop: $3,288.4
🎯 Target: $3,458.9
🧮 Risk/Reward: 6.19
Price just bounced at the retest of the wedge apex, and volume is confirming the move. If this holds, we’re riding momentum all the way up – and letting short pressure fuel the breakout.
📈 Trendline breached.
⏳ Time compression converging.
⚠️ If you’re still short, watch your stops!
GOLD - Important Breakout !Hello Traders !
The Gold price formed an ascending triangle pattern.
Currently, The resistance level is broken!
So, I expect a bullish move🚀
_______________
TARGET: 3414🎯

PioneersA company specialized in the manufacturing of zero-gravity objects.
The price is approaching the purple support zone, where a partial entry could be considered while awaiting a bullish breakout of the blue resistance level.
If successful, the position can be increased.
For greater safety, one could wait for the breakout of the first light blue resistance level, where it may be possible to increase further.
Stop loss in case of a downward break of the purple support

Gold Wave Analysis – 21 July 2025
- Gold broke resistance daily Triangle
- Likely to rise to resistance level 3450.00
Gold recently broke the resistance zone between the resistance level 3370.00 (upper border of the narrow sideways price range inside which Gold has been trading from the end of June) and the resistance trendline of the daily Triangle from April.
The breakout of this resistance zone accelerated the active impulse wave 3, which is a part of the intermediate impulse wave (5) from May.
Given the clear daily uptrend, Gold can be expected to rise further to the next resistance level 3450.00 (top of the minor impulse wave 1 from the middle of June).

GOLD → Breakthrough accumulation. Correction before growthFX:XAUUSD has been strengthening since the session opened and is heading towards the 3374 zone of interest. The price has previously broken through the consolidation resistance and may test this boundary before moving further.
Gold is rising amid trade risks and dollar weakness. After falling to $3310, gold resumed its growth, seeking to break through the $3368 level. Support for prices was provided by uncertainty surrounding Trump's tariff policy and expectations for Fed Chairman Powell's speech. The US dollar weakened temporarily as investors sought refuge in gold amid trade disputes with the EU, political instability in Japan, and criticism of the Fed from the White House.
Technically, the price is in a realization phase after breaking out of consolidation, but it has encountered resistance at 3368, which could lead to a correction. The focus is on the 3350-3355 zone. If the bulls hold their ground above this zone, the market may return to the realization phase.
Resistance levels: 3368, 3374
Support levels: 3345, 3332
The market is bullish and feels support, especially against the backdrop of a weak dollar. Traders are watching Trump and Powell. If the latter decides to cut rates, for example tomorrow at 12:30 GMT, gold could rally...
Technically, gold could test 3350 before rising.
Best regards, R. Linda!

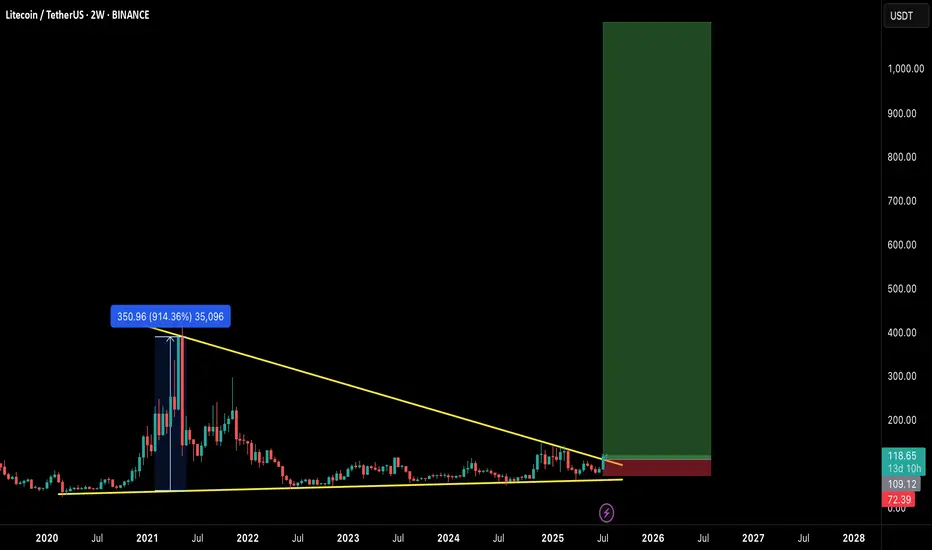
$LTC READY FOR EXPLOSION! THE COMEBACK OF THE OG?Litecoin has quietly formed one of the most massive macro structures in the market — a multi-year falling wedge on the 2-week timeframe, now breaking out with early confirmation.
This could be the start of a generational move, similar to the 2020 breakout. Let's break it down:
🧠 Technical Breakdown:
✅ Falling wedge forming since 2021 — 4 years of compression
✅ Volume and structure support breakout
✅ LTC already gave a 914% rally last time it broke a similar level
📏 Target zone extends above $900–$1000
🛒 Entry Zone:
Current Price: $118
🟢 Buy on breakout or dips near $105–$110 for safer entries
🎯 Target Zones:
TP1: $280
TP2: $400
TP3: $650
TP4: $950+
🛑 Stop-loss:
Breakdown below $72 (last higher low & wedge base)
⚖️ Risk-to-Reward:
High timeframe structure = High conviction play.
Potential R:R > 8x — Rare macro opportunities like this don’t come often.
🧩 Final Thoughts:
LTC may not be the flashiest alt anymore, but this setup is technically undeniable. If BTC enters full bull cycle, LTC could ride the wave explosively.
🔥 This could be a "buy and forget" macro play for 6–12 months.
💬 Let me know your thoughts in the comments & hit that ❤️ if you like macro setups like these!
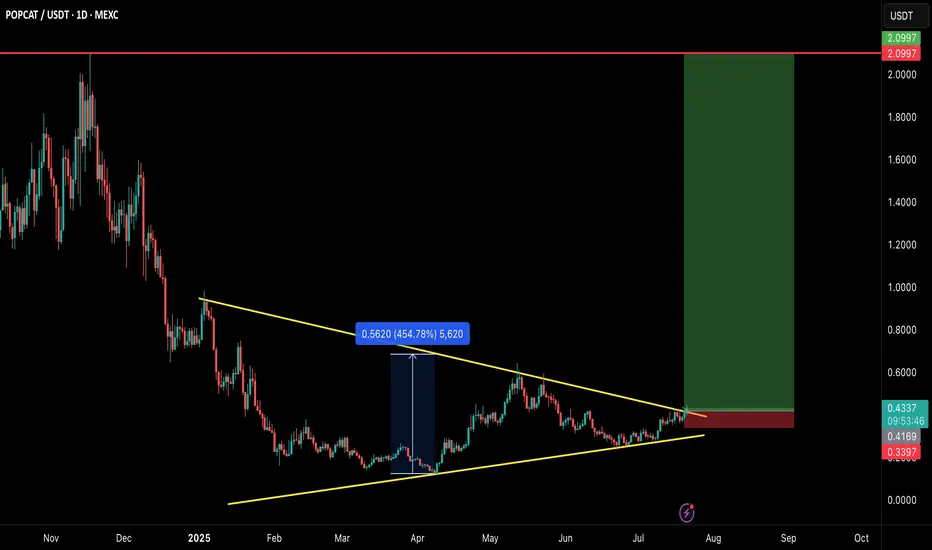
POPCAT/USDT – MEGA BREAKOUT INCOMING!POPCAT is breaking out of a large symmetrical triangle structure that has been developing for several months. This is a textbook bullish reversal setup with explosive potential — and the chart says it all! 👇
🧠 Technical Breakdown:
✅ Clean symmetrical triangle breakout on daily timeframe
🔥 Strong base formation followed by volume breakout
💹 Consolidated above trendline for weeks — breakout looks real
🛒 Entry Zone:
CMP ($0.43) or buy in dips toward $0.40–$0.42
🎯 Targets:
TP1: $0.65
TP2: $1.10
TP3: $1.60
TP4: $2.10
🛑 Stop-loss:
Close below $0.34
📊 Risk/Reward:
Solid RR > 4.0 with high potential if momentum kicks in. Volume and structure both support a strong upside.
📢 Final Thoughts:
This is not just a breakout — it's a multi-month accumulation breakout. If the market stays bullish, POPCAT could go parabolic again just like it did earlier.
🚨 Always use proper risk management and SL!
💬 Drop your thoughts in comments & don’t forget to hit that ❤️ if you find this helpful.
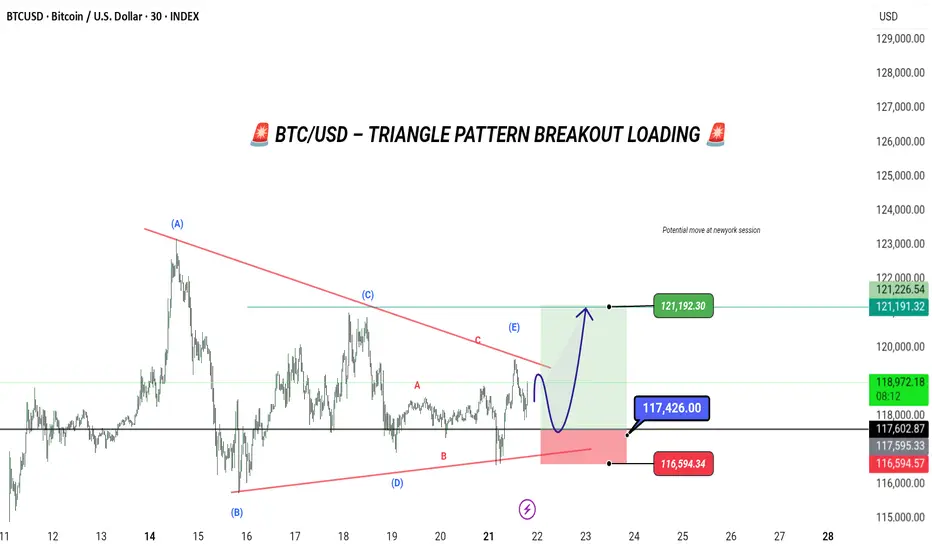
BTC/USD – TRIANGLE PATTERN BREAKOUT LOADING
We’re coiling up like a spring 🌀 inside this textbook triangle structure — and the breakout is about to go BOOM.
👀 Watch the (E) Wave closely. This is where smart money traps the late sellers.
Once price taps the 117.4K zone, expect a sharp reversal up.
🎯 Target: 121,192
📍 Entry: 117,426
❌ Stop Loss: 116,594
💡 Logic: Classic Elliott Wave triangle → ABCDE complete → final breakout wave incoming.
This setup is cleaner than a fresh fade. Don’t sleep on it 😴
🧠 PATIENCE = POWER
Let the market show its hand — then snipe your entry. 🎯
🕒 Timeframe: 30M
⚙️ Strategy: Elliott Triangle + Breakout Play
---
IonQ: Potential Continuation Pattern IonQ had a big surge in late 2024, and now some traders may see potential for continuation to the upside.
The first pattern on today’s chart is May 27's closing price of $48.04. IONQ has made a series of higher lows while remaining below that level, which may be viewed as a bullish ascending triangle.
Second, prices are near the all-time high of $54.74 in January. Could the stock be coiling for a move into new territory?
Third, IONQ is above its rising 50- and 200-day simple moving averages. That may be consistent with a longer-term uptrend.
Fourth, the 8-day exponential moving average (EMA) is above the 21-day EMA. That may be consistent with a short-term uptrend.
Next, IONQ is a fast-growing player in the emerging field of quantum computing. Given the overall focus on technology and increased competition with China, some investors may view the stock as a means to participate in the trend.
Finally, IONQ is an active underlier in the options market. (It’s averaged about 100,000 contracts per session over the last month, according to TradeStation data.) That may help traders take positions with calls and puts.
TradeStation has, for decades, advanced the trading industry, providing access to stocks, options and futures. If you're born to trade, we could be for you. See our Overview for more.
Past performance, whether actual or indicated by historical tests of strategies, is no guarantee of future performance or success. There is a possibility that you may sustain a loss equal to or greater than your entire investment regardless of which asset class you trade (equities, options or futures); therefore, you should not invest or risk money that you cannot afford to lose. Online trading is not suitable for all investors. View the document titled Characteristics and Risks of Standardized Options at www.TradeStation.com . Before trading any asset class, customers must read the relevant risk disclosure statements on www.TradeStation.com . System access and trade placement and execution may be delayed or fail due to market volatility and volume, quote delays, system and software errors, Internet traffic, outages and other factors.
Securities and futures trading is offered to self-directed customers by TradeStation Securities, Inc., a broker-dealer registered with the Securities and Exchange Commission and a futures commission merchant licensed with the Commodity Futures Trading Commission). TradeStation Securities is a member of the Financial Industry Regulatory Authority, the National Futures Association, and a number of exchanges.
Options trading is not suitable for all investors. Your TradeStation Securities’ account application to trade options will be considered and approved or disapproved based on all relevant factors, including your trading experience. See www.TradeStation.com . Visit www.TradeStation.com for full details on the costs and fees associated with options.
Margin trading involves risks, and it is important that you fully understand those risks before trading on margin. The Margin Disclosure Statement outlines many of those risks, including that you can lose more funds than you deposit in your margin account; your brokerage firm can force the sale of securities in your account; your brokerage firm can sell your securities without contacting you; and you are not entitled to an extension of time on a margin call. Review the Margin Disclosure Statement at www.TradeStation.com .
TradeStation Securities, Inc. and TradeStation Technologies, Inc. are each wholly owned subsidiaries of TradeStation Group, Inc., both operating, and providing products and services, under the TradeStation brand and trademark. When applying for, or purchasing, accounts, subscriptions, products and services, it is important that you know which company you will be dealing with. Visit www.TradeStation.com for further important information explaining what this means.

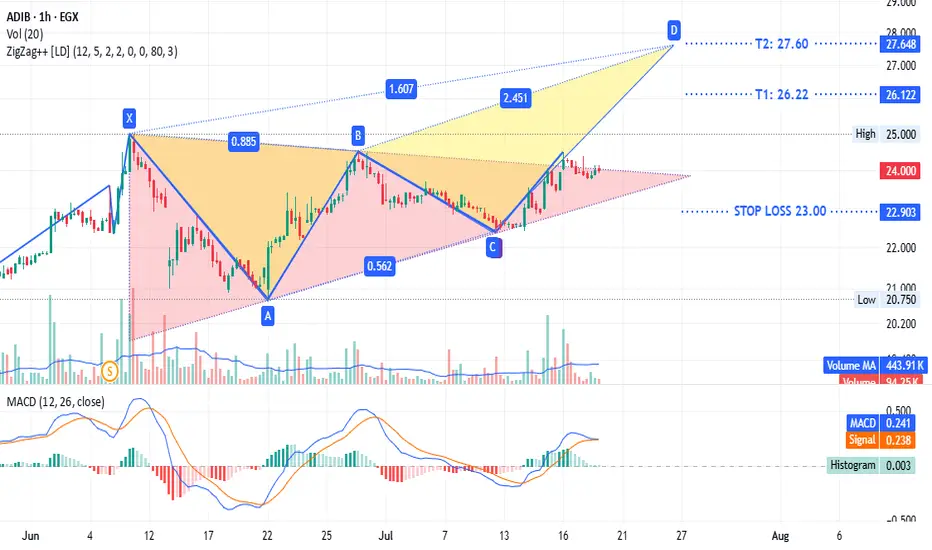
ADIB - same $comi patternADX:ADIB timeframe 1 hour
Is showing a triangle pattern with a potential bearish trend. It is currently testing the upper line of the triangle. The stop loss is at 23.00, and the target sell point ranges from 26.22 to 27.60.
This is not investment advice, only my analysis based on the chart data. Consult your account manager before making any investment decisions. Good luck.
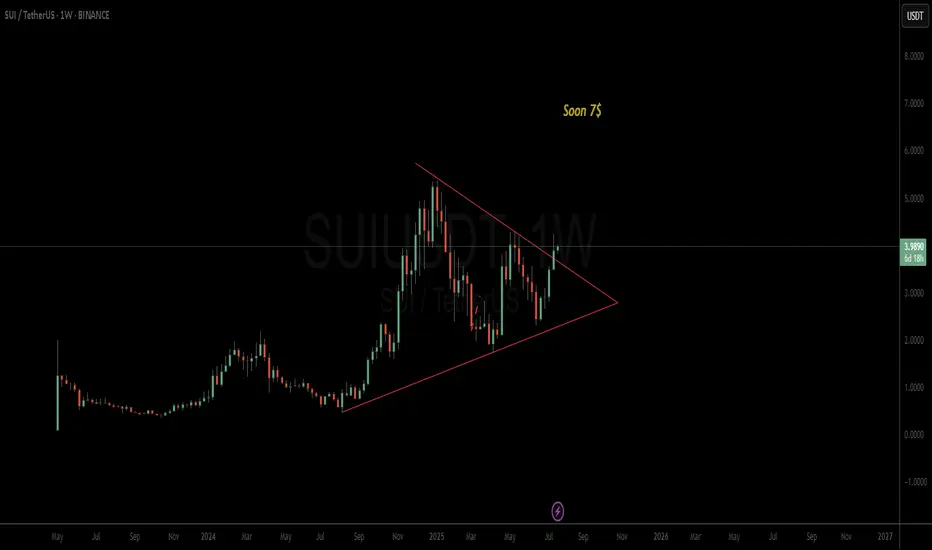
SUI potentail to 7$The chart is clear, folks
The triangle broke, and SUI has the potential to rise to 7$
Good luck
virtuals breaking up from a symmetrical triangle w/a 3x + trgtIf this pattern validates its breakout, the measured move target from here is over 3x. *not financial advice*

ACH - LongWeekly Chart Pattern: Ascending Triangle
An ascending triangle does not guarantee that the stock will enter bearish territory, it can go either way.
ACH is a bit lagging coin comparing to other mainstream cryptos. I have played it twice to the big resistance at ~0.058
PT1: ~.058
PT2: After retesting 0.058
Resistance: ~0.033
Support - Stoploss :~.017

Australia 200: Pullback Presents Second Chance for LongsThe Australia 200 contract continues to trade above former horizontal resistance at 8627, with Monday’s pullback offering an improved entry level for longs looking to buy the breakout.
Bullish positions could be established ahead of 8627, with a stop beneath for protection. The session high of 8727 looms as an initial test for longs, with a push above that level opening the door for further upside.
While some like to use extension targets, the preference would be to wait for a clear topping pattern before exiting the trade. Others may prefer to adopt a target based on the desired risk–reward of the trade.
Bullish price momentum is showing signs of picking up again, favouring a similar bias. Iron ore futures are also flying in Asia, likely assisting gains across the underlying materials sector.
Good luck!
DS

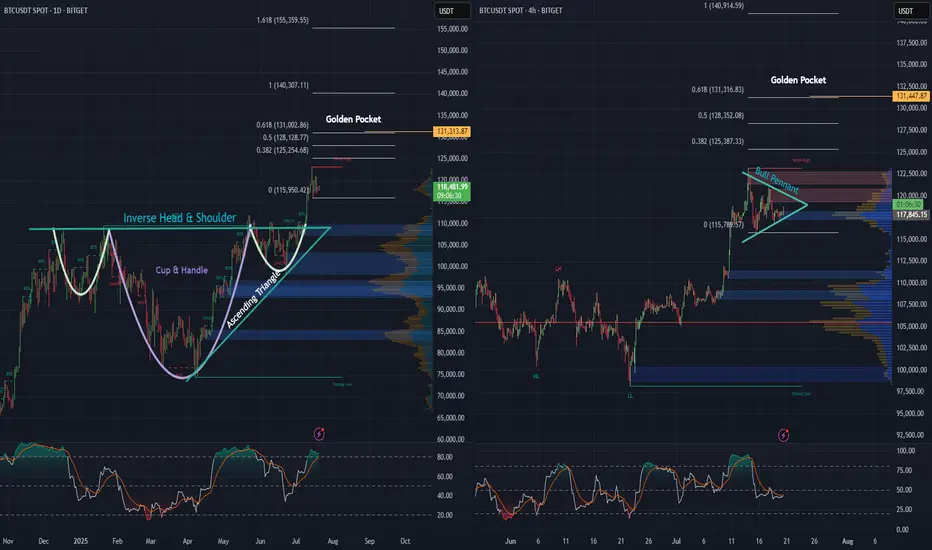
BTC daily, and 4 hr. Bullish Patterns Stack Up!Looking at the Daily and 4-hour charts for BTC, we can see multiple bullish formations unfolding.
An inverse head and shoulders - daily
A cup and handle - daily
An ascending triangle - daily
Price action looks strong, as we’ve begun the breakout from the neckline on the inverse H&S, as well as the cup and handle and ascending triangle simultaneously, and momentum is building fast.
Also, on the 4-hour chart, there’s a pretty substantial bull pennant taking shape. A breakout here could be the next leg up, and the push needed to keep momentum alive.
Zooming out, when we apply the trend-based Fibonacci extension, it reveals a $131,000 golden pocket, on both the the daily as well as the 4 hr. And that could be a major upside target if these bullish structures hold.
Stay tuned to see if BTC continues its move and sets a new all-time high.
Double Bull Flags on an Ascending Triangle breakout on the dailyDaily, double Bull Flag, on top of an Ascending Triangle Breakout. Golden Pocket on the Fib Ext is $588 🥂

Bitcoin: Promising Patterns and Potential BreakoutBitcoin's recent price action has been nothing short of captivating for traders and analysts alike. On the daily chart, we've observed the formation of an Inverse Head & Shoulders and a Cup & Handle pattern, both of which have now transitioned into a Bull Flag. These bullish signals suggest a strong potential for upward movement.
Zooming into the 4-hour and 1-hour charts, we can see prominent Ascending Triangles taking shape. These patterns are often harbingers of significant breakouts, and it appears that Bitcoin is winding up for a substantial move.
Moreover, when utilizing a Trend-based Fibonacci Extension on the daily timeframe, the golden pocket points to a target of $126k, with the next pocket at $185k. This aligns with historical data and technical indicators, suggesting that Bitcoin might be poised to rewrite history once again.
Stay tuned as we monitor these developments and anticipate what could be a historic breakout for Bitcoin!

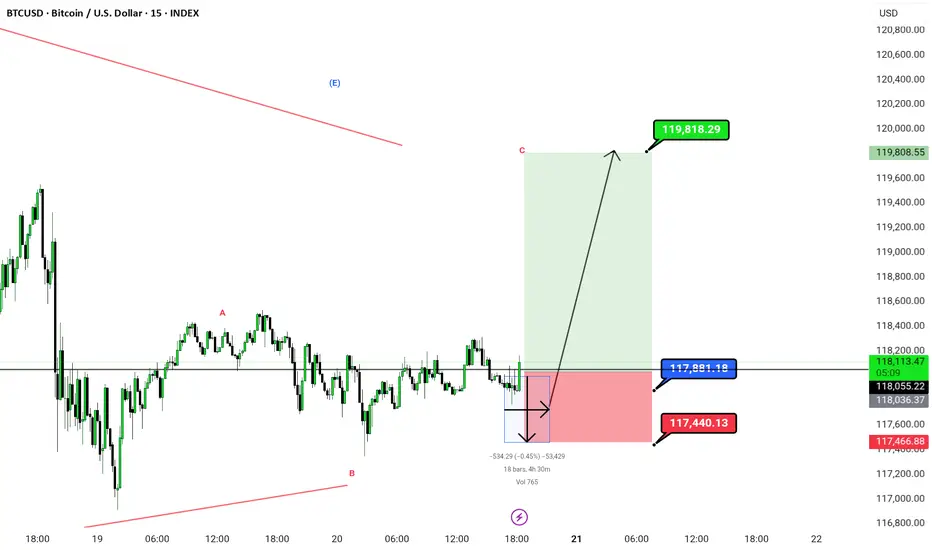
Btc triangle burst |. Bullish This chart shows a 15-minute timeframe analysis for BTC/USD (Bitcoin/US Dollar) using Elliott Wave .
---
📊 Chart Summary:
Wave Structure:
Labeled with corrective wave A–B–C, indicating the end of a corrective pattern.
Price is currently in the potential reversal zone near Wave B, suggesting a bullish move toward Wave C completion.
---
✅ Trade Setup:
Entry Zone: Around current price levels (≈117,889.74)
Stop Loss (SL): 117,440.13 (marked in red)
Target (TP): 119,818.29 (marked in green)
Risk-to-Reward Ratio (RRR): Approx. 1:4, a favorable trade setup
---
🔍 Key Technical Observations:
Bullish Projection: A large green zone indicating strong bullish momentum if Wave C plays out.
Invalidation Zone: Price falling below 117,440.13 would invalidate the bullish count.
Volume Marker: Small thunderbolt symbol at the bottom could imply a volume spike or a critical event time.
Chart Title: Published under Greenfireforex branding, timestamped Jul 20, 2025, likely indicating a public or private analysis post.
---
📌 Possible Interpretation:
This chart suggests a buy opportunity for BTCUSD if price respects the bottom zone (117,440) and begins to climb toward the projected target (119,818). It uses wave theory logic assuming this is a Wave C rally, and price has completed a corrective move.
I'm ready to answer in comments session
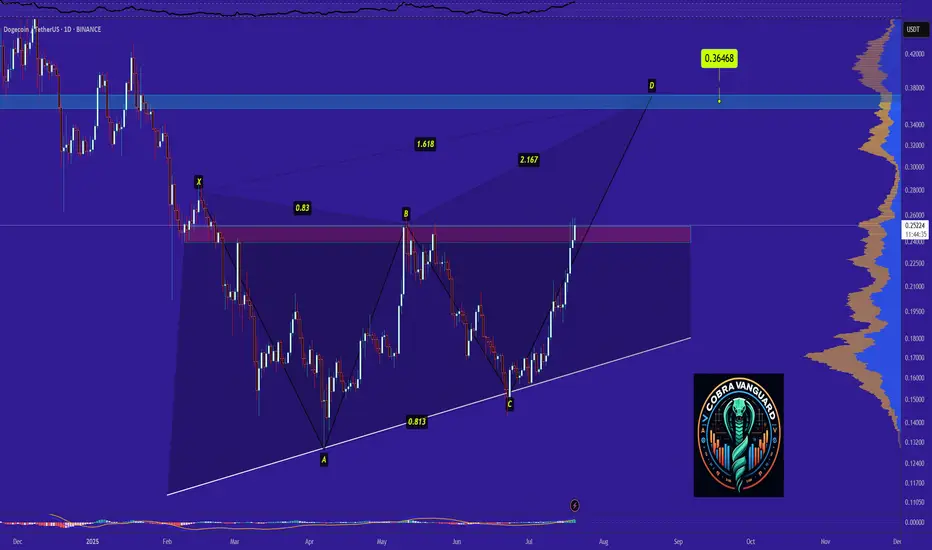
Dogecoin - Time to buy again!So if you pay attention to the DOGE chart you can see that the price has formed a Ascending Triangle which means it is expected to price move as equal as the measured price movement.( AB=CD )
NOTE: wait for break of the triangle .
Best regards CobraVanguard.💚
GOLD (XAUUSD): Sticking to the Plan
Update for my last Sunday's post for Gold.
Previously, we spotted a cup & handle pattern on a daily time frame.
It turned into an ascending triangle pattern - another bullish formation this week.
I am sticking to the same plan - our strong bullish signal is a breakout
of a neckline of the pattern and a daily candle close above 3378.
It will confirm a strong up movement.
❤️Please, support my work with like, thank you!❤️
I am part of Trade Nation's Influencer program and receive a monthly fee for using their TradingView charts in my analysis.

Polish zloty in trouble: Swiss franc is sharpening its teethTechnically, CHFPLN has completed a consolidation phase within a narrowing triangle and broke to the upside. The pair is now testing the 4.60 level (the 0.618 Fibonacci retracement) from below — a decisive zone. A breakout and confirmation above this area opens the path toward 4.705, which coincides with the 0.5 Fibo level and a local resistance. A pullback from that zone back to 4.60 is possible, but this time as a support retest. If the level holds, the targets remain: 4.91 and 5.13 - both marked by Fibonacci extensions and major long-term horizontal resistance. The EMAs are aligned in support of further upside, with price consistently trading above them.
Fundamentally, the Swiss franc remains a safe-haven currency, especially amidst increasing instability in the Eurozone. Weak growth in Germany, looming ECB policy easing, and rising inflationary pressures are all tilting investor interest toward CHF. Meanwhile, Poland faces political uncertainty, budgetary debates, and volatility in the agricultural and energy sectors. All of this strengthens the case for the franc in this pair.
Tactically, the game plan is straightforward: a confirmed breakout above 4.60 signals the start of a bullish impulse. The 4.60–4.705 zone is the key area of interest for buyers. If this zone is reclaimed and held, the next targets - 4.91 and 5.13 - remain valid, where large players may look to take profits.
If this scenario plays out, the zloty may soon be tuning into Polish radio to sing nostalgic songs about the golden days of its strength.
