Trianglebreak

KARURVYSYA is about the break the trendline. Add to Watchlist.Aim for 5-10%. It can be easily achievable in 1-3 days.
My belief is to choose high winning probability trade with a risk-reward ratio going from 1:1 to 1:2.
The reason for booking profit of only 5-8% is because the market direction is not sure at this point. So better to aim for 1:1 risk-reward and rotate your money in better opportunities.
Take trade if all conditions meet at the end of the day 3:15-3:30 PM.
If you have any questions or suggestions, please leave a comment below.
I will personally reply to every single comment!
If you enjoyed this analysis, I would definitely appreciate it, if you smash that like button and maybe consider following my channel.

$SPY getting interesting hereWe're about to break the triangle to the upside or head lower again. We have some gaps to fill on the upside and also in case the 10 and 20DMA crosses the 50DMA, that could be a confirmation of a medium uptrend. Let's see this week and next week - earnings season.

Belusdt waiting for the BREAKOUT!!!! to longAm looking for a quick 1:3.6R on this setup, like and Subscribe.

Usoil long ....Am waiting for the BREAKOUT to long usoil.....1:3R which becomes around 3.6R after scale-in.
Like and Subscribe.....

#Stellar #XLM #Cryptocurrency daily logarithmic time-frame:
A triangle formed with lower highs and and same level lows known as support area.
meanwhile with eye on 4h time-frame, If today's price candle closes under the support area go for short with 0.12 as Stop loss and 0.067 as first TP. Trail the second TP, if there is!

MRF has shown SIGNS of UPTREND hey guys ,
all of the traders were waiting from a long time to find a good swing trade for the stock - MRF
now the time has came ,
and MRF has crossed it's resistance ,
From a LONG time ,
MRF was facing resistance,
from the upper trendline ( WHICH I HAVE DRAWN )
and now this stock has crossed it's resistance .
and taken support
therefore, from my opinion ,
you can buy this stock and earn high returns ,
i have marked the TARGET AND STOP LOSS for y'all,
YOU ALL CAN ZOOM IN ,
AND THEN YOU CAN SEE THAT
THIS STOCK HAS MADE A BEAUTIFUL GREEN CANDLE
WHICH MOTIVATE US TO BUY THIS STOCK,
BUT PLS GUYS , CONSIDER THE GLOBAL MARKET SITUATIONS
1. INFLATION
2. WAR
3. RISING BANK RATES
AFTER CONSIDERING THESE SITUATIONS
YOU CAN BET ON THIS STOCK
😀😀

Bitcoin YOU STILL HAVE A CHANCE TO SHORT - Triangle patternHey everyone,
we've got great profit from our short on last friday. And now i've noticed an other bearish setup with high winning rate
it is based on this trangle pattern as well as moving averages. Price broke the structure at 21k and is now ready to make the next impulse with a target around 19.500
It have a great Risk:Reward ratio of 1:6
Don't forget to like the chart and subscribe for more content.
and tell me what you think in the comment section
Have a nice week!

Eurnzd Waiting for BREAKOUT----BUY!!!Only, I repeat ONLY if I see this setup play out for at least a 1:2.9R, I will take this long.....
Targets on chart, like and Subscribe.

USDC.D needs to close below support zone for crypto rally#USDC.D
#CRYPTOCAP
Market Cap USDC Dominance is below lower line of triangle and retesting the broken line.
breaks down the support zone will trigger a bullish rally across the crypto market.

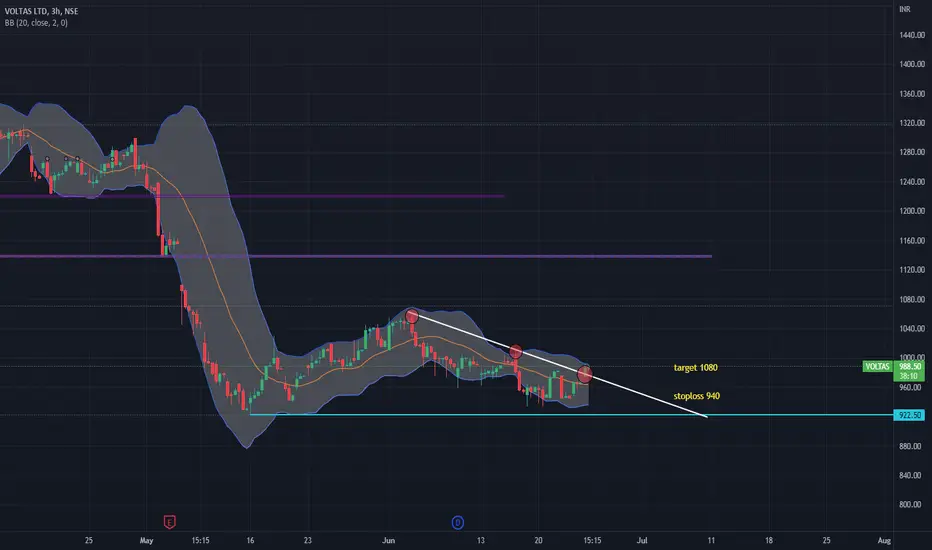
voltasVoltas broke out of triangle pattern & trading above it comfortably on bigger timeframes with decent volumes.
Buy with mentioned stoploss & targets.
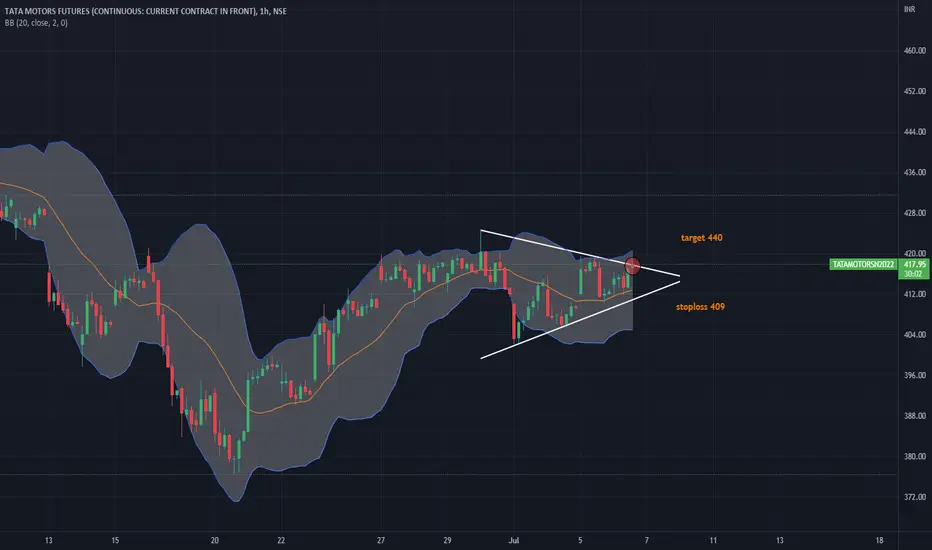
Tatamotor FuturesTatamotor breaking out of triangle pattern on hourly charts with decent volumes.
Could be bought with mentioned stoplos & target.
Gbpaud BUY!!!!!!Am going in on the retest for a 1 : 3.28RR.
Targets on chart......
Like and Subscribe.

Dassault (DSY.pa) bullish scenario:The technical figure Triangle can be found in the French company Dassault Systèmes SE(DSY.pa) in the daily chart. Dassault Systèmes SE is a French software corporation that develops software for 3D product design, simulation, manufacturing, and other 3D-related products. Dassault Group is a subsidiary spun off from Dassault Aviation in 1981. It is headquartered in Vélizy-Villacoublay, France, and has around 20,000 employees in 140 countries. The Triangle has broken through the resistance line on 07/07/2022, if the price holds above this level, you can have a possible bullish price movement with a forecast for the next nine days towards 37.710 EUR. Your stop-loss order, according to experts, should be placed at 34.205 EUR if you decide to enter this position.
Dassault Systèmes announced that it is working with the BMW Group to establish solutions to increase efficiency for vehicle development programs. With BMW Group’s valuable contribution of in-depth process and specialist know-how, the two companies collaborated to create a process-oriented, industry-ready solution for stamped sheet metal parts definition and stamping die design that will increase the efficiency of the parts design and production process.
Risk Disclosure: Trading Foreign Exchange (Forex) and Contracts of Difference (CFD's) carries a high level of risk. By registering and signing up, any client affirms their understanding of their own personal accountability for all transactions performed within their account and recognizes the risks associated with trading on such markets and on such sites. Furthermore, one understands that the company carries zero influence over transactions, markets, and trading signals, therefore, cannot be held liable nor guarantee any profits or losses.

JUBILANT FOODWORKS has crossed its triangle pattern, be bullish hey guys ,
AFTER a long time ,
JUBILANT FOODWORKS have shown a signs of recovery,
first , this stock was moving in definite downtrend,
after crossing it's RESISTANCE ZONE ,
this stock was following TRIANGLE 📐 PATTERN
and now this Stock has crossed it's RESISTANCE ZONE of this 📐
as you can see that ,
this stock has shown a GREAT GREEN 💚 CANDLE 🕯️
which gives us a sign to BUY THIS STOCK ,
this candle has taken SUPPORT on his RESISTANCE ZONE
so you can bet on this STOCK and earn HIGH RETURNS ,
but be CAREFUL THAT , if market is GAPING DOWN , then you can WAIT
and after this Stock has crossed it's resistance
then you can BUY .
BUT FIRST CONSIDER THE GLOBAL MARKET SITUATIONS
AND THEN BUY THIS STOCK
and pls guys ,
if u like my analysis
COMMENT
LIKE
AND FOLLOW MY ACCOUNT .
😀😀

Trends, Triangles, and a Pending Price BattleTrends had some minor changes from the overnight movement. I explained that there is an upcoming Bull / Bear Battleground taking shape. Price is coming under pressure and ultimately something is going to give. I still give a 60/40 bearish sentiment, but again, I trade off of the mathematical equation of trends, and NOT off my opinion.
Today I go over the trends and then I explain Right Angle Triangles and show to two major converging triangles (or perhaps one of them is a false triangle and doesn't exist?!?!) or, on a more fundamental level, the psychological aspect of human behavior in the market place and two price directions meeting together.
In reviewing my own video, just to put some clarification... usually I feel the price has to move into an Apex. If the downsloping triangle wins this price action, I see the price movement going to at least the previous lows, although that could stay the base of that triangle and it doesn't HAVE to go even lower. It is possible that upsloping triangle is a false triangle and is just being spotted because it is part of the downsloping triangle. This is why I always caution on using anything to predict the market, you never get to fully know what was real, and what wasn't, until after the fact.
Hope you enjoy! Remember your Risk Management Plan is the most important part of your trading strategy. If you've been finding my assessments helpful, it would be great to hear some feedback in any way. I enjoy doing these because it makes me really pay attention early in the day so I don't get sloppy in my analysis as I go into my trading day.
As always, this is not official financial or investment advice, and all liability is on you for your investment decisions.

Gbpaud BREAKOUT----- BUY!!!!!!!Breakout, time for retest......
Targets on chart, observe good risk management practice.
Pls Like, Comment your encouragement and questions and Subscribe for more.Thanks, good people.

Nzdchf inverse HEAD & SHOULDERS!!!!!!A cute inverse H&D has formed at the bullish breakout of a descending triangle.....
Am waiting for a break and retest of its neckline be for longs......
Be careful at TP1....
Pls Like, drop a quick 'thank you' in the Comments and Subscribe for more.......Thanks in advance good people.

BTCUSD BUY!!!!!!!!Waiting for a 4H strong bullish breakout above denoted level for long longs......
Targets on the chart.
Pls Like, drop a quick 'thanks' in the Comments (it won't hurt) and Subscribe...... Thanks in advance, good people...

Usdjpy SELL!!!!Head & Shoulders formed as well a s double top, on top of that an ascending triangle breakout......HIGH downside probability.
Pls Like & Subscribe and Comment some encouragement.Thanks.

AUDUSD on course to test below 0.64?As with its Kiwi counterpart, AUDUSD now looks to be breaking down from a bearish Descending Triangle chart pattern. The setup's measured-move downside objective is implied just below the 0.64 figure. Reversing back above the near-term swing top at 0.6919 may neutralize immediate selling pressure.

NZDUSD triangle break hints at deeper decline aheadNZDUSD seems to have broken through the bottom of a bearish Descending Triangle continuation pattern, hinting that deeper losses area ahead. The implied measured-move objective hints that a push toward the 0.58 figure may be in the cards.

Breakout coming on on BTCUSDAfter offering multiple sell opportunities, the BTCUSD pair is now consolidating on the 60m timeframe.
Similarly, the RSI Exhaustion at the bottom is consolidating as well.
Both these consolidations mean that the pressure is increasing and ultimately the pair will break either to the upside (trend reversal) or to the downside (trend continuation).
Remember to stay patient and always look for confirmation from the indicators!
