[Bitcoin] Convergence bearish breakout! Bearish or extention?#Crack #Bitcoin #Binance #Daily
- Without breaking the resistance of $30,444.93 mentioned in the previous briefing, it looks like Bitcoin ended with a bearish convergence due to the emergence of a sell-off.
- We need to prepare for a bearish trend, but we also need to keep in mind the possibility of an extended convergence.
- A successful $28,715.32 support suggests the possibility of a rebound and extension of convergence, while the $30,444.93 and $31k-$31.6k resistances remain important resistances to break out.
- If the $31k-$31.6k resistance is broken, we can expect an bull trend towards the green box with the bottom of the blue bull channel.
- If the $28,715.32 support fails, further bearish trend can be expected due to the downward departure of the triangular convergence, and a decline to $22.7k-$23.8k or $17.1k-$19.7k can be expected.
Trianglebreak

CHAMBLFERTChamblfert broke out of symmetrical triangle on an hourly chart with decent volumes.
Could be bought with mentioned stoploss & targets.

BPCL long upside move of 30% [expected]Bpcl long
Pros
1 rsi divergence
2 weekly trend line
3 making large wick
4 double bottom pattern
Cons
1 earnings ahead

Bitcoin saved by 29k support yet again!Good Evening Traders,
I am back after TV banned me for a week. Apparently, I broke house rules by referencing a site I maintain outside of TV. Anyways, I had put out the following post to all my other SM sites this morning and it is still valid.
-----
I put out a potential short trade opportunity on BTC yesterday if we dropped below the 29k mark and confirmed on the 4hr. We dropped below 29k but we did NOT get confirmation! Therefore, no trades should have been executed. Now, the priority now shifts upwards. You can see resistance overhead with the 50 candle m.a. (now conquered), 30k resistance (now conquered), and the top of our adjusted triangle (adjusted due to recent price action). If we fail to break the upside of this triangle drawn on our 4hr chart, the priority shifts downwards once again. Watch closely. As always, almost all trades in the crypto space should hinge upon BTC price action and trajectory.
-Stewdam.us

CONCORConcor broke out of symmetrical triangle pattern n trading well above it comfortably with decent volumes..
Could b bought with mentioned stoploss & target
11

GBPNZD It is currently in a supply zoneGBPNZD It is currently in a supply zone and the strength of its uptrend has diminished. The chart is expected to move down after breaking the uptrend line.

BTC is breaking downwe are waiting for a candle confimation to get short position on BTCUSD
wait for pull back and then start trade

MUTHOOTFINMuthootfin breaking out of triangle on smaller times with decent volumes, good for intraday trading.
Could be bought with mentioned stoploss & targets on intraday basis.
We ll review to hold or not in closing session.


BTC is forming a symmetrical triangleI published this post to correct the last post:
What bitcoin is shaping seems to be a symmetrical triangle pattern. The chance of break-down to break-up in this pattern is almost equal in a bear market (a 7% breakdown has a better chance)
The direction of breakout will determine the direction of the next short_time trend.

EURUSD H4 - 12/05/20221.052 is a daily resistance of EURUSD. We should expect a big bounce from the first touch but from the chart, there is no bounce at all. The accumulation zone has soon formed a descending flag , indicating that there will soon be a breakout. Right now is a good entry point for short but I'd wait until 1.054 to minimize the loss because it might be a false break .
Remember to trade systematically
Cheers.

The triangle pattern is nearing its endBitcoin is creating a triangular pattern in the weekly time frame. Although the direction of the breakout is not clear, bitcoin seems to be close to the end of the pattern. the direction of the breakout will be the direction of the next trend

BTCUSDT one more leg part IIOne more leg down as expected. Posting part II of my analysis to show a beautiful Triangle on 15M chart. Price action shows pivot point reversal reacting to 0.707* (70.7%) of Fibonacci Retracement. Triangle confluence with 14.6% target.
*0.707 is the square root of 0.5.

Will Microsoft let itself be affected by negative events? ⚔️We tend to see triangles everywhere, we realize that this may be redundant for some, but all modes of chartist analysis are good to go.
We also realize that the triangle Microsoft is forming is not the prettiest, but if it is truly a compression triangle, then we could be looking at an upside breakout.
Only time will tell, I must admit that taking positions in these complicated times for everyone is a risky bet, which may or may not be taken for a good performance.
Only two paths are possible, but which one will Microsoft choose?

BTCUSDT Fibonacci Retracement -188.6%Fibonacci Retracement 188.6% new intraday target. Chaikin Money Flow dives below zero. Fisher Transform H2 bearish momentum. 37/36.9k is the key level to short this currency in a top of the bearish flag (triangle) in formation. I put gasoline on this road. Pivots all based on Fibonacci ratios.

TSLA 15M ANALYSEHello, today I´m talk about Tesla and huge triangle that was made on her price.
The triangle will be broken today or tomorrow. (4.-5.5.)
My view is that it will break a resistance of triangle, because in 21.-28.4., there was huge downtrend, so the price will try to regulate the downtrend with an uptrend.
If you have any other ideas/opinions on this triangle, be free to comment :)

TRIANGEL & DISTRIBUTIONwe expect distribution with this bearish pattern and the pair filled to crossing up the 0.71280 and become strong resistance
so we will take the next strong HVN as target were is strong buyers will push the price up words
as shown on the chart
HAPPY TRADE

BMW (BMW.de) bullish scenario:The technical figure Triangle can be found in the German company Bayerische Motoren Werke AG (BMW.de) at daily chart. Bayerische Motoren Werke AG, commonly referred to as BMW, is a German multinational corporate manufacturer of luxury vehicles and motorcycles headquartered in Munich, Bavaria, Germany. Automobiles are marketed under the brands BMW, Mini and Rolls-Royce, and motorcycles are marketed under the brand BMW Motorrad. In 2017, BMW was the world's fourteenth-largest producer of motor vehicles, with 2,279,503 vehicles produced. The company has significant motorsport history, especially in touring cars, sports cars, and the Isle of Man TT. The Triangle has broken through the resistance line on 04/05/2022, if the price holds above this level you can have a possible bullish price movement with a forecast for the next 17 days towards 86.73 EUR. Your stop loss order according to experts should be placed at 74.36 EUR if you decide to enter this position.
BMW Group and Audi have suspended shipments of cars by rail from Germany to China, the biggest market for both carmakers, due to the Ukraine war. Most of the 846,237 vehicles BMW delivered to Chinese customers last year were produced at its joint venture factory in Shenyang, but between 150,000 and 200,000 were imported from Europe. Beginning in September, BMW began dispatching cars bound for western provinces by train, at a pace then set to reach 16,000 a year.
Risk Disclosure: Trading Foreign Exchange (Forex) and Contracts of Difference (CFD's) carries a high level of risk. By registering and signing up, any client affirms their understanding of their own personal accountability for all transactions performed within their account and recognizes the risks associated with trading on such markets and on such sites. Furthermore, one understands that the company carries zero influence over transactions, markets, and trading signals, therefore, cannot be held liable nor guarantee any profits or losses.

GMTUSDT 15M SHORT TRIANGLEgmt 15M short with triangle breakout
shorted from 3.30 tp 3.25 with 25x lev

AvH (ACKB.br) bullish scenario:The technical figure Triangle can be found in the Belgium company Ackermans & van Haaren (ACKB.br) at daily chart. Ackermans & van Haaren (often abbreviated as AvH) is a diversified group operating in four core sectors: Marine Engineering & Contracting (DEME, one of the largest dredging companies in the world - CFE, a construction group with headquarters in Belgium), Private Banking (Delen Private Bank, one of the largest independent private asset managers in Belgium, and asset manager JM Finn in the UK - Bank J. Van Breda & C°, niche bank for entrepreneurs and the liberal professions in Belgium), real estate and senior care (Leasinvest Real Estate, a listed real estate company - Extensa, a major land and real estate developer with a focus on Belgium and Luxembourg) and energy and resources (SIPEF, an agroindustrial group in tropical agriculture). The Triangle has broken through the resistance line on 30/04/2022, if the price holds above this level you can have a possible bullish price movement with a forecast for the next 23 days towards 174.70 EUR. Your stop loss order according to experts should be placed at 163.40 EUR if you decide to enter this position.
Ackermans & van Haaren realised a record result of 407 million euros over the full year 2021.
Excellent results of the companies across the whole AvH group support this impressive result, which also surpasses that of pre-COVID year 2019 (despite the substantial capital gains realised in that year).
A substantial increase (+17%) of the dividend to 2.75 euros per share is proposed to the general meeting of shareholders.
Risk Disclosure: Trading Foreign Exchange (Forex) and Contracts of Difference (CFD's) carries a high level of risk. By registering and signing up, any client affirms their understanding of their own personal accountability for all transactions performed within their account and recognizes the risks associated with trading on such markets and on such sites. Furthermore, one understands that the company carries zero influence over transactions, markets, and trading signals, therefore, cannot be held liable nor guarantee any profits or losses.

USOIL LONG 1DWe can see nice triangle here, so we are just waiting for breaking an triangle.
There´s also massive trend line, it´s so massive that even one of the biggest fluctuations in the market of oil wont break the line, so we got a nice support from there.
+ situation in the world will make oil more expensive, it´s just ques ti on of time to reach 130$ per barell again.

CanfinHomesCanfinhomes broke out of symmetrical triangle with decent volumes on an hourly charts.
Could be bought with mentioned stoploss & targets.

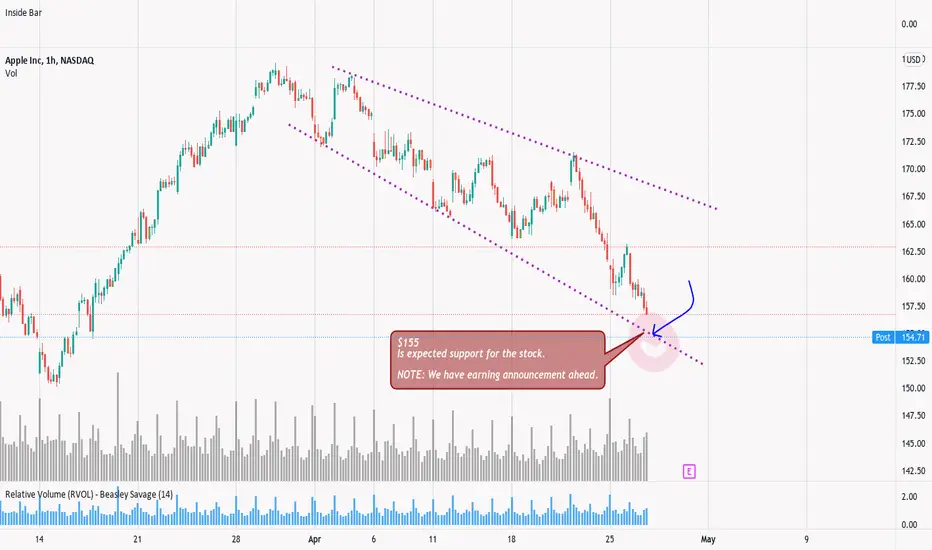
Descending Broadening Wedge - #AAPL Descending Broadening Wedge ( Reversal pattern )
$AAPL
Price makes a low and rises. We then track price as it rises away from the low. We are looking for lower highs and lower lows in a tight range.
The lower highs make a falling trendline, this forms the upper boundary to our pattern. The lower lows make a lower falling trendline, this forms the lower boundary to our pattern.
With the Descending Broadening Wedge formation we are looking for two touches to each trendline.
Both the upper and lower trendlines should fall. The lower trend line should fall more steeply than the upper trendline thus forming the broadening wedge.
Tall and wide patterns work better than short and narrow patterns.
Descending Broadening Wedges tend to breakout upwards.
Swing traders can trade the pattern from top to bottom and from bottom to top.
After the trendlines are formed, as soon as price touches the upper trendline go short. Cover this short (exit the trade) when price reaches the lower trendline.
As price touches the lower trendline go long (buy). Place your stop below the lower trendline. Trade price upwards to the upper trendline. Exit this trade here.
When price breaks the upper trendline and closes above it this signals a breakout. Go long (buy) here.
The target is the first (highest) high in the pattern.