ETH/USDTBINANCE:ETHUSDT
The small triangle I have in mind is something
That failure of the roof or floor indicates that
The price tends to be down or vice versa
The price wants to enter the uptrend again
My opinion for the decision is to wait first
Be a triangle failure
Trianglebreak

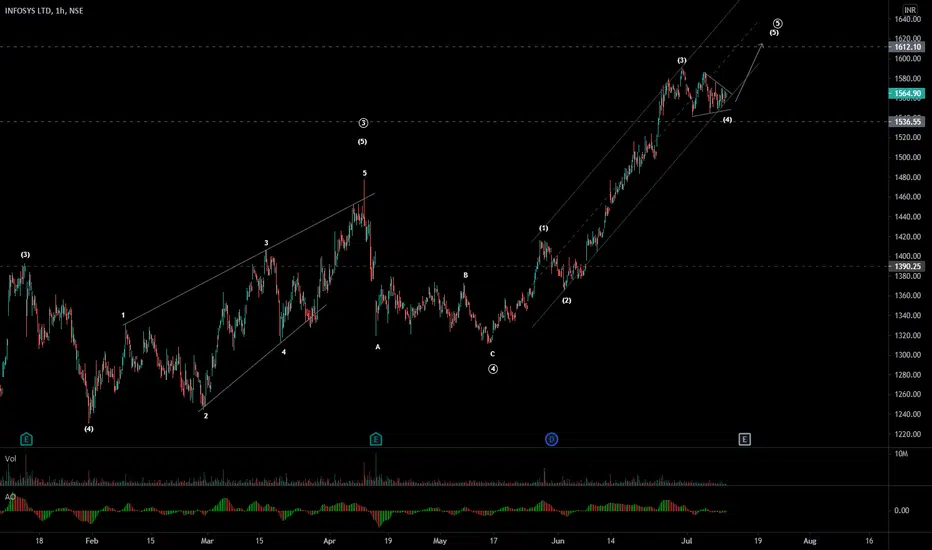
Infy - Elliott wave analysis - 5th wave - triangle breakoutIt will start the 5th wave after triangle breakout as 4th wave above and will go above 1610 level.
Triangle pattern 12 July 2021 TrendingMarket will show green candle , if a huge gap up it will correct if a slight gap down market will go up , those who are long will make will have high probability will make profit. A great triangle pattern too and RSI moving upwards.

GBPCAD bullish scenario:In this pair, we have the technical figure Triangle. The Triangle has broken through the resistance line on 07/07/2021. GBPCAD forming a bullish formation on a daily chart. If the price holds above this level we will have possible bullish price movement with a forecast for the next 22 days with a target of 1.7367. If we decide to enter this position our stop loss order should be placed at 1.7367.
Risk Disclosure: Trading Foreign Exchange (Forex) and Contracts of Difference (CFD's) carries a high level of risk. By registering and signing up, any client affirms their understanding of their own personal accountability for all transactions performed within their account and recognizes the risks associated with trading on such markets and on such sites. Furthermore, one understands that the company carries zero influence over transactions, markets, and trading signals, therefore, cannot be held liable nor guarantee any profits or losses.

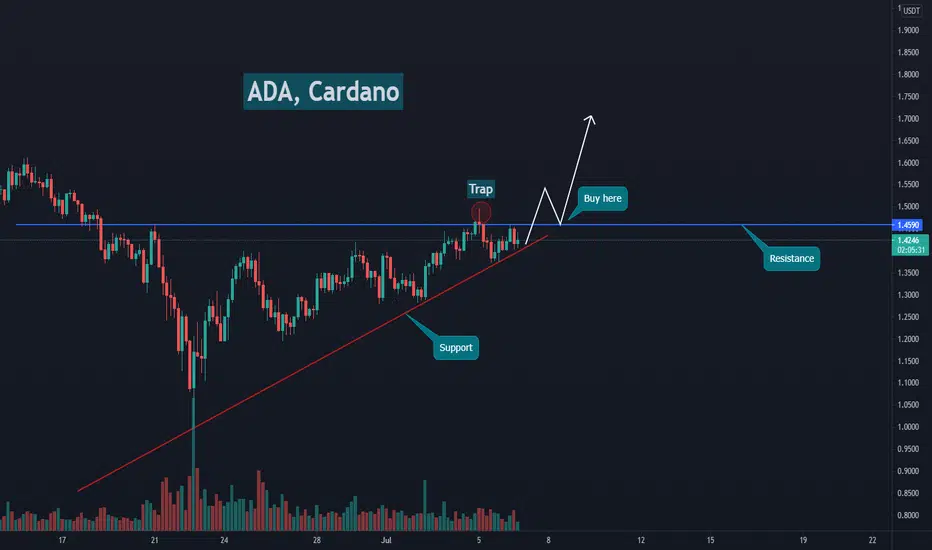
(ADA) Cardano, A clear setup for Taking positionADA Cardano is moving in a triangle pattern. I will take a position after breakout and Re-test.
Please press like button and write comment and share This analysis with your friend to appreciate my hard work, Thanks.
Greatest Percent GAINER OVERBOUGHTAfter two great news, BLIN managed to run up to 10.41, making it an overbought stock.
Jul-02-21 09:24AM
Bridgeline Receives More than $2.5M in Warrant Exercises
GlobeNewswire
+56.00%
Jul-01-21 09:00AM
Bridgeline Partners Win More than 20 Site Search Licenses in its Third Quarter
GlobeNewswire
+33.72%
This two news made possible this situation in which stocks are starting to be sold by demand.
Looking at the chart, we can see how all highs where made with great volume, which is good but the corresponding candle didn't responded the same way, most of the time it closed in its third, showing how demand was getting out of the stock while it kept going up,
We had another sign of weakness in the upward trend when the triangle that formed duting the spring in the supposed wyckoff's accumulation phase, didn't break with strength even though, prices kept mooving up but very timidly, until we had another spike, this time a hammer candlestick (a warning about a change) with the second greatest volume of the timeframe;; this time, the remaining demand got out of the stock, that maintained some momentum that made it break the resistance formed by great volume with no volume ( another sign of weakness) and the icing on the cake comes when we had a doji, reasuring the weakness and how little time the bullish trend has left. (We also have the three SMAs overextended, and prices very far from them).
Surely the news made some great profits to the insiders, but the ones who came late are now out of the trend and should stay out until we have a few clear signs of strength. As we expect the stock price to come back, at least, to the lateral range limited by the blue support and resistance.
I Hope You Have A Great Day!!


WAVES/USDTBINANCE:WAVESUSDT
The price in the triangle should make a small correction
And after correcting the price, it moves to the ceiling again
And if the price can break the ceiling of the triangle, go ahead
Fibonacci is located and this aligns the work to advance the price
It is difficult to buy after the roof of the triangle breaks
Do not wait for the Fibonacci level to fail

BITCOIN just a quick scalpLets not get too bullish, but I do see a nice possible scalp developing. Target $34k- $35k. Not financial advice.

Textbook performance from ADA.The current ADA price movement is one of pure theoretical importance. The reason I say this is based on the fact that we are currently in a bullish continuation pattern know as a triangle pattern. Some would know why I say this formation is very textbook. For those who do not know, it is because with any continuation pattern the price will break out of the confines of the pattern (resistance) only to come back and turn previous resistance into support before it goes on to reach the targets set by the pattern, in this situation the target lies at around $1.61. However the price wont just shoot up to the target and is more likely to build up a bit more support in order to create a strong level that future price will struggle to fall below, but a more directly to the target is also highly possible therefore one would have to look on the smaller time frames for confluences to determine which route the price will take.
What do you think about ADA's current situation. Are you bullish or bearish in the medium term?

breack resistacneBINANCE:BNBUSDT
Now we have to wait for the price to break from the ceiling
Because the triangle is of a kind that pushes the price towards
The roof guides the triangle but if the price falls
And from the bottom of the triangle break the price to close to the level
Fibonacci falls and is back again

Bitcoin AnalysisBINANCE:BTCUSDT
The price is now close to the bottom of the triangle
And we expect the price to be supported but if that
Do not support and break the bottom of the triangle. Price in addition to falling
Completes your double top template and after completing the template
The price can be returned again

ICICI Bank Triangle Break Out - Long- RSI Bullish
- Stochastic Cross over
- Morning Star (Bullish pattern)
- Wait for Triangle Break Out
Entry = 665
Stop Loss = 653
Target = 770

BNB need's a big move here!BNB needs a big move here, BNB is moving in a wedge pattern and in my opinion It will breakout Blue trend line and targets Has been specified.
Good luck


TATACHEM - Symmetrical Triangle BuildupLong-term bet stock for me.
I keep accumulating this stock on dips and decent quantity in my long-term portfolio.
Daily charts have a symmetrical triangle, BO of the same might give some good move.
CMP - 724
One can go long on BO with a small SL of 696 DCB.
All key levels are mentioned in the chart.

01.07.2021. Triangle formation on USOIL The breakout can happen in both ways. OPEC-JMMC Meetings today deciding on oil production. So far things are looking upwards.

EUR/GBP FALSE BREAK OUT ON H4 EUR/GBP forms a triangle on the 4-hour chart, broken twice on June 17th and 22nd, but the price fast returns twice in the formation. The currency pair traded lower on Wednesday after being rejected from the downside resistance line drawn from April 23rd. The last 4-hour candle bounces back from the horizontal support line, and it would be interesting how the price will react tomorrow. If it stays in a very tight range, the investors will remain in anticipation of higher volatility and the price action for triangle exit. But this may happen until busy economic events Friday. If the price breakthrough below Monday’s low at 0.8566 could wake up more bears, who could get encouraged to drive the action down to 0.8530 or far more around 0.8474. In a bull run case, traders would like to see a rebound back above 0.8600. This move would not only take the rate above the aforementioned downside line but would also confirm a forthcoming higher high. The bulls may then get encouraged to push the battle towards 0.8639 or to the following levels at 0.8670 and 0.8717.

1INCHUSDT is testing the weekly support 🦐1INCHUSDT is testing the weekly support. IF the price gets liquidity and the price will have a breakout and have a breakout, According to Plancton's strategy (check our Academy), we can set a nice order
–––––
Follow the Shrimp 🦐
Keep in mind.
🟣 Purple structure -> Monthly structure.
🔴 Red structure -> Weekly structure.
🔵 Blue structure -> Daily structure.
🟡 Yellow structure -> 4h structure.
⚫️ Black structure -> <4h structure.
Here is the Plancton0618 technical analysis, please comment below if you have any question.
The ENTRY in the market will be taken only if the condition of the Plancton0618 strategy will trigger.

USDJPY - Triangle Break expectedHi Traders!
As you can see, the market is moving in a descending Triangle after an Upmovement.
Furthermore, it is moving in a Range.
We also have Lower Highs which shows bearish strength.
Additional Confirmation:
It looks like the 50 MA is going to cross the 200 MA bearish.
This would be a golden cross then.
The target is the 61.8% Fibonacci Retracement which is at the H4-Trendline.
We recommend to enter underneath the 200MA!
Thanks and successful Trading :-)!

MATICUSDT is testing the demand zone 🦐MATICUSDT is testing the demand zone 🦐 inside a triangle. IF the price will have a breakout from the daily resistance and turn into new support, According to Plancton's strategy (check our Academy), we can set a nice order
–––––
Follow the Shrimp 🦐
Keep in mind.
🟣 Purple structure -> Monthly structure.
🔴 Red structure -> Weekly structure.
🔵 Blue structure -> Daily structure.
🟡 Yellow structure -> 4h structure.
⚫️ Black structure -> <4h structure.
Here is the Plancton0618 technical analysis, please comment below if you have any question.
The ENTRY in the market will be taken only if the condition of the Plancton0618 strategy will trigger.

ALGOUSDT could retest 0.75$ 🦐ALGOUSDT could retest 0.75$ on weekly support after the price lost an important daily support and retested it as new resistance. According to Plancton's strategy (check our Academy), we can set a nice order
–––––
Follow the Shrimp 🦐
Keep in mind.
🟣 Purple structure -> Monthly structure.
🔴 Red structure -> Weekly structure.
🔵 Blue structure -> Daily structure.
🟡 Yellow structure -> 4h structure.
⚫️ Black structure -> <4h structure.
Here is the Plancton0618 technical analysis, please comment below if you have any question.
The ENTRY in the market will be taken only if the condition of the Plancton0618 strategy will trigger.

USDCAD: Up or Down ?On this one, price has formed a triangle which is some sort of a correction. However, the price now has been for a couple of days bearish, so which direction will it take in the upcoming hours ?
Up or Down ? This time, and like every time, the candles will tell !
