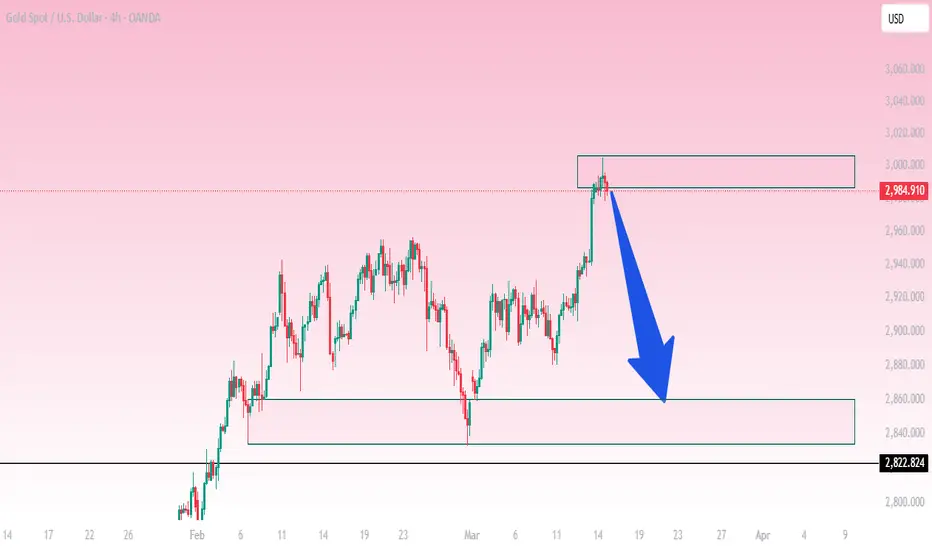
XAU/USD Reversal Setup – Potential Drop Incoming!Gold (XAU/USD) has recently tested a key resistance zone around $2,990, where price action is showing signs of rejection. The market made a strong bullish push, but the momentum appears to be fading near this supply zone.
📉 Possible Scenario:
A bearish reaction from this resistance level could lead to a retracement towards the next key demand zone between $2,860 - $2,840.
If selling pressure continues, we might even see a retest of the $2,822 support level.
🔍 Technical Outlook:
Price is currently at a resistance zone, making it a high-probability short setup.
Confirmation with bearish candles or trendline breaks could provide more confidence for sell entries.
Targets for shorts are set at $2,860 and potentially $2,822.
💡 Trading Plan:
Look for bearish confirmations (rejections, engulfing patterns, trendline breaks) before entering short trades.
A daily close above $3,000 would invalidate this setup and could signal further bullish movement.
What do you think? Are you bearish or bullish on Gold? Drop your thoughts in the comments! 📊🔥
Trianglebreakpattern
Tesla is back in action, chart suggest a potential upside move(1) The price took a significant nosedive, with a correction of nearly 75%.
(2) After a period of consolidation, the price has successfully broken through its trendline resistance and is now on an upward trajectory.
(3) Sitting at a 68% decrease from its peak, this could potentially be a promising opportunity for long-term investors.

Alphabet - Wait For The RetestHello Traders, welcome to today's analysis of Alphabet.
--------
Explanation of my video analysis:
Back in 2012 Alphabet created a beautiful triangle formation and after we saw the breakout Alphabet pumped more than +750% towards the upside. At the moment Alphabet is creating a solid resistance area at the $150 level. If we get a retest of the bullish trendline which I mentioned in the analysis, I am looking for longs and eventually new all time highs.
--------
I will only take a trade if all the rules of my strategy are satisfied.
Let me know in the comment section below if you have any questions.
Keep your long term vision.

Pfizer - Watch The SupportHello Traders, welcome to today's analysis of Pfizer.
--------
Explanation of my video analysis:
All the way back in 2012 Pfizer created a massively bullish triangle reversal pattern at the $17.00 level. This was followed by a +200% rally. Since 2022 Pfizer has been dropping significantly and is now retesting the support level which I mentioned in the analysis. If we see bullish conformation on the smaller timeframes, this might be an interesting long trading setup.
--------
I will only take a trade if all the rules of my strategy are satisfied.
Let me know in the comment section below if you have any questions.
Keep your long term vision.

Chambal Fertilizers - Tringle BreakoutTriangle Breakout with Strong Volume & Momentum
SL - 287
Nearest resistance- 350 to 365

STOCK NAME { TRIVENI ENG } SWING TRADEsymmetrical triangle short term opportunity for upside take trade after breakout from the trendline according to own risk this is not call just a analysis..

symmetrical triangle short term opportunity for upsidesymmetrical triangle short term opportunity for upside take according to ur own analysis

swing trade swing trade kpitech take trade as per your own analysis good breakout can go long according to your own risk

HDFCBANKHdfcbank broke out of descending triangle pattern with decent volumes on smaller TF.
Could be bought with mentioned stoploss & targets.

icicipruicicipru made & beakout of triangle pattern on hourly charts with decent volumes.
Could be bought with mentioned stoploss & targets.

SHORT BIAS ON AUDJPYNext week when the market open, I will be selling AUDJPY. I see a breakout from that triangle and a push downward to that blue horizontal line.. Analysis is backed by Technicals and fundamentals. In the same vain, risk what you can afford to lose...

Tow Away is For ETH Price - Range or PumpHey to Tradinview users I gald to be Well!
ETH have tow way in Next
ETH will range i think
but the second idea is pump for Ethereum if ETH can breakout triangle we will see a big pump for Ethereum that can pump eth to 2k
Its not a signal just an Idea!

forming a symmetrical triangle pattern Shib is forming a symmetrical triangle pattern. Wait for the breakout.

APLLTDAPLLTD made a triangle pattern as well as inverse head n shoulder pattern & broke out of both patterns with more than average volumes.
Could be bought with mentioned stoploss & targets.

Symrise about to rise again?For taking a speculative long position you can assume that this triangle got broken to the top. At least we've reasched already the 50 % retracement mark of the last upward swing.


LARSENLarsen broke out of another bullish triangle & its consolidating at 1919 levels which happens to be its 50% FIB Retracement from breakout level.
Could be bought with mentioned sloss & targets.

Mahindra & MahindraMahindra & Mahindra Broke out of Bullish Triangle Pattern & confirmed with following candle & trading comfortably with good volumes.
Could be bought with mentioned target & stoploss

NSE : KOTAKBANK - KOTAK MAHINDRA BANKChart is self explanatory.
Comment if in doubts.
Good bank, but bearish short term.
Technical trade setup.

power grid inverse head and shoulder + ascending triangle + all time high breakout with good volumes
can give a target of 278 according to fib retracement .

Breakout of ascending triangleBreakout of ascending triangle and pullback.
Target: 0.42 - 0.45
What do you think?

FXF preparing for launchmay i present to you my favourite coin, no big hype until now.
get in bois, the ship's are launching!! i have good longterm expectations on that one, so better HODL it!
(again: this is not financial advice. just my opinion)

BTAI Symmetrical Triangle Breakout: Potential for 100%+ returnsBTAI has just broken out of a nice bullish symmetrical triangle formation. As you can see from my chart the breakout was backed by strong volume as it occurred at a significantly higher level of volume than seen during the consolidation phase. Now that the breakout has occurred you can also see my GMMA oscillator is dying to cross over into the green. The last and only 2 times the GMMA oscillator turned green on the 1 week chart it was followed by major price run ups. The first time we saw price rise from $5.60 in late December 2019 to $43.75 by Mid February 2020. The second time this occurred we saw price rise from $22.50 in mid April 2020 to $71 by mid July 2020. If we have another strong crossover into the green I fully expect another major run up in price. In addition to T.A I have also set a price target of $105 based on fundamental analysis. When coming to this number I was pretty conservative in my calculations and feel that the real upside may be even higher than this $105 number. Overall I am feeling very bullish on BTAI.
