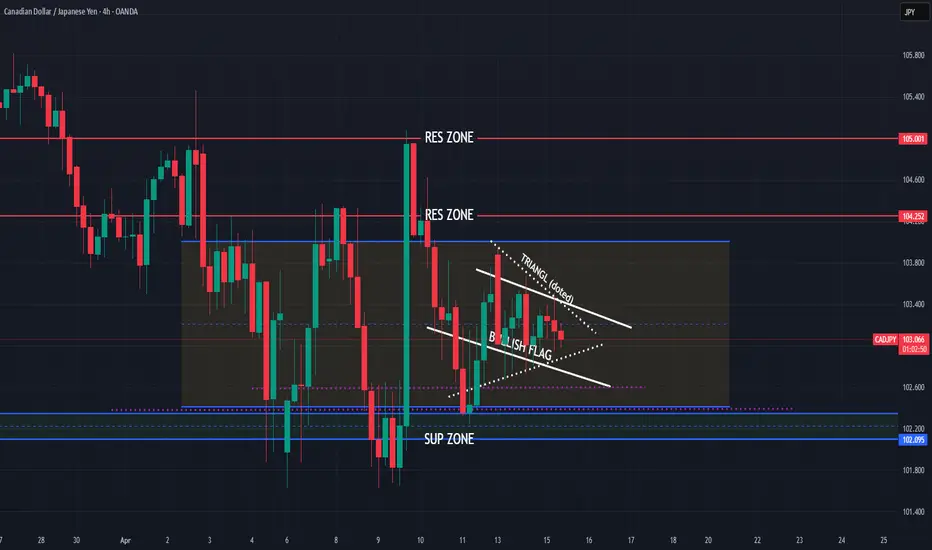
CADJPY structures created, having bullish view
Coming again on OANDA:CADJPY , analysis before this one closed manually, now having batter situation and sharing new view based on price action and patterns.
Few times price is bounce on zone 102.450. Now we have BULLISH FLAG (better visible on 2,1H TF) and we have TRIANGL formation, tomorrow BAC rate cut and some pairs like EUR and GBP versus CAD looks like will go bearish.
View is here bullish for this week.
SUP zone: 102.400
RES zone: 104.250, 105.000
Triangleformation
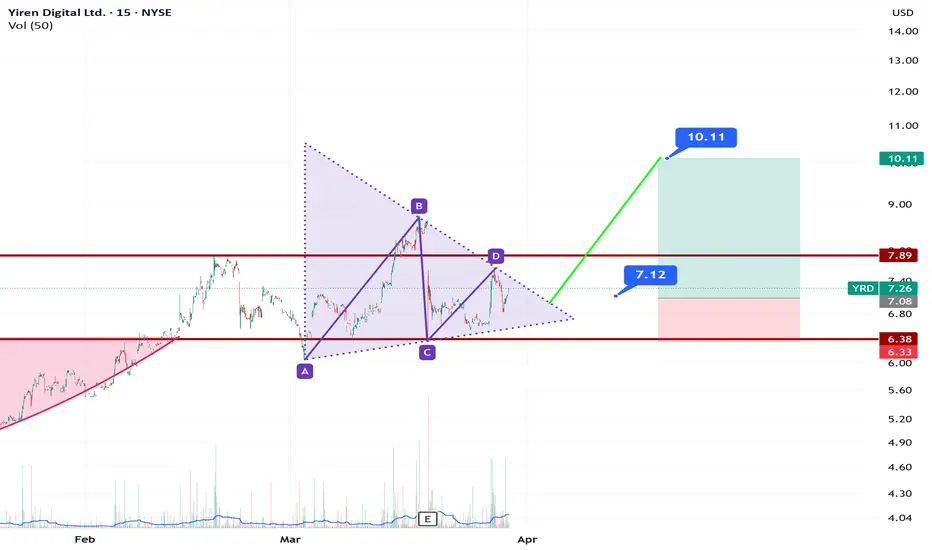
YRD Triangle PatternYRD has good financials in Credit Services. There are NYSE:V , NYSE:MA , NYSE:AXP , NASDAQ:PYPL like companies in Credit Services Industry. The Industry's average PE ratio is 25. YRD's current PE ratio is around 3,41 for latest quarter. It also has triangle pattern.
EURUSD Looks "Bullish"! Triangle Breakout Pending ConfirmationTriangle Pattern Formation.
8 August 2024 - Positive Data from Unemployment Claims = USD Gained.
As a result, EURUSD price action tested Fib between 50%-61.8% and rebounded above 1.0900.
Overall Trend is Bullish as Price is above EMA 50, 100 and 200. MACD > 0, RSI > 50.
Scenario 1 (Long) : Price Break Above 1.9340, TP: 1.1100 , SL: 1.0885
Scenario 2 (Short) : Price Break Below 1.8890, TP: 1.0800 , SL: 1.0935

NZDJPY SHORT OVERVIEWLooking at Potential Downside for XXXJPY Pairs and NZDJPY just joined the Party. LOL

FIL/USDT symmetrical triangleFIL/USDT pair is forming lower highs and higher lows following two sloping trend lines that eventually intersect. We expect that breakout can be in any direction.
To determine take profit(TP) zones we can apply the measurement rule for symmetrical triangles: compute the formation height from highest high to lowest low and add to or subtract the difference from breakout price depending on the breakout direction.
This time we have support zones near expected price goals (in an upward direction 21,7/23,5 and in a downward direction - 16.8/18,45) so we can set up our TP zones in that support/resistance zones.

PXJ - bull or bear?Beauty is in the eye of the beholder they say... so it is with PXJ at the moment. I see an ascending wedge but also an ascending triangle. One is bearish while the other is bullish. Both are decently high-probability setups. Ok, so they're not drawn textbook style but there're reasons why I've ignored certain bars. So someone else could probably see something different too.
I think playing the bullish card is the better option since the uptrend is still robust. Even if the ascending wedge pattern holds, I'm willing to bet that the breakdown will not reach the downside target implied by the wedge.

ALGOUSDT could retest 0.75$ 🦐ALGOUSDT could retest 0.75$ on weekly support after the price lost an important daily support and retested it as new resistance. According to Plancton's strategy (check our Academy), we can set a nice order
–––––
Follow the Shrimp 🦐
Keep in mind.
🟣 Purple structure -> Monthly structure.
🔴 Red structure -> Weekly structure.
🔵 Blue structure -> Daily structure.
🟡 Yellow structure -> 4h structure.
⚫️ Black structure -> <4h structure.
Here is the Plancton0618 technical analysis, please comment below if you have any question.
The ENTRY in the market will be taken only if the condition of the Plancton0618 strategy will trigger.


TRXUSDTthis alt has shown there are bulls in system trying to get control, in lower time frames you will observe a triangle formation which is going to be break from its resistance and goes for new record slowly after that step by step
👉this idea has the confirmation of advanced price action
👉for more information about our services contact me via trading view private chat
👉hit share and spread the information for everybody to get profit

BTCUSD: Trendline + Symmetric Triangle Formation Breakdown Hello everyone!
After a few days of Bitcoin crazy bull rage, we can finally see the Bears turning the tables for a bearish pullback. Price just broke a strong intra-day trendline that supported the bulls... until today. Adding on to that, a bearish symmetric triangle that just pushed the price to the downside, suggesting an intraday downtrend is starting. Another thing is the EffDI(momentum-based indicator) support has broken down.
*Where Price May be Heading for the next few days*
Price may push down until the $36000 area and pullback(TP 1 in the chart) within the next 5 hours, then the price may continue down to $33000 area. But possibly, based on the last major pullback on January 4 which also had a bearish symmetric triangle prior to the down move, the price may continue dropping until $30000, strong support.
*What happens after*
Based on the last major pullback, we may experience a continuance in the major uptrend after the intraday downtrend. Bitcoin still has no signs of the whole bull trend reversing, until otherwise.
So, what do you think about bitcoin? Tell me in the comments!
Please like👍, follow, and share🕸 this idea💡 with the community ! Also, check out my other ideas. Thanks!
Thank you for reading📔! :D

Going long with Amazon! ☝️There is not much to say, triangles are dangerous 🚨, this is a high-risk trade but AMZN is a great company that still has a lot to give.
I'm going bullish betting the symmetrical triangle will break to the upside in a continuation of the uptrend. I think it's time to START BUILDING my position.
My first take profit is at $ 3,760 (127% Fibonacci), relatively close to the next level at $ 3,800 which is the average target price of most analysts.
If the price breaks the triangle with good volume, the red warning line over the triangle would be my confirmation and my last entry, probably after a Throwback.
This isn't trading advice. I've no idea what I'm talking about 😉.
Trade with caution! 🚨
Have a good day! 🤟

Bearish Long term Formation Crude OilCrude has been making lower highs consistently since the 2008 crisis. Adding to that we have immediate demand collapse due to the virus but also long term move to renewables and greener sources of energy. The weekly chart has a long term bearish triangle pattern. Expect long term support sub 20 and price oscillations till 2021 within the wedge. Currently neutral but good short on decent move toward upper range of triangle.

USDCAD: Fundamental analysisThe USDCAD have the extremist spikes among all pairs, as it wasn’t only affected by the Corona Virus fears but also the oil crises as well. The Canadian Dollar is highly affected by the price of oil when oil goes up the Canadian Dollar goes up and vice versa.
Moving to technical analysis, we have extreme spikes that obeys no rule of price action. We have nothing except that Triangle formation that we need to wait for a break through to trade.
The most likely scenario is a bearish break. That suggestion is based on Fundamental Analysis as Saudi Arabia and Russia had finally agreed to reduce their oil production also OPIC had mentioned they would do the same. That will lead to a bullish movement on oil and Sequentially the Canadian Dollar. On the other hand, we still have the Corona Virus fears bushing the US economy down as the US have the largest no. of infections and the highest rate of infection per day.
Therefore, we will short the pair after the break of the Triangle formation. For a more safe entry, you can wait for a retest of the lower edge of the Triangle formation.

symmetrical Traingles in EURUSD price Trendthis EURUSD prices Zone is educational zone for Viewing some Classic Technical and Harmonic Patterns
head and shoulder pattern
symmetrical traiangule
Butterfly Harmonic Pattern
Wedge Pattern
and ....

SWKS Developing Symmetrical TriangleSWKS shows an unusual Symmetrical Triangle formation ahead of Earnings Season. The triangle follows a failed attempt to break out above the previous all-time high.

INCY Triangle FormationINCY has been sideways for a year, but it is not showing a compression candlestick pattern to a potential Triangle Formation. Triangles tend to be continuation patterns much of the time.
