DaburDabur on the verge of breaking above triangle pattern on 30 min TF for second time with good volumes.
Could be bought with mentioned stoploss & target.
Trianglepatternbreakout

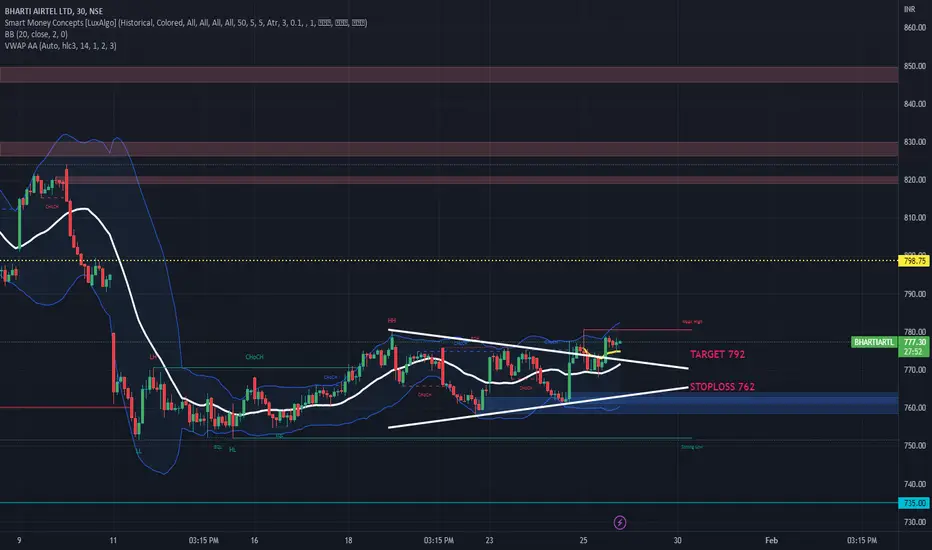
BHARTIBharti broke above triangle pattern & comfortably trading above it with good volumes on 30 min TF.
Could be bought with mentioned stoploss & targets.
DRREDDYDrreddy made ascending triangle pattern on 30 min TF & trying to trade above 4380( triangle breakout & multiple resistance zone) with decent volumes.
Could be bought with mentioned stoploss & target.

CONCORConcor broke out of descending triangle pattern on 30 min TF with good volumes.
Could be bought with mentioned stoploss & target.

BAJAAUTOBajajauto broke out of descending triangle pattern on daily charts with good volumes & with very good risk:reward ratio.
Could be bought with mentioned stoploss & targets.

GODREJPROPGodrejprop broke out of triangle pattern on 30 min TF with decent volumes.
Could be bought with mentioned stoploss & target.

BalkrishnaBalkrishna broke out of descending triangle with good volumes on 30 min TF & also broke above yesterday's high.
Could be bought with mentioned targets & stoploss.

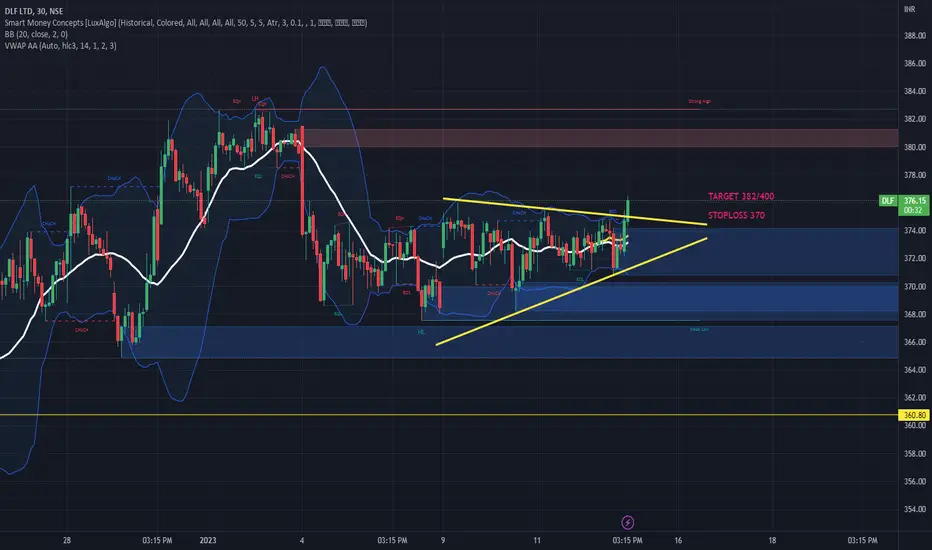
dlfDlf broke above triangle pattern on 30 min TF with good volumes.
Could be bought with mentioned stoploss & targets.
AdaniportsAdaniports broke out of triangle pattern on 30 min TF with good volumes.
Could be bought with mentioned stoploss & targets.

LUPINLupin broke out of triangular pattern on 30 min TF with decent volumes.
Could be bought with mentioned stoploss & target.

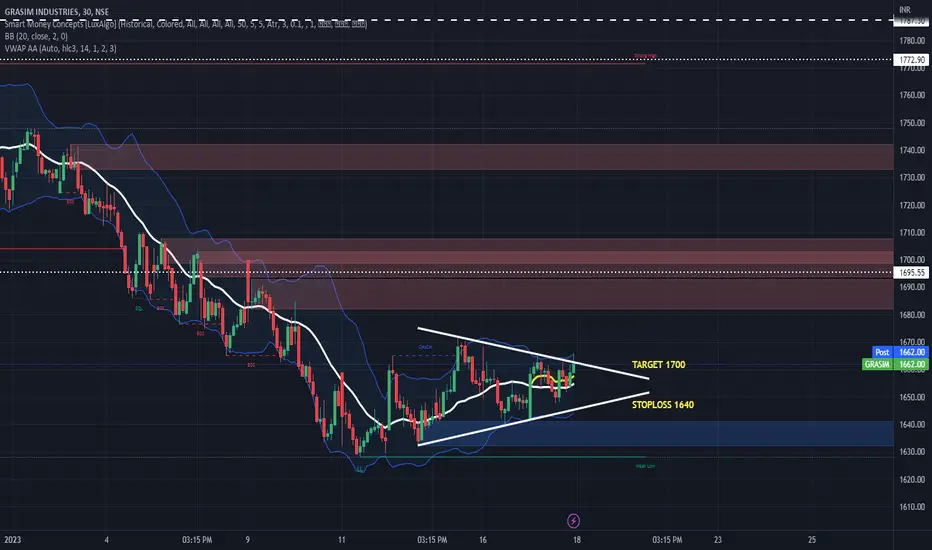
GrasimGrasim on the verge of triangular pattern breakout with good volumes on 30 min TF.
Could be bought with mentioned stoploss & target.
INDIGOIndigo on the verge of taking off out of triangle pattern with decent volumes on 30 min TF.
Could be bought with mentioned stoploss & target.

LUPINLupin broke out of triangle pattern wit good volumes on 30 min TF.
Could be bought with mentioned stoploss & target.

Bharat ForgeBharat Forge broke out of triangle pattern on an hourly TF with good volumes.
Could be bought with mentioned stoploss & target.

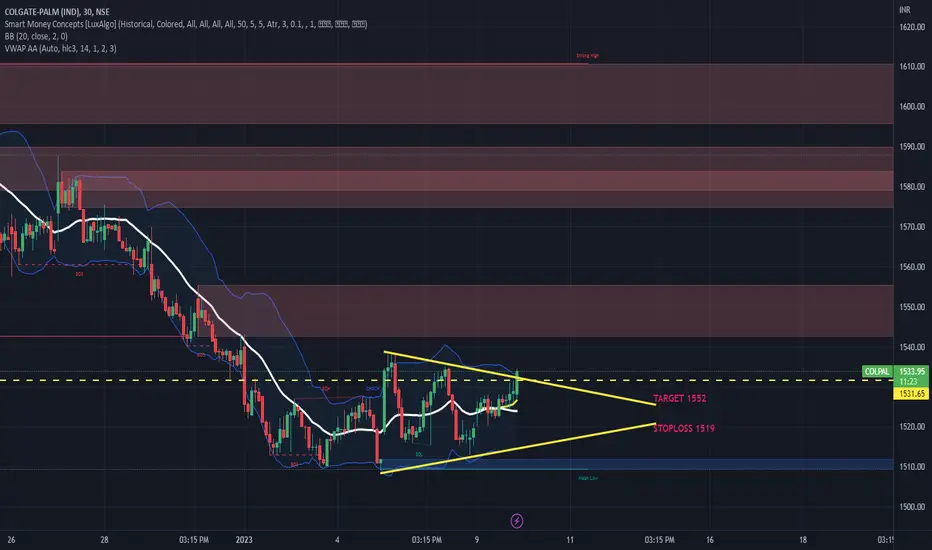
COLPALColpal breaking out of triangle pattern on 30 min TF with goof volumes.
Could be bought with mentioned stoploss & target.
ACCACC broke out of triangl pattern on an hourly TF with good volumes & sustaining above breakout levels,.
Could be bought with mentioned stoploss & targets.

Grasim-IntradayGrasim about to breakout of triangle pattern on 30 min TF with good volumes.
Could be bought with mentioned stoploss & target, will update till closing to carry fwd or not.

Tatacommtatacomm made traingle patten on 30 min TF & broke out of it with good volumes.
Could be bought with mentioned stoploss & targets.

BalkrishnaBalkrishna made triangle pattern on 30 min TF & its on the verge of breakout with good volumes.
Could be bought with mentioned stoploss & target.

SRF SRF broke out of triangle pattern on 30 min TF with good volumes.
Could be bought with mentioned stoploss & target.

STLA - Ascending triangle - Long termOn the weekly timeframe of the STLA chart, we can see an ascending triangle forming. An ascending triangle is a bullish formation.
It's interesting to watch this asset during 2023 for the price to break out of the triangle to the upside. The breakout-line is shown on the chart. When this happens the pattern gets confirmed and trade can be entered by taking a long position. This is a long-term trade.
See all further details on the chart.
Good luck!

IPCALABIpcalab future broke above strong one month resistance of 885 & its trading above it comfortably with huge OI build up.
Also its on the verge of breaking out of triangle pattern on daily chart, if it breaks past 916 then add more.
Buy here & add more above 916 with mentioned stoploss & targets,.

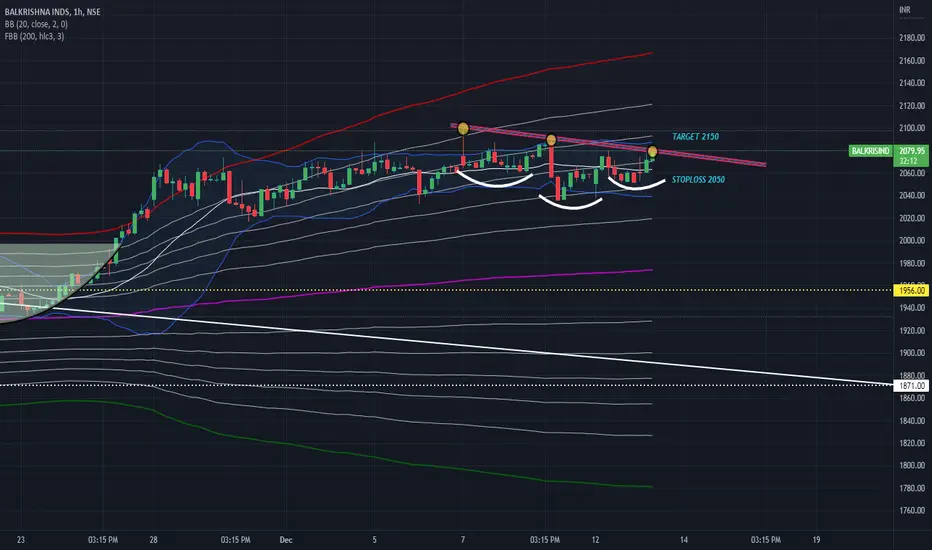
BalkrishnaBalkrishna made triangle & inverse H&S pattern on hourly charts with decent volumes & is on the verge of breaking neckline.
Could be bought with mentioned stoploss & targets.