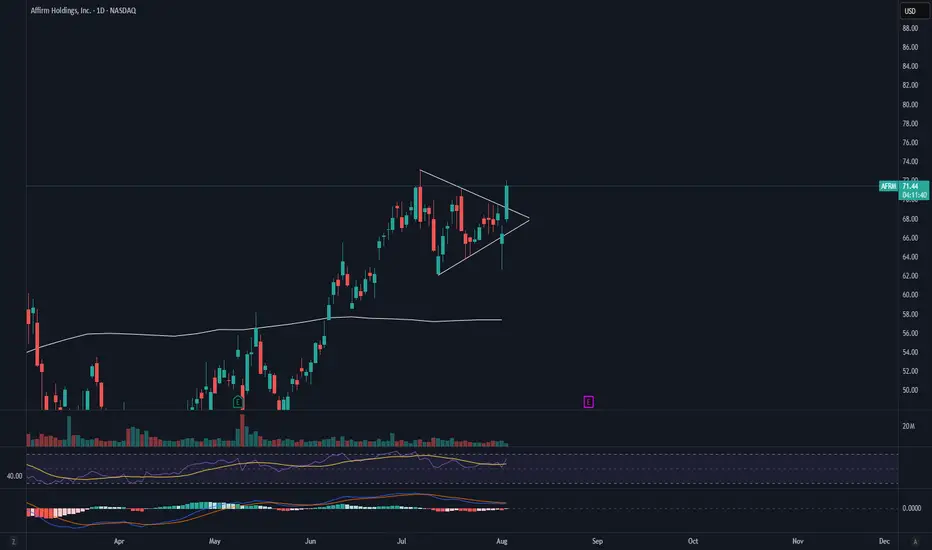
AFRM Pre Earnings Triangle BreakAFRM has broken the symmetrical triangle to the upside. If this holds we could see a strong rally into earnings. I would want to see strong volume added to this equation for the move up to be confirmed.
My STOP on this position would be a daily candle close back under the trendline with confirming volume. A retest of the triangle would be my spot to add to the position.
Trianglepatterns
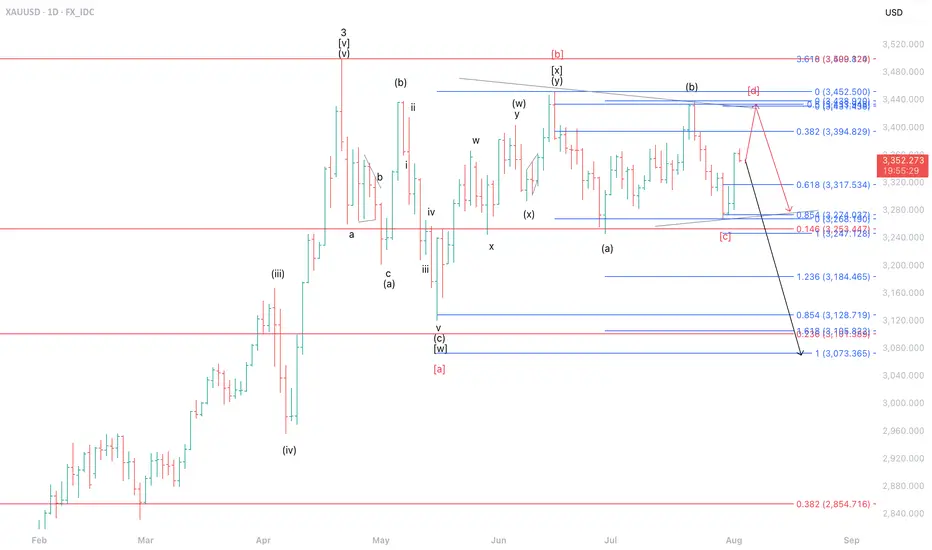
Potential Reversal After Complex CorrectionThe current movement of gold (XAUUSD) is estimated to be forming part of wave ii of wave (c) of wave under the black label scenario. This implies that XAUUSD has the potential to undergo a deeper correction, targeting the 3,073–3,184 range.
However, under the alternative red label, the price action appears to be developing a triangle pattern as part of wave of wave 4. In this scenario, XAUUSD still holds the potential for further upside toward the 3,394–3,438 area, which also coincides with a Fibonacci cluster zone, serving as a critical resistance region.
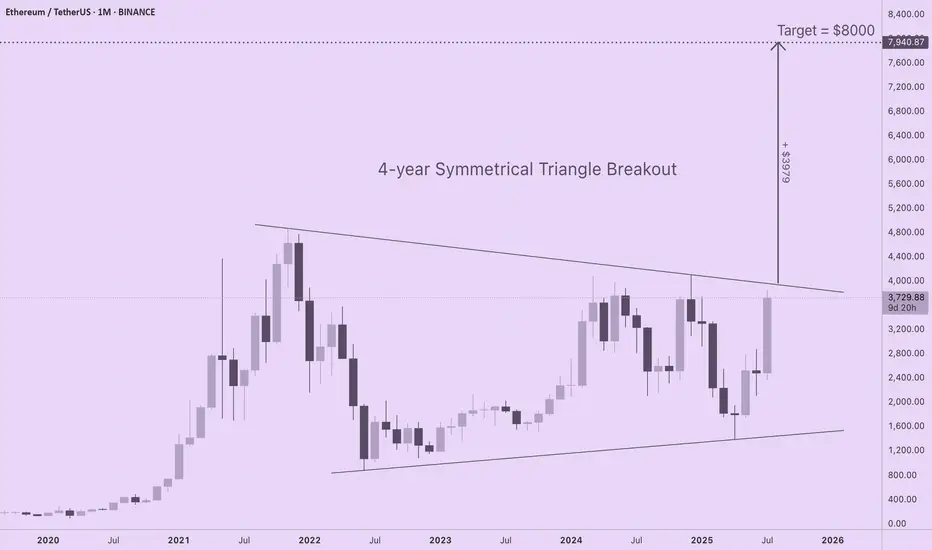
ETH Targets $8000 with 4-Year Symmetrical Triangle BreakoutIf you are seeking realistic ETH price targets based upon solid long-term market structure, check out this 4-year symmetrical triangle forming on the ETH/USD monthly chart. ETH is coiling for a major move to $8000, yet none of the CT "influencers" I follow are talking about this. I am new to technical analysis, so I am interested in learning your thoughts about this pattern and which tools or indicators you prefer for setting price discovery targets.
For those of you new to technical analysis, symmetrical triangle patterns can form on long timeframes (weeks, months, or years), indicating indecision between bulls and bears as price compresses within a continually narrowing range. A breakout from a symmetrical triangle typically follows the direction that preceded their formation, and the longer the consolidation period, the stronger the move.
The chart shows a strong euphoric phase in 2021 followed by a bear market low. Subsequent failure to reach previous ATHs is balanced by a pattern of higher lows. Since ETH was in an uptrend prior to triangle formation, odds are this is a continuation pattern, especially given profound shifts in capital flows and sentiment for the asset over the last several weeks.
With trendlines set at the price extremes, the height of the triangle is roughly $3980. If a breakout occurs at a price of $3960, ETH will target a price of $7940 (height of triangle + breakout price). A more conservative price target of $7000 is obtained by resetting the trendlines at the monthly opening and closing prices (omitting the wicks).
Regardless of the specific method for drawing the triangle, ETH is primed for a major move to the upside that has been four years in the making.
USDJPY – Triangle Complete? Wave (v) Setup BuildingWave (iv) appears to be ending with an (e) wave tag into the 0.764 retracement.
📉 Price remains capped within the contracting triangle — watching closely for breakdown confirmation.
If this plays out, wave (v) of C could now begin unfolding with initial focus on 140.00 and below.
🧩 Structure: (a)-(b)-(c)-(d)-(e) triangle complete
📏 Final wave (e) aligns with 0.764 retracement and structural resistance
⚠️ RSI divergence + weakening momentum support the bearish scenario

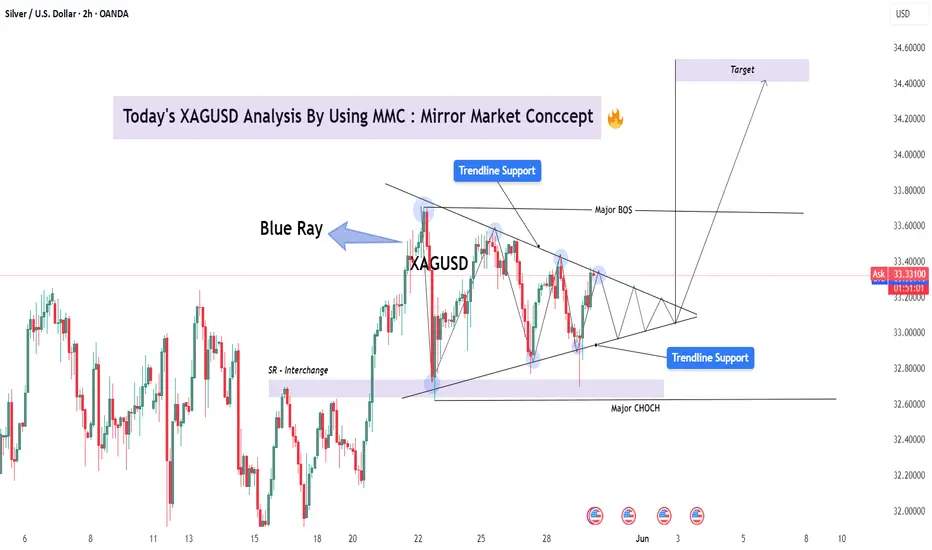
XAGUSD Analysis with MMC | Trendline + CHoCH Insight + Target🔍 Overview
This XAGUSD chart presents a classic Mirror Market Concept (MMC) pattern – a fractal, symmetrical market behavior often observed at key inflection points. The structure is currently forming a tight triangle pattern within two converging trendlines, signaling a compression phase before a significant breakout.
Mirror Market Concept relies on the idea that historical emotional market structures tend to repeat or reflect, especially in psychologically sensitive zones such as trendline tests, liquidity pools, and BOS/CHoCH areas.
📐 Technical Structure Breakdown
🔷 1. Trendline Resistance & Support (Triangle Compression)
Upper trendline connects successive lower highs, reflecting consistent seller pressure.
Lower trendline aligns with higher lows, showing bullish defense and accumulation pressure.
The result is a symmetrical triangle, often preceding explosive directional moves.
🔹 2. Blue Ray Zone
The "Blue Ray" acts as a historical liquidity pivot — a region where large wicks and rejections happened in both directions.
Price has respected this zone repeatedly, making it a likely impulse trigger area if revisited.
🔄 3. BOS (Break of Structure) and CHoCH (Change of Character)
Major BOS near the $33.60 area indicates a shift in market structure to bullish. The break above previous swing highs suggests buyers gained control temporarily.
Major CHoCH at the base of the triangle reflects where market sentiment shifted, initiating the current series of higher lows.
📍 4. SR Interchange Zone
Previous resistance around $32.80–$33.00 is now acting as support (interchange level), creating a confluence zone with the lower trendline and CHoCH point.
🎯 Forecast & Targets
✅ Bullish Scenario (Primary):
A breakout above the upper triangle trendline and confirmation above $33.60 will validate the bullish breakout setup.
Price Target: $34.40 – $34.60 (based on triangle height + measured move theory)
Expect impulsive follow-through as trapped shorts exit and fresh longs enter.
🚫 Bearish Alternative:
A breakdown below $33.00 with strong volume and bearish retest may invalidate the bullish setup.
In such case, a fall toward $32.20–32.40 is possible — completing a deeper retracement before any resumption of the upward move.
🔍 Market Psychology Behind the Pattern
This triangle represents market indecision, a "coil" where both bulls and bears are losing volatility while absorbing liquidity. The MMC concept teaches us that price often mirrors previous patterns — and the compressed energy inside triangles typically resolves in sharp momentum moves, mirroring the prior impulse.
Expect a strong breakout that "mirrors" the breakout leg from May 22 to May 23. This type of reflection-based logic is a cornerstone of MMC.
🔔 Trading Plan & Strategy
Entry: Wait for breakout and retest of the triangle boundary (ideally on 1H/2H close).
Stop Loss: Below the most recent swing low inside the triangle.
TP1: $34.10
TP2: $34.40
TP3: $34.60 (psychological level and measured move)
⚠️ Risk & News Considerations
Upcoming U.S. economic data events (highlighted on the chart) could act as catalysts. Be prepared for volatility spikes and fakeouts. Always use solid risk management.
EUR/GBP – Bearish Breakout Expected & Triangle Pattern + TargetThe EUR/GBP pair is currently consolidating within a well-defined symmetrical triangle pattern on the 1-hour timeframe, often considered a neutral pattern that precedes a breakout in either direction. However, when placed in context with the prevailing downtrend, surrounding key support/resistance zones, and price action behavior, this pattern strongly hints at a bearish continuation.
This is a textbook setup where market compression within a triangle leads to a volatility expansion, offering traders a clear breakout structure with manageable risk and high reward potential.
🔺 Chart Pattern: Symmetrical Triangle
A symmetrical triangle forms when the price creates lower highs and higher lows, converging toward an apex. This indicates market indecision or consolidation. The price is being squeezed between buyers and sellers, leading to reduced volatility.
In the current EUR/GBP chart:
The triangle is forming after a strong bearish impulse, which suggests the probability favors a breakout to the downside (trend continuation).
The triangle’s boundaries are respected with multiple touches, increasing the reliability of the pattern.
🧭 Key Technical Levels:
🔴 Resistance Zone:
The 0.84290 level has acted as strong resistance, capping bullish attempts multiple times. This zone aligns with the upper boundary of the triangle and the prior rejection point.
🟢 Support Zone:
The 0.83915 - 0.83710 zone is a previous support structure that saw multiple reactions. This is the projected take-profit region if the breakdown follows through.
🔵 Breakout Retest Area:
If price breaks the lower triangle trendline (~0.84100), a retest of the broken line may offer a high-probability short entry. This is a common occurrence in technical setups — former support becomes new resistance.
🧠 Market Psychology Insight:
Triangle patterns often reflect a period of balance — bulls and bears are temporarily equal in strength. However, when the price is compressing inside a triangle after a strong directional move (in this case, downward), the market is typically building pressure to continue in the same direction.
The inability of bulls to push past the resistance and the repeated rejection at lower highs is a psychological signal that buyers are weakening, and a bearish breakout is imminent.
📋 Bearish Trade Plan:
Entry:
After price breaks below the lower triangle boundary (~0.84100) and retests it.
Enter on confirmation of bearish candle rejection or strong volume.
Stop Loss (SL):
Above resistance and triangle top: ~0.84290
This invalidates the setup if breached.
Take Profits:
TP1: 0.83915 — minor support zone and realistic first target.
Final TP: 0.83710 — major support and historical price reaction level.
Risk-Reward Ratio:
With SL around 20 pips and TP1 around 30 pips, and TP2 near 50 pips, this setup offers an excellent risk-reward profile (>1.5 to 2.5 R:R).
📅 Upcoming Events & Volatility Watch:
There are multiple economic events shown on the chart (Euro and UK flags). These could impact price action significantly:
Eurozone announcements
UK economic data releases
Ensure you monitor the economic calendar and avoid entering just before high-impact events unless you're managing your trade closely.
📝 Final Thoughts:
This is a high-probability breakout setup for swing or intraday traders who favor trading patterns with clear structure and back-tested success. The market is compressing, and the squeeze is tightening. Volume is likely to surge on breakout, especially during London or early US sessions.
Keep in mind:
Confirmation is crucial — wait for a decisive breakout and retest before committing capital.
Risk management is non-negotiable — place SL logically beyond structure and respect it.
📌 If the breakout happens to the upside, reevaluate the bias and wait for fresh confirmation. The structure itself remains valid either way — it’s how price reacts at those boundary levels that will dictate the move.

XAGUSD Triangle Pattern Forming – Breakdown on the Horizon?🧠 Technical Analysis – XAG/USD
Silver (XAG/USD) has entered a compression phase, forming a classic Symmetrical Triangle Pattern within a broader Black Mind Curve structure, which adds additional psychological and visual significance. These patterns, when paired together, often signal a build-up of volatility ahead of a powerful breakout.
🔍 Pattern Explanation: Triangle + Black Mind Curve
Symmetrical Triangle Pattern: This pattern is marked by converging trendlines of higher lows and lower highs. It reflects indecision between bulls and bears — a tug-of-war where volatility decreases as price coils into the apex.
Black Mind Curve Structure: The curved support and resistance arcs highlight a rounded structure often seen before large breakout moves. These curves create an intuitive framework for understanding how the market is behaving on a broader scale — the "mind of the market" if you will.
🔺 Curve Resistance: Acting as a ceiling suppressing bullish attempts.
🔻 Curve Support: The dynamic floor that has held price within bounds until now.
📉 Breakout & Retest Phase in Play
The triangle has now been breached to the downside, and price is currently in the retest phase — a textbook behavior before continuation. The market is now revisiting the lower boundary of the triangle (~$32.30–$32.40), which is potentially flipping into resistance.
This retest is critical: if price fails to reclaim the triangle and gets rejected, it strengthens the case for further downside.
We’ve also seen a slight uptick in bearish momentum and volume on the initial breakdown.
🎯 Projected Price Targets
We apply the measured move technique, which calculates the triangle’s height and projects it downward from the breakout point:
TP1: $31.68 – A short-term support level and the first technical target.
TP2: $31.12 – Measured move target and key demand zone from the past week.
These levels are not arbitrary — they align with both psychological round numbers and historical structure zones, which often act as magnets for price.
📌 Why This Setup Matters
This isn’t just a triangle breakout. The confluence of the triangle pattern and the Black Mind Curve framework suggests a psychologically significant shift is underway.
Price has respected the curved structure for nearly two weeks.
The triangle represents compression — the final phase before directional expansion.
The false breakout risk is real, but the context (bearish trend leading in, lower highs, failed rallies) favors a downward continuation.
💡 Trade Setup Idea (Example Only)
Parameter Value
🧩 Pattern Symmetrical Triangle
⏳ Phase Retesting after breakdown
🎯 Entry On bearish confirmation at ~$32.30
❌ Stop Loss Above triangle upper bound (~$32.65)
✅ TP1 $31.68
✅ TP2 $31.12
⚖️ Risk/Reward 1:2 or better
Note: Wait for clear rejection candlesticks (e.g., bearish engulfing, shooting star) to confirm bearish intent.
⚠️ Risk Management & Considerations
Avoid premature entries — wait for candle confirmation on the retest zone.
Adjust lot size and leverage according to personal risk tolerance.
Remember: triangle patterns can break either way — monitor invalidation levels carefully (e.g., a breakout back into triangle with strong volume).
💬 Mindset & Market Psychology
This triangle and curve setup mirrors a battle between consolidation and trend continuation. The curves represent the market’s subconscious behavior — as price rounds out and tests boundaries, the final breakout reveals collective trader sentiment.
“Patterns are footprints of psychology. Trade the behavior, not the prediction.”
Be the trader who waits for the story to unfold. Let structure speak before you act.
✅ In Summary
📌 Pattern: Triangle inside Black Mind Curve
🔍 Key Levels: $32.30 (retest), $31.68 (TP1), $31.12 (TP2)
📉 Bias: Bearish, with potential continuation after retest rejection
⏱️ Timeframe: 1H – Suitable for intraday to short-term swing trades
💬 What do you think – is Silver ready to break down, or will bulls reclaim control? Drop your analysis below! Like & follow for more smart technical setups every week.

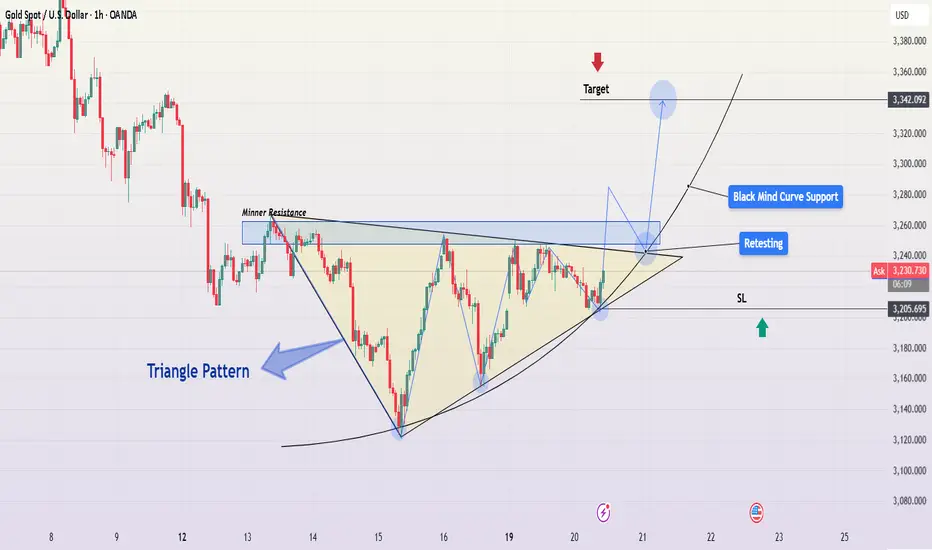
Symmetrical Triangle Breakout Setup on Gold (XAUUSD)Gold traders, pay attention! We’re watching a textbook triangle pattern unfolding on the 1-hour timeframe for XAUUSD (Gold vs USD) — and the breakout could be just around the corner. Let’s break down what’s happening technically and why this setup could offer a high-probability opportunity.
🔺 Pattern Overview: Triangle Formation
We’ve got a clear symmetrical triangle pattern developing — marked by converging trendlines of lower highs and higher lows. This type of structure often signals a buildup of pressure, a “coiling spring” waiting to explode in one direction. These patterns don’t last forever, and based on recent price action, we’re approaching the apex — which means a breakout is likely imminent.
📌 Key Technical Elements
🔷 1. Minor Resistance Zone
A minor resistance zone lies just above the upper triangle boundary. This area has previously acted as a ceiling where sellers stepped in. A decisive candle close above this level would confirm a breakout — turning this resistance into a potential new support.
🔷 2. Retesting Zone
After a breakout, it's common to see a retest of the breakout level. The chart anticipates this scenario with a projected pullback to the triangle edge. If price respects this zone and forms bullish candlestick patterns (like a bullish engulfing or pin bar), it could provide an ideal entry point with lower risk.
🔷 3. Black Mind Curve Support
There’s a curved support line acting as dynamic support beneath the triangle. This "Black Mind Curve" reflects broader market psychology — it's the path where bulls might step in again if price dips. It adds a second layer of confluence support for this trade setup.
📍 SL & Risk Management
The chart also defines a clear Stop Loss (SL) level around $3,205 — placed slightly below both the triangle’s lower boundary and the curved support. This is a sensible location to minimize downside while allowing room for minor volatility.
🛡️ Pro tip: Always risk only a small percentage of your account per trade — ideally 1-2%.
🎯 Projected Target: $3,342
If the breakout plays out as expected, the projected move targets the $3,342 level. This aligns with:
The height of the triangle projected from the breakout point (measured move)
Previous horizontal resistance and Fibonacci extension zones
This offers a strong risk-to-reward ratio, especially if entry is timed during the retest phase.
🧠 Market Psychology Insight
What’s happening under the surface?
Bulls are gradually stepping up, making higher lows.
Bears are losing steam as each push down is weaker than the last.
Volume is likely compressing, indicating a buildup of energy.
Once one side gains control (likely bulls based on this setup), a sharp impulsive move is expected.
💡 How to Trade This Setup
Wait for confirmation: Look for a strong bullish breakout candle above the triangle & minor resistance.
Entry Options:
Breakout entry on confirmation candle
Retest entry near triangle top (lower risk, better R:R)
Set SL below the triangle & curve (~$3,205)
Target: First take-profit at $3,280; second at $3,342+
📣 Final Thoughts:
This setup is a powerful blend of technical structure, support dynamics, and clear breakout potential. While nothing is guaranteed in trading, this is a high-quality formation that deserves a spot on your watchlist.
Let the market show its hand — don’t rush the entry. Wait for confirmation, manage your risk, and let the probabilities do the heavy lifting.
🔖 Tags:
#XAUUSD #GoldAnalysis #TrianglePattern #PriceAction #ForexTrading #BreakoutTrade #SwingTrade #TradingViewIdeas #TechnicalAnalysis #GoldBreakout #RiskManagement
EUR/USD – Symmetrical Triangle Breakout & Bullish Continuation🔍 Overview
The EUR/USD pair has presented a classic and high-probability trading setup based on a symmetrical triangle formation, which recently experienced a bullish breakout. This pattern has formed after a period of compression and consolidation, creating a coiled spring scenario. Technical traders often watch for such breakouts as they signal the resumption of momentum with clear entry, stop-loss, and target zones.
This chart combines pattern recognition, key price action levels, psychological curve mapping, and structured trade planning. Let’s dive deeper into each component.
🧱 1. Chart Structure and Pattern Analysis
🔷 Symmetrical Triangle Formation
A symmetrical triangle is a continuation pattern formed when price action contracts between two converging trendlines.
This represents market indecision — both buyers and sellers are cautious, gradually narrowing the price range.
In this setup, the triangle has been forming since May 11, 2025, with a visible tightening of price action.
The chart shows well-respected upper and lower trendlines, confirmed with multiple touches on both sides.
🔼 Breakout Confirmation
A breakout occurred from the triangle's upper boundary around May 19, with a strong bullish candle closing above the structure.
Breakouts from symmetrical triangles often lead to sharp movements due to built-up pressure during the consolidation phase.
The volume typically expands at breakout zones (although volume is not displayed, price behavior implies it).
🔁 Retesting Area
Price may revisit the broken trendline (previous resistance → now support) for a retest before continuing higher.
This "retesting area" provides an ideal entry for those who missed the initial breakout.
Retests validate the breakout and confirm buyer strength.
🧱 2. Key Levels and Market Dynamics
🔻 Minor Resistance Zone (~1.13700–1.14100)
This zone has previously acted as a supply area where sellers pushed price down multiple times.
Price may hesitate or range within this area before breaking higher.
If bulls maintain control, breaking through this resistance zone will add confirmation to the bullish momentum.
📈 Target Projection: 1.14662
The target is derived by measuring the height of the triangle and projecting it from the breakout point.
It also aligns with a previous horizontal resistance level and psychological round number area.
This zone could act as a medium-term profit-taking level for swing traders.
🧠 3. Black Mind Curve – Market Psychology in Play
The "Black Mind Curve" is a representation of anticipated market sentiment and price flow.
It reflects a wave-like journey post-breakout — early breakout, pullback, bullish continuation, minor consolidation, and final push toward the target.
Such curves are used to forecast crowd behavior patterns, capturing how traders typically react post-breakout:
📌 Initial breakout ➜ Profit taking ➜ Retest ➜ Re-entry ➜ Final impulsive move.
🧮 4. Trading Strategy & Execution Plan
✅ Trade Setup
Entry:
Breakout Entry (already active)
OR Retest Entry near the triangle’s upper boundary for conservative traders.
Stop-Loss (SL) :
Placed just below the triangle’s lower boundary at 1.11726.
This level invalidates the breakout and prevents deeper drawdowns.
Take-Profit (TP):
Final target at 1.14662, offering excellent risk-to-reward potential.
📊 Risk-to-Reward Ratio:
Depending on the entry (breakout or retest), the RR can range from 1:2.5 to 1:3.5, which is ideal for swing or short-term position traders.
📚 5. Educational Insight
This pattern illustrates the importance of:
Price compression zones (triangles and wedges) as precursors to momentum trades.
Confirmation via breakout candles before entering high-conviction setups.
Patience during retests, which allow re-entries with defined risk and improved pricing.
Blending technical structure with psychological forecasting to stay aligned with market sentiment.
🔚 Conclusion
EUR/USD is showing a technically sound and psychologically supportive setup for bullish continuation. The symmetrical triangle has broken with strength, and price is heading toward key resistance with momentum.
If you're already long — consider holding until the target is hit or trailing stops to protect profits. If you're not in yet — watch for a retest to join the move with precision.
🔔 Always remember to manage risk effectively. No setup is guaranteed, but trading based on structure, confluence, and price behavior improves your edge

XAUUSD – Triangle Pattern Forming with Breakout PotentialThe price of Gold (XAU/USD) has recently gone through a structural shift, transitioning from a strong downtrend to a phase of market consolidation. This transition is clearly visible on the 1H chart where price has formed a symmetrical triangle, which generally signals price compression and often precedes a large breakout in either direction.
The most recent significant downtrend came to a halt near a well-identified support zone around the $3,157 level. This level aligns with previous reactions, and the price sharply rebounded from this demand area—indicating strong buyer interest and liquidity absorption.
Following this, the market has shown higher lows and lower highs, compressing into a tight range that is forming the triangle pattern.
📐 Technical Structure Breakdown:
🔸 Symmetrical Triangle Pattern
A classic consolidation pattern.
Formed by converging trendlines—one sloping down (resistance) and one sloping up (support).
This triangle signifies market indecision between buyers and sellers.
Volume is decreasing, which is typical in triangle formations and suggests a breakout is nearing.
🔸 Trendline Breakout & CHoCH (Change of Character)
The earlier bearish trendline was broken, indicating a change in the short-term trend bias.
The CHoCH label on the chart signals the point where bearish market structure was invalidated by a bullish rally, shifting momentum toward buyers.
🔸 Support Zone ($3,157)
This zone served as the springboard for the current bullish impulse.
Price wicked into this level multiple times and formed long lower shadows, confirming buyer absorption.
Acts as the last line of defense for bulls if price retraces after a fakeout or failed breakout.
🔸 Major Resistance Zone ($3,393)
This level is derived from historical supply, where sellers previously overwhelmed buyers.
Now identified as the target zone in case of a successful bullish breakout from the triangle.
A breakout above the triangle would likely trigger buy-side liquidity up to this resistance area.
🔄 Trade Scenario Planning
✅ Bullish Breakout Setup:
Entry: Above upper triangle boundary (aggressive) or after successful retest (conservative).
Confirmation: Break and close above triangle with volume.
Target: $3,393 (major resistance zone).
Stop Loss: Below last higher low inside triangle or breakout candle low.
Risk-to-Reward: Favorable if managed properly from triangle base.
❌ Bearish Breakdown Scenario:
Entry: Below triangle support trendline or upon hitting marked Sell Stop at ~$3,223.
Confirmation: Strong bearish candle closing below the triangle with rising volume.
Target: $3,157 support zone (first target), lower if momentum continues.
Stop Loss: Just above the breakdown candle or inside triangle top.
This provides a hedge setup if the market traps breakout buyers.
📉 Curve Zone & Parabolic Projection:
A curve zone has been drawn to simulate a potential parabolic move to the upside.
If price respects the curve, we might witness accelerated buying once the breakout confirms.
This is a visual guide to monitor momentum alignment with volume and RSI.
📊 Conclusion:
The market is currently in a compressed volatility phase within the triangle. Price is winding up and preparing for a large move. The setup provides a dual-opportunity strategy, allowing traders to position for either direction, depending on which side breaks first. Key levels of support and resistance are clearly defined, and risk can be tightly managed around the breakout points.
This triangle pattern, coupled with a prior CHoCH and clear curve trajectory, gives a strong technical bias for a bullish breakout, but always stay alert for fakeouts and liquidity grabs, especially before big economic news.
🔔 Trading Notes:
Watch for breakout volume and RSI divergence.
Avoid entering prematurely—confirmation is key.
Use alerts at breakout levels.
Be aware of fundamental catalysts (e.g., USD news, Fed decisions, geopolitical tensions).

Potential Formation of a Triangle Pattern ObservedOn the daily timeframe, the Dow Jones movement currently presents two possible scenarios.
Under the black label, there is a potential formation of a triangle pattern, suggesting that the Dow Jones may enter a prolonged consolidation phase to complete wave B, with an expected range between 38,200 and 40,400.
However, under the red label (alternative scenario), a bearish triangle could be forming as part of wave X.

Bajaj Finserv Ltd scending Triangle formation on the monthly📌 Trade Setup: Bajaj Finserv Ltd (NSE)
Pattern: Ascending Triangle
Timeframe: Monthly
Signal: Approaching breakout of horizontal resistance zone
✅ Buy Recommendation
Buy above: ₹2,075 (Monthly close above resistance confirms breakout)
Aggressive entry: ₹2,035 (Current level with early risk)
Target 1: ₹2,400
Target 2: ₹2,750
Target 3: ₹3,000+ (Long-term projection from triangle height)
❌ Stop Loss
SL: ₹1,850 (Below recent swing low and trendline support)
for educational purposes only

Triangle Chart Patterns: How to Identify and Trade ThemTriangle Chart Patterns: How to Identify and Trade Them
Triangle chart patterns are essential tools in technical analysis, helping traders identify potential trend continuations. These formations build as the price consolidates between converging trendlines, signalling an upcoming move in the market. In this article, we’ll explore the three types of triangle patterns—symmetrical, ascending, and descending—and how traders use them to analyse price movements.
What Are Triangle Chart Patterns?
Triangle chart patterns are a common tool used to understand price movements in the market. These patterns form when the price of an asset moves within two converging trendlines, creating a triangle shape on a chart. The lines represent support and resistance levels, and as they get closer together, it signals a potential breakout in one direction.
Symmetrical, ascending, and descending are three types of triangle patterns. Each of these patterns reflects a different market sentiment, with symmetrical triangles showing indecision, ascending triangles suggesting a bullish bias, and descending triangles hinting at bearish momentum. These formations are useful because they help traders spot potential breakouts, where the price might move sharply up or down after a period of consolidation.
It’s important to note that triangles and wedge patterns are similar but not the same. Both patterns involve converging trendlines, but wedges tend to slope upward or downward. Triangles, on the other hand, either feature one horizontal trendline and a sloping trendline or two sloping trendlines at roughly the same angle.
Below, we’ll cover the three triangle types. If you’d like to follow along, head over to FXOpen and TradingView to get started with real-time charts.
Symmetrical Triangle
The symmetrical triangle is a popular chart pattern that shows up when the price of an asset starts consolidating within a tighter range. Unlike other triangle patterns, it doesn’t lean heavily in either direction—bullish or bearish—making it a neutral signal. It forms when buyers and sellers are in a bit of a standoff, with no clear trend in sight. However, this period of indecision often leads to a significant move once the price breaks out of the pattern.
What Does It Look Like?
- Two converging trendlines;
- One sloping down from the highs (resistance);
- One sloping up from the lows (support);
- The price oscillates between these two lines, forming lower highs and higher lows;
- The formation narrows as the lines get closer together, creating a point of breakout.
What Does It Indicate?
A symmetrical triangle pattern indicates a period of indecision in the market. Buyers and sellers are evenly matched, causing the price to move within a narrowing range. As it gets smaller, the pressure builds, and the price is likely to break out either up or down. Since the formation is neutral, the breakout could occur in either direction, and traders wait for this moment to see where the market is heading.
How Do Traders Use It?
Traders typically watch for a breakout from the symmetrical triangle to signal the next significant price movement. They often look for an increase in trading volume alongside the breakout, as this can confirm the strength of the move. In most cases, it’s used as a signal for potential price continuation. However, some traders see it as a reversal indicator, depending on what the preceding trend looks like.
Ascending Triangle
An ascending triangle is a bullish triangle pattern that’s often looked for when analysing potential price breakouts. It usually forms during an uptrend but may also appear in a downtrend. It suggests that buyers are becoming more aggressive, while sellers are struggling to push the price lower, creating a situation where the market might break upwards.
What Does It Look Like?
- A horizontal resistance line at the top (price struggles to break above this level);
A rising trendline at the bottom, connecting higher lows (buyers are stepping in earlier each time);
- The price moves between these two lines, creating a triangle shape;
- The formation narrows over time, putting pressure on the resistance level.
What Does It Indicate?
An ascending triangle pattern signals that buyers are gaining control. While the price keeps hitting a ceiling (resistance), the higher lows show that the market’s buying pressure is increasing. This often leads to a breakout above the resistance level, where the price can make a significant upward move. Traders usually see this formation as a sign that the market is primed for a continuation of the current uptrend. However, sometimes it can appear in a downtrend and signal a trend reversal.
How Do Traders Use It?
Traders typically use the ascending triangle to spot potential breakouts above the resistance level. When the price finally moves and closes above this line, it’s seen as confirmation that the upward trend is continuing. Many also pay close attention to the trading volume during this breakout—rising volume can confirm that the breakout is genuine.
In some cases, the price may break through the resistance quickly, while in others, it could take time before the upward move happens. There may also be false breakouts before the true bullish move occurs, with the price typically closing below resistance.
Descending Triangle
A descending triangle is a bearish chart pattern that signals potential downward movement in the market. It typically forms during a downtrend but can also appear in an uptrend. It shows that sellers are becoming more dominant, while buyers are struggling to push the price higher, which could lead to a breakdown below a key support level.
What Does It Look Like?
- A horizontal support line at the bottom (price struggles to break below this level);
- A descending trendline at the top, connecting lower highs (sellers are pushing the price down);
- The price moves between these two lines, creating a triangle shape;
- The formation narrows over time, with the pressure building on the support level.
What Does It Indicate?
A descending triangle chart pattern suggests that sellers are in control. While the price holds at the support level, the series of lower highs shows that selling pressure is increasing. This often leads to a breakdown below the support line, where the price might experience a sharp decline. Traders see the formation as a bearish signal, indicating that the market could continue its downward trend.
How Do Traders Use It?
Traders typically use the descending triangle to identify potential breakdowns below the support level. When the price falls and closes below this line, it’s considered confirmation that the sellers have taken over and that further downside movement could follow.
Similar to other triangle patterns, it’s common to watch for a rise in trading volume during the breakdown, as it can confirm the strength of the move. It’s also possible to see false breakouts below the support level when the price closes back inside the pattern almost immediately.
How Traders Use Triangle Patterns in Technical Analysis
These patterns are just one piece of the puzzle in technical analysis, but they can offer us valuable insights when used correctly.
Triangle Pattern Trading: Entry, Stop-Loss, and Profit Targets
Entry Points
Traders typically wait for a confirmed breakout from the triangle formation’s boundaries before entering a trade. For ascending triangles, this means watching for the price to break above the upper trendline (resistance), while for descending triangles, they look for a breakdown below the lower trendline (support). In a symmetrical triangle, the breakout may be in either direction, usually informed by the broader market trend.
The entry is often confirmed by a closing candle above or below these key levels to reduce the risk of false breakouts.
Stop-Loss Placement
Stop-loss orders are crucial here. For ascending triangles, stop losses might be placed just below the last swing low, while for descending triangles, they might be set just above the recent swing high. In the case of symmetrical triangles, traders often place the stop-loss just outside the formation’s apex.
Profit Targets
To set profit targets, traders typically use the triangle's height (the distance between the highest and lowest points). This height is then projected from the breakout point, offering a realistic target for the trade. For example, if a triangle stock pattern’s height is $10 and the breakout occurs at $50, the target would be $60 for a bullish move.
Combining with Market Context
Triangles may become more reliable when considered in the context of the broader market environment. Traders don’t just look at the pattern in isolation—they analyse the prevailing trend, market sentiment, and even macroeconomic factors to gauge whether a breakout aligns with the larger market movement. For instance, an ascending formation in a strong uptrend adds confidence to the idea of a bullish breakout.
Using Other Indicators for Confirmation
While triangles provide a useful framework, they’re usually combined with other technical indicators for confirmation. Traders often align triangles with volumes, moving averages, or momentum indicators to assess whether the breakout has strong support behind it. For instance, a breakout confirmed by high volume or a moving average crossover might add confluence to the trade.
Limitations and Considerations of Triangle Patterns
Triangles are useful tools in technical analysis, but they come with limitations and important considerations. While they can signal potential breakouts, it’s essential to approach them cautiously.
- False Breakouts: Triangles often experience false breakouts, where the price briefly moves beyond the trendline but quickly reverses. This may trap traders in unfavourable positions.
- Subjectivity: These formations are open to interpretation. Different people may draw trendlines slightly differently, leading to varying conclusions about where the breakout occurs.
- Need for Confirmation: Relying solely on patterns can be risky. They may work better when combined with other indicators, such as volume or moving averages, to confirm the trend direction.
- Market Conditions: In volatile or news-driven markets, chart patterns may not behave as expected, reducing their reliability. They may provide false signals or lose significance in these situations.
The Bottom Line
Triangle chart patterns are popular tools among those looking to analyse market movements and potential breakouts. Whether it’s a symmetrical, ascending, or descending triangle, these patterns provide valuable insights into price consolidation and future trends. While no pattern guarantees a winning trade, combining triangles with other indicators may improve market analysis.
Ready to apply your knowledge? Open an FXOpen account to explore chart patterns in more than 700 live markets and take advantage of our low-cost, high-speed trading environment backed by advanced trading platforms.
FAQ
What Is a Triangle Chart Pattern?
A triangle chart is a pattern in technical analysis that forms when the price of an asset moves between converging trendlines, creating a triangle shape on a price chart. They typically signal a period of consolidation before a strong potential breakout in price.
What Are the Patterns of Triangles?
There are three main types of triangles in chart patterns: symmetrical, ascending, and descending. Symmetrical triangles indicate indecision in the market while ascending triangles are often bullish, and descending triangles tend to be bearish.
How to Trade a Triangle?
Traders typically wait for a confirmed breakout from the triangle’s trendlines. According to theory, entry points are based on a breakout above resistance or below support, with stop-loss orders placed just outside the triangle. Profit targets are often set based on the height (the distance between the highest and lowest points) of the pattern.
What Is the Triangle Pattern Strategy?
The triangle pattern strategy involves waiting for a breakout and using the formation’s height to set profit targets. It’s combined with tools like volume, moving averages, and momentum indicators to confirm the move and avoid false breakouts.
Is the Triangle Pattern Bullish or Bearish?
They can be both bullish and bearish. Ascending triangles are generally seen before a bullish movement, descending triangles are bearish, and symmetrical triangles can be either.
This article represents the opinion of the Companies operating under the FXOpen brand only. It is not to be construed as an offer, solicitation, or recommendation with respect to products and services provided by the Companies operating under the FXOpen brand, nor is it to be considered financial advice.

EUR/GBP Triangle Pattern - Bearish Breakdown SetupProfessional Analysis of the EUR/GBP Chart
This EUR/GBP (Euro/British Pound) daily chart from OANDA, published on April 3, 2025, highlights a key technical setup based on price action analysis, chart patterns, and support/resistance levels.
1. Market Context: Accumulation & Transition to a Triangle Pattern
Curve Zone Formation (Rounded Bottom):
The market initially exhibited a rounded bottom structure (curve zone) from July 2024 to February 2025, indicating a gradual accumulation phase.
This phase often signals a shift in market sentiment, where sellers lose dominance, and buyers start stepping in.
Breakout from Accumulation:
After reaching the support zone (~0.8250 - 0.8300), price rebounded sharply in March 2025, confirming strong buyer interest.
However, it failed to sustain upward momentum near the resistance zone (~0.8470 - 0.8500), leading to consolidation.
2. Formation of a Symmetrical Triangle Pattern
Lower Highs & Higher Lows:
Price action began forming a symmetrical triangle, a classic consolidation pattern that typically precedes a strong breakout.
The market is currently trading near the apex of the triangle, indicating that a breakout is imminent.
Potential Breakout Direction:
Symmetrical triangles are neutral patterns, meaning they can break either upward or downward.
However, the price structure and resistance rejection suggest a higher probability of a bearish breakdown.
3. Key Levels & Trading Setup
Resistance & Support Zones:
🔴 Resistance Zone (~0.8470 - 0.8500):
This area has repeatedly acted as strong resistance, where sellers have consistently pushed prices lower.
A breakout above this zone would indicate a bullish invalidation of the current bearish bias.
🟢 Support Zone (~0.8250 - 0.8300):
This level has held price multiple times, acting as key support.
A break below this zone would confirm bearish momentum, targeting lower price levels.
4. Bearish Trade Setup
📉 Entry Strategy (Short Position):
Wait for a confirmed breakout below the triangle’s lower trendline (~0.8320 - 0.8350).
A retest of the broken support turning into resistance would provide the best short entry.
📌 Stop-Loss Placement (~0.84764):
Positioned above recent highs and the resistance zone to minimize risk.
This ensures the trade is protected against potential false breakouts.
🎯 Profit Target (~0.81190 - 0.81134):
The projected move aligns with historical support levels, making it a logical target.
This level represents a previous market structure where buyers stepped in.
5. Conclusion & Trade Considerations
✅ Bearish Bias: The price action and pattern suggest a higher probability of a downside breakout.
✅ Defined Risk & Reward: A well-structured stop-loss and target level ensures a solid risk management strategy.
✅ Watch for Confirmation: Traders should wait for a confirmed breakout before entering a trade to avoid false moves.
📊 Overall Verdict: A high-probability short setup is forming, with a clear entry, stop-loss, and take-profit strategy. If the market respects the triangle breakdown scenario, this could lead to a significant bearish move toward the 0.81190 target.

EUR/USD Analysis Ascending Triangle Breakout – Bullish TargetOverview of the Chart:
The chart represents the EUR/USD (Euro to U.S. Dollar) pair on a 1-hour timeframe, showcasing a bullish ascending triangle breakout. The pattern indicates an upward continuation in the trend after a period of consolidation. This analysis will break down the key elements of the chart, the technical structure, and the potential trading strategy.
1. Market Structure & Key Zones
A. Market Curve Area (Early Trend Development)
The price started with a strong bullish trend leading up to the formation of the triangle.
The curved trendline suggests a gradual increase in buying pressure, indicating that the market was preparing for a larger breakout.
B. Resistance and Support Levels
Resistance Level (Red Arrow & Blue Box):
This level acted as a price ceiling where sellers previously dominated.
The market attempted multiple times to break this resistance before successfully breaching it.
Support Level (Green Arrow & Yellow Zone):
The price consistently found buyers at this level, reinforcing a higher low structure.
The rising support line within the triangle indicated strong accumulation by buyers.
2. Chart Pattern: Ascending Triangle Formation
The price action formed an ascending triangle, which is a well-known bullish continuation pattern.
The higher lows (trendline support) indicated buyers were gaining control, gradually pushing the price toward the resistance.
Eventually, the resistance was broken with strong bullish momentum, confirming a valid breakout.
3. Breakout Confirmation & Retest
The breakout above the resistance level came with high volume, indicating strong market participation.
After the breakout, a minor pullback (retest) occurred, confirming previous resistance as new support.
The price surged upward after the retest, validating the bullish trade setup.
4. Trade Setup & Risk Management
A. Entry Strategy
A trader would enter a buy (long) position after confirming the breakout.
Entry Trigger:
Either at breakout (high-risk, early entry)
Or after a successful retest (safer entry)
B. Stop Loss Placement
A stop loss is placed below the previous support level at 1.07276, ensuring risk is limited in case of a false breakout.
C. Target Projection
The target price is measured using the height of the triangle added to the breakout level.
Based on this calculation, the projected target is around 1.12838.
5. Conclusion & Trading Plan
The EUR/USD pair has executed a clean ascending triangle breakout, signaling further bullish movement.
The trading plan suggests:
✅ Entry: Buy after breakout confirmation or retest.
✅ Stop Loss: Placed below 1.07276 for risk management.
✅ Take Profit: Targeting 1.12838, based on the pattern’s height projection.
This setup presents a high-probability long opportunity in a trending market, with proper risk management to protect against potential reversals.

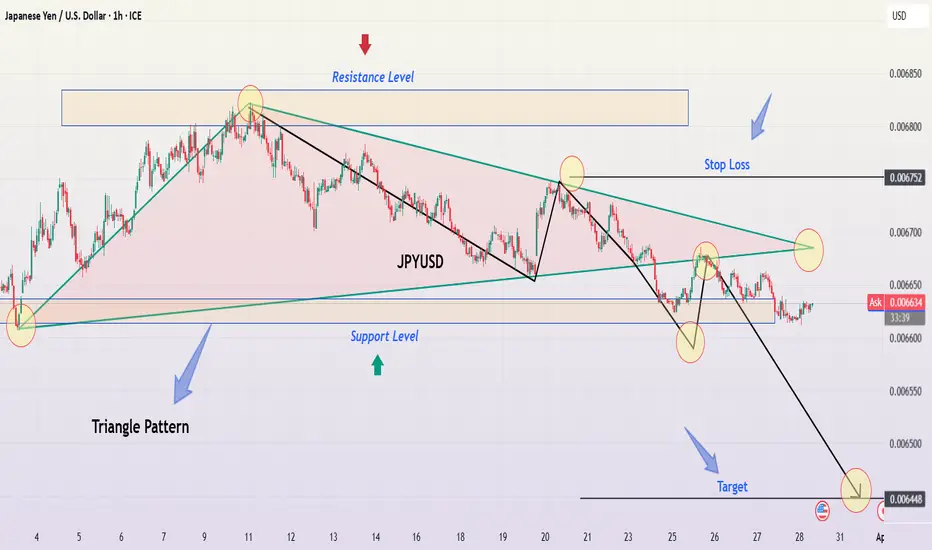
JPY/USD: Bearish Triangle Pattern Breakout Towards TargetChart Pattern: Triangle Pattern
Pattern Description
Type: The chart identifies a Triangle Pattern, which is a type of consolidation pattern that can act as either a continuation or reversal pattern depending on the preceding trend and the breakout direction. Triangles are characterized by converging trendlines, indicating a period of indecision in the market as the price range narrows.
Specific Type: This appears to be a Symmetrical Triangle, as the upper and lower trendlines converge at a similar angle, suggesting neither buyers nor sellers have clear control during the consolidation phase.
Appearance on the Chart:
The Triangle Pattern is marked with two converging trendlines:
Upper Trendline (Resistance): Connects the lower highs, sloping downward.
Lower Trendline (Support): Connects the higher lows, sloping upward.
The pattern began forming around March 27, after a sharp downtrend, and continued until the breakout on April 2, 2025.
Breakout Direction:
Symmetrical Triangles can break out in either direction, but they often continue the preceding trend. In this case, the preceding trend was bearish (a sharp decline from 0.006720 to 0.006640), and the breakout is to the downside, confirming a bearish continuation.
The chart shows the price breaking below the lower trendline of the triangle around April 2, 2025, with a strong bearish candle, indicating a confirmed bearish breakout.
Key Levels and Trading Setup
1. Support Level
A horizontal support zone is marked around 0.006640 (approximately 0.00664–0.00665).
This level acted as a base during the triangle formation, with the price bouncing off this zone multiple times (e.g., on March 28 and March 31).
The price has now broken below this support, turning it into a resistance level on any potential retest.
2. Resistance Level
A resistance zone is marked around 0.006705 (approximately 0.00670–0.00671).
This level corresponds to a previous high within the triangle and aligns with the upper boundary of the triangle at the time of the breakout.
After the breakout, this resistance level is where the stop loss is placed, as a move back above this level would invalidate the bearish setup.
3. Target
The target for the breakout is projected at 0.006599 (approximately 0.00660).
This target is likely calculated by measuring the height of the triangle at its widest point (from the highest high to the lowest low within the pattern) and projecting that distance downward from the breakout point.
The chart indicates a potential move of -0.000604 (-0.96%), which aligns with the distance from the breakout level (around 0.006654) to the target (0.006599).
4. Stop Loss
A stop loss is suggested above the resistance level at 0.006705.
This placement ensures that if the breakout fails and the price moves back above the triangle’s lower trendline (now acting as resistance), the trade is exited with a manageable loss.
Trading Setup Summary
Entry:
The setup suggests entering a short (sell) position after the price breaks below the lower trendline of the Triangle Pattern, which occurred around April 2, 2025. The breakout is confirmed by a strong bearish candle closing below the trendline at approximately 0.006654.
Stop Loss:
Place a stop loss above the resistance level at 0.006705 to protect against a false breakout or reversal. The distance from the breakout level (0.006654) to the stop loss (0.006705) is 0.000051, representing the risk on the trade.
Take Profit/Target:
Aim for the target at 0.006599, which is the projected price objective based on the triangle’s height. The distance from the breakout level to the target is 0.000055, or a 0.96% move.
Risk-Reward Ratio:
The risk is 0.000051 (from 0.006654 to 0.006705), and the reward is 0.000055 (from 0.006654 to 0.006599), giving a risk-reward ratio of approximately 1:1.08 (0.000055 / 0.000051). While this ratio is slightly above 1:1, it’s on the lower side for a typical trading setup, so traders should ensure high confidence in the breakout.
Additional Observations
Price Action Context:
Before the triangle formed, the price experienced a sharp decline from 0.006720 (March 23) to 0.006640 (March 27), indicating a strong bearish trend.
The triangle represents a consolidation phase within this downtrend, and the downside breakout suggests a continuation of the bearish momentum.
Volume and Momentum:
The chart doesn’t display volume or momentum indicators (e.g., RSI, MACD). However, a typical confirmation of a triangle breakout would include:
An increase in volume on the breakout candle, indicating strong selling pressure.
Bearish momentum signals, such as an RSI below 50 or a bearish MACD crossover.
Traders might want to check these indicators for additional confirmation of the breakout’s strength.
Timeframe:
This is a 1-hour chart, so the setup is intended for short-term trading, with the target potentially being reached within a few hours to a day.
Market Context:
USD/JPY is influenced by factors like U.S. dollar strength, Japanese yen safe-haven demand, and interest rate differentials. A bearish move in USD/JPY could be driven by a stronger yen (e.g., due to risk-off sentiment) or a weaker dollar (e.g., due to dovish U.S. economic data).
Conclusion
The TradingView idea presents a bearish setup for USD/JPY based on a Symmetrical Triangle Pattern on the 1-hour chart. The price has broken below the triangle’s lower trendline, confirming a bearish continuation with a target of 0.006599. The setup includes a stop loss at 0.006705 to manage risk, offering a risk-reward ratio of approximately 1:1.08. Key levels to watch include the former support (now resistance) at 0.006640 and the resistance at 0.006705. Traders should consider additional confirmation from volume and momentum indicators, as well as broader market conditions, before executing the trade. Since this chart is from April 2, 2025, market conditions may have evolved, and I can assist with searching for more recent data if needed!

Ultimate Guide to Mastering Chart PatternsChart patterns are essential tools for traders looking to identify high-probability setups based on price action. Among the most reliable continuation and reversal patterns are triangles, wedges, and flags. These formations help traders anticipate market direction and make informed decisions based on breakout potential, trend strength, and volume confirmation.
In this guide, we’ll explore the key characteristics, trading strategies, and confirmation techniques for each of these patterns to improve trade execution and risk management.
Triangle Patterns
Types of Triangle Patterns
Triangles are consolidation patterns that indicate a period of indecision before price continues in the direction of the breakout. There are three main types of triangle patterns:
Ascending Triangle – A bullish continuation pattern where the price forms higher lows while resistance remains flat.
Descending Triangle – A bearish continuation pattern where the price forms lower highs while support remains flat.
Symmetrical Triangle – A neutral pattern where price forms lower highs and higher lows, squeezing into an apex before breaking out.
How to Trade Triangles
Identify the Triangle Formation: Look for at least two touchpoints on each trendline (support and resistance) to confirm the pattern.
Wait for Breakout Confirmation: The price should break above resistance (bullish) or below support (bearish) with strong volume.
Set Entry & Stop-Loss Levels: Enter the trade after a candle closes beyond the breakout point. Set a stop-loss below the most recent swing low (for bullish trades) or above the swing high (for bearish trades).
Measure Target Price: The expected move is typically equal to the height of the triangle measured from the widest part of the pattern.
Wedge Patterns
Types of Wedge Patterns
Wedges are similar to triangles but are characterized by sloping trendlines that converge in the same direction. They indicate a potential trend reversal or continuation depending on the breakout direction.
Rising Wedge – A bearish reversal pattern that forms during uptrends. The price makes higher highs and higher lows, but the slope narrows, signaling weakening momentum before a breakdown.
Falling Wedge – A bullish reversal pattern that forms during downtrends. The price makes lower highs and lower lows within a narrowing channel before a breakout to the upside.
How to Trade Wedges
Identify the Wedge Pattern: Look for a contracting price range within two sloping trendlines.
Watch for a Breakout: The price should break either above (for falling wedges) or below (for rising wedges) with increasing volume.
Confirm the Breakout: Use additional indicators such as RSI divergence or moving average crossovers to validate the move.
Set Entry, Stop-Loss, and Target: Enter after the breakout candle closes beyond the trendline, with a stop-loss outside the opposite side of the wedge. Target the height of the wedge projected from the breakout point.
Flag Patterns
Characteristics of Flag Patterns
Flag patterns are continuation patterns that occur after a strong impulsive move (flagpole), followed by a period of consolidation (flag) before price resumes the trend. Flags can be classified as:
Bullish Flag – Forms after a strong upward move, followed by a downward-sloping consolidation.
Bearish Flag – Forms after a strong downward move, followed by an upward-sloping consolidation.
How to Trade Flag Patterns
Identify the Flagpole: Look for a sharp price move in one direction, which forms the base of the flag.
Confirm the Flag Formation: Price consolidates within parallel trendlines that slightly slope against the prior trend.
Wait for the Breakout: Enter when price breaks out of the flag pattern in the direction of the previous trend with strong volume.
Measure Target Price: The price target is typically equal to the length of the flagpole projected from the breakout point.
Set Stop-Loss: Place the stop-loss below the lower boundary of the flag (for bullish flags) or above the upper boundary (for bearish flags).
Common Mistakes & How to Avoid Them
Trading Before Confirmation: Many traders enter too early without waiting for a breakout confirmation, leading to false signals.
Ignoring Volume: Breakouts should be accompanied by a volume surge for validation; weak volume can indicate a fake breakout.
Setting Tight Stop-Losses: Giving the trade enough room to breathe by placing stops outside key support/resistance levels prevents getting stopped out prematurely.
Forgetting to Manage Risk: Always follow proper risk-reward ratios (at least 1:2) to ensure profitable long-term trading.
Final Thoughts
Triangle, wedge, and flag patterns are powerful tools for traders who understand their structure and breakout behavior. By combining these patterns with volume analysis, trend confirmation indicators, and proper risk management, traders can increase their chances of success. Whether you're trading stocks, forex, or crypto, mastering these patterns will enhance your ability to navigate the markets efficiently.
__________________________________________
Thanks for your support!
If you found this guide helpful or learned something new, drop a like 👍 and leave a comment, I’d love to hear your thoughts! 🚀
Make sure to follow me for more price action insights, free indicators, and trading strategies. Let’s grow and trade smarter together! 📈

Triangle Breakout in JPY/USD – Bullish Move Ahead?This TradingView chart represents a detailed technical analysis setup for the Japanese Yen (JPY) against the U.S. Dollar (USD). The main focus of the chart is a symmetrical triangle pattern breakout, a common formation that signals potential price movement.
In this detailed breakdown, we will analyze the following aspects:
Technical Pattern: Symmetrical Triangle Formation
Support and Resistance Levels
Breakout Confirmation
Trading Setup Explanation
Risk Management Strategy
Market Expectations (Bullish & Bearish Scenarios)
Conclusion & Trading Plan
1. Technical Pattern: Symmetrical Triangle Formation
The chart showcases a symmetrical triangle, which is a continuation pattern that typically occurs in trending markets. It indicates a period of consolidation where buyers and sellers struggle for dominance, leading to an eventual breakout.
Characteristics of the Symmetrical Triangle in This Chart:
Converging Trendlines:
The upper trendline (resistance) is sloping downward, showing lower highs.
The lower trendline (support) is sloping upward, showing higher lows.
Apex Formation:
As the price moves closer to the triangle's apex, volatility decreases, creating a squeeze effect.
Breakout Possibility:
Once price reaches a critical point, a breakout is expected in either direction.
Why is This Pattern Important?
Symmetrical triangles suggest that the market is indecisive, but once a breakout occurs, it can trigger a strong price movement.
Traders wait for the breakout direction to confirm the trade before entering a position.
2. Key Support and Resistance Levels
Support and resistance levels are crucial for identifying potential entry, stop-loss, and target areas.
Resistance Level:
A horizontal resistance zone (highlighted in beige) is drawn at the top.
This zone represents historical price rejection levels, where sellers have previously stepped in.
A confirmed breakout above this level would indicate strong bullish momentum.
Support Level:
The lower support zone (marked in blue) acts as a buying interest area.
Price has bounced off this zone multiple times, confirming it as a strong support level.
A break below this zone would signal a bearish reversal.
Trendline Support:
The lower boundary of the symmetrical triangle also acts as dynamic support.
If price respects this trendline, it suggests bullish strength leading to a breakout.
3. Breakout Confirmation & Market Reaction
The most important part of the setup is the breakout, which occurs when the price successfully moves beyond the triangle's trendline resistance.
Key Observations from the Chart:
Breakout Zone:
The breakout occurs near the right edge of the triangle (circled in red).
The price breaks above the upper trendline, confirming a bullish breakout.
Confirmation Candle:
A bullish candle follows the breakout, confirming buying pressure.
Traders should wait for a retest of the trendline before entering.
Volume Consideration:
Strong breakout moves are typically accompanied by a rise in volume, increasing the likelihood of follow-through.
4. Trading Setup Explanation
This trade follows a trend-following breakout strategy, where traders capitalize on price momentum after confirmation.
Entry Point:
The ideal entry is just above the breakout candle.
Traders can also wait for a retest of the broken trendline before entering.
Stop Loss Placement:
The stop loss is placed slightly below the previous swing low at 0.006652.
This prevents excessive drawdowns in case of a false breakout.
Profit Target Calculation:
The profit target is set at 0.006795, which is calculated based on:
The height of the triangle formation projected from the breakout point.
The next major resistance level, aligning with historical price action.
5. Risk Management Strategy
Risk management is a critical component of any trading strategy. Here’s how it is applied in this setup:
Risk-to-Reward Ratio (RRR):
A good trade setup maintains an RRR of at least 2:1.
If the stop loss is 33 pips (0.000033) and the target is 112 pips (0.000112), the RRR is 3:1, making this a high-probability trade.
Position Sizing Consideration:
Risk per trade should be limited to 1-2% of the total account balance.
Leverage should be used cautiously, as breakouts can sometimes retest the breakout zone before continuing.
6. Market Expectations (Bullish & Bearish Scenarios)
Bullish Scenario (Successful Breakout):
✅ If price sustains above the breakout level, it will likely continue to rally toward the target at 0.006795.
✅ A strong bullish momentum candle would confirm further buying pressure.
✅ If volume supports the breakout, trend continuation is highly probable.
Bearish Scenario (False Breakout or Reversal):
❌ If price falls back inside the triangle, it indicates a false breakout.
❌ If price closes below 0.006652, bears take control, and price may drop further.
❌ A breakdown below the support level would shift the market sentiment bearish.
7. Conclusion & Trading Plan
This chart presents a classic symmetrical triangle breakout trade with a clear entry, stop-loss, and target strategy.
Summary of Trading Plan:
Component Details
Pattern Symmetrical Triangle
Breakout Direction Bullish
Entry Point Above the breakout confirmation candle
Stop Loss 0.006652 (below support)
Take Profit (Target) 0.006795
Risk-to-Reward Ratio Favorable (3:1)
Market Bias Bullish (if price sustains above breakout)
Final Considerations:
Always wait for confirmation before entering.
Monitor volume and price action for additional validation.
Stick to the risk management plan to minimize losses.
If executed correctly, this setup offers a high-probability trade with a strong risk-to-reward ratio, making it a profitable trading opportunity in the JPY/USD market.

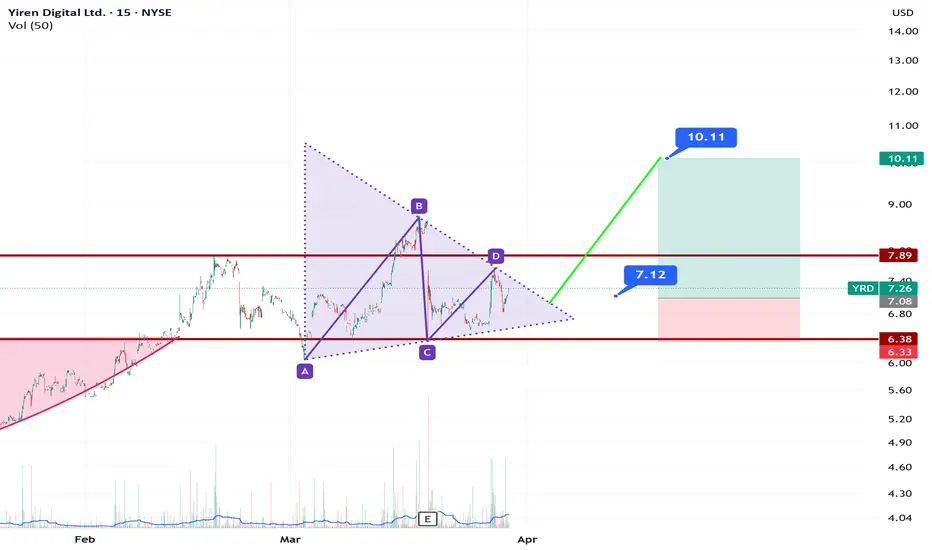
YRD Triangle PatternYRD has good financials in Credit Services. There are NYSE:V , NYSE:MA , NYSE:AXP , NASDAQ:PYPL like companies in Credit Services Industry. The Industry's average PE ratio is 25. YRD's current PE ratio is around 3,41 for latest quarter. It also has triangle pattern.
JPY/USD Descending Triangle Breakdown – Bearish Trading Setup📌 Overview: Understanding the Current Market Structure
This analysis focuses on the JPY/USD pair on the 1-hour timeframe, highlighting a well-defined descending triangle pattern, a classic bearish continuation setup. The price action indicates selling pressure increasing as lower highs form, while support remained relatively stable before ultimately breaking down.
This setup suggests a potential trend continuation to the downside, making it a compelling trade opportunity for short-sellers. Let's dive deeper into the technical breakdown, trading strategy, and market expectations.
📊 Technical Breakdown: Chart Pattern Analysis
1️⃣ The Descending Triangle Pattern: A Bearish Signal
The descending triangle is one of the most reliable continuation patterns in technical analysis, often leading to a breakdown when support is breached. This chart confirms the pattern through:
✅ Downward Sloping Resistance Line:
The price tested this level multiple times but was consistently rejected.
Lower highs indicate sellers are dominating and buyers are failing to push higher.
✅ Flat Support Level:
The price found strong support at a key horizontal level, bouncing off multiple times.
However, each bounce became weaker, signaling buyers losing strength.
✅ Breakout & Confirmation:
The final breakdown below support occurred with strong momentum.
The price has now turned previous support into resistance, a bearish confirmation.
🔎 Implication:
A descending triangle breakout to the downside often results in an extended downward move, aiming for the measured move target based on the triangle’s height.
2️⃣ Key Price Levels & Trading Zones
📌 🔴 Resistance Zone (Upper Triangle Boundary):
0.006700 – 0.006750
This level acted as a strong rejection zone, confirming lower highs.
It now serves as a resistance level after the breakdown.
📌 🟢 Support Level (Triangle Base):
This level previously held price from breaking lower multiple times.
However, with each bounce becoming weaker, it finally gave way.
Break & Close below this level confirms the bearish continuation.
📌 🎯 Target Projection (Based on Triangle Breakout):
0.006448 (Final Target) – This level aligns with historical price action and the triangle’s projected move.
📌 🚨 Stop Loss Placement:
Above the last swing high (~0.006752)
If price reclaims this zone, the bearish outlook becomes invalid.
📈 Price Action & Market Sentiment
3️⃣ Bearish Momentum & Breakdown Confirmation
✅ Lower Highs Indicate Weakness:
Buyers attempted multiple recoveries but were consistently rejected at lower levels.
This pattern suggests exhaustion in buying pressure.
✅ Breakout Candle Strength & Volume Confirmation:
The price broke support with strong momentum and increased volume, confirming sellers’ control.
A breakdown without volume is often a fakeout, but this chart shows clear momentum.
✅ Potential Retest Before Further Drop:
After a breakdown, price often retests the broken support before continuing lower.
A pullback to the resistance zone (~0.006650 - 0.006700) could offer an ideal short entry.
✅ Bearish Trend Confirmation:
The price remains below key resistance and continues forming lower lows.
The downtrend structure remains intact, reinforcing the bearish sentiment.
📉 Trading Strategy: How to Trade This Setup?
🔹 Entry Strategy:
Ideal Entry: Short after a pullback to broken support (~0.006650 - 0.006700).
Aggressive Entry: Short immediately on the breakdown if momentum remains strong.
🔹 Stop Loss Placement:
Place above last swing high (0.006752) to avoid being stopped out by noise.
Ensures protection against sudden bullish reversals or fakeouts.
🔹 Take Profit Targets:
✅ First Target: 0.006500 (Psychological level)
✅ Final Target: 0.006448 (Triangle measured move)
🔹 Risk Management:
Use a Risk-to-Reward ratio (RRR) of at least 1:2 for an optimal trade setup.
Never risk more than 2% of total capital per trade.
⚠️ Market Outlook & Key Watchpoints
📌 Scenario 1: Bearish Continuation (High Probability)
If price retests the broken support and faces rejection, expect further downside.
Target remains at 0.006448.
📌 Scenario 2: Fake Breakdown & Bullish Reversal (Low Probability)
If price closes above 0.006750, it invalidates the bearish setup.
In that case, a bullish move towards 0.006800+ is possible.
📢 Final Thoughts:
The bearish breakout is clear, but waiting for a proper pullback before entry is ideal.
Volume confirmation is crucial to avoid fakeouts.
If support turns into resistance, a high-probability short trade is set up.
🔹 What’s your take on this setup? Will JPY/USD reach its target? Drop your thoughts below! 🚀
#JPYUSD #ForexTrading #TechnicalAnalysis #PriceAction
Gold (XAU/USD) – Triangle Breakout & Bullish Trade Setup Overview
This 1-hour Gold Spot (XAU/USD) chart showcases a well-defined symmetrical triangle pattern, which has successfully broken out to the upside. This breakout indicates strong bullish momentum, setting up a potential rally towards $3,107 and beyond.
The analysis below will cover:
✅ Triangle Pattern Formation & Breakout Explanation
✅ Key Technical Levels (Support, Resistance, ATH)
✅ Entry, Stop Loss, & Take Profit Strategies
✅ Risk Management Considerations
✅ Final Trade Setup & Market Sentiment
Let’s dive into the details.
1️⃣ Chart Pattern: Symmetrical Triangle Formation
What is a Symmetrical Triangle?
A symmetrical triangle is a common continuation pattern in technical analysis that forms when price consolidates within two converging trendlines. This structure indicates a period of indecision in the market before a potential breakout occurs.
When price breaks above the upper trendline, it signals a bullish continuation.
If price breaks below the lower trendline, it suggests a bearish move.
In this case, gold has broken above the upper resistance trendline, signaling a continuation of the existing uptrend.
Pattern Breakdown (Step by Step):
Triangle Formation: The price made higher lows and lower highs, compressing within the pattern.
Price Squeeze: As the market approached the apex of the triangle, volatility decreased, indicating an imminent breakout.
Breakout Confirmation: A strong bullish candle closed above the resistance trendline, validating the pattern and confirming bullish momentum.
2️⃣ Key Technical Levels & Zones
🔹 Support & Resistance Zones:
Support Level: $3,012 - $3,020 (Highlighted as a strong demand zone where buyers stepped in).
Resistance Level: $3,080 (Previously acted as strong resistance but has now turned into support post-breakout).
All-Time High (ATH): Marked just below $3,090, where price previously struggled to break through.
🔸 Breakout Target & Price Projection
Breakout Level: The breakout happened above $3,080, confirming an uptrend continuation.
Target Calculation:
The height of the triangle is projected upwards from the breakout point.
This gives us a price target of $3,107 - $3,120 in the short term.
3️⃣ Trading Strategy Based on Breakout
✅ Entry Strategy:
Aggressive Entry: Entering immediately after the breakout candle closes above $3,080, riding the momentum.
Conservative Entry: Waiting for a potential pullback to $3,080 (now acting as support) before entering a long position.
⛔ Stop Loss Placement:
Ideal Stop Loss: Below the previous support zone at $3,012, ensuring protection against fake breakouts.
Tighter Stop Loss: Just below the breakout point at $3,065, in case of a minor retracement before moving higher.
🎯 Profit Target Strategy:
Short-Term Target: $3,107, based on the triangle’s measured move.
Extended Target: If momentum sustains, $3,120+ could be achieved, aligning with previous bullish trends.
4️⃣ Risk Management & Market Considerations
Risk Factors to Monitor:
🔸 Volume Confirmation: A breakout with high trading volume is a stronger signal than one with low volume.
🔸 Market Fundamentals: Events like US inflation data, Federal Reserve rate decisions, and geopolitical tensions can impact gold prices.
🔸 False Breakout Risk: If price falls back below $3,080, the breakout might be invalid, signaling a potential reversal.
Risk-Reward Ratio:
📌 Entry: $3,080
📌 Stop Loss: $3,012 (Approx. 68 points risk)
📌 Target: $3,107 - $3,120 (Approx. 27-40 points reward)
📌 Risk-to-Reward Ratio: 2:1+, making this a favorable trade setup.
5️⃣ Market Sentiment & Final Trade Setup
📈 Bullish Outlook:
The successful breakout above the symmetrical triangle signals continued bullish strength.
Price is holding above the previous resistance zone at $3,080, now acting as support.
The next resistance target is $3,107 - $3,120, aligning with previous swing highs.
🔴 Bearish Scenario (If Invalidated):
If price falls back below $3,080, it could indicate a false breakout.
A break below $3,065 might lead to a retest of the $3,012 support zone.
📊 Final Trading Plan:
✅ Buy (Long) at: $3,080 - $3,085
🎯 Target 1: $3,107
🎯 Target 2: $3,120+ (Extended Target)
⛔ Stop Loss: $3,012
🔥 Conclusion: Bullish Bias with Caution
Gold (XAU/USD) has successfully broken out of the symmetrical triangle, signaling a strong bullish continuation. As long as price holds above $3,080, the bias remains bullish, targeting $3,107 - $3,120.
💡 Key Takeaway: Watch for a pullback and retest of $3,080 before entering, ensuring confirmation before committing to the trade.
🚀 Final Outlook: Bullish – Gold is positioned for further upside if momentum continues!

Gold (XAU/USD) Technical Analysis – Triangle Breakout & Bullish Overview of the Chart
This chart presents a daily timeframe (1D) analysis of Gold (XAU/USD) and highlights a well-defined bullish trend supported by a breakout from a triangle pattern. The overall price action suggests a strong uptrend continuation, with clearly marked support and resistance levels, trendlines, and potential trade setups.
Gold has been consistently respecting key technical levels, forming higher highs and higher lows, which is a classic indicator of a strong bullish market. Traders can use this analysis to identify entry points, stop-loss levels, and profit targets for a strategic trading approach.
Key Technical Components in the Chart
1. Triangle Pattern Formation – The Setup for Breakout
One of the most crucial formations in this chart is the triangle pattern, which acts as a continuation pattern.
The triangle pattern (highlighted in green) represents a period of consolidation where price action was squeezing between higher lows and lower highs before a breakout occurred.
This pattern suggests that buyers and sellers were in equilibrium, building up momentum before gold made a decisive move to the upside.
The breakout above the upper boundary of the triangle confirms the bullish continuation, leading to a strong rally.
📌 Technical Significance: Triangle patterns are a reliable technical structure used by traders to anticipate breakouts. The breakout direction (upward in this case) determines the next trend phase.
2. Trendline Analysis – Defining Market Structure
The dashed black trendline represents the primary ascending trendline, which has been respected multiple times, indicating that the market remains in an uptrend.
Several minor support levels (highlighted in blue) have acted as strong demand zones, preventing price breakdowns and helping sustain the bullish momentum.
A major support zone (highlighted in beige at $2,300-$2,400) serves as the base of the uptrend, where price action historically reversed strongly, indicating heavy institutional buying.
📌 Technical Significance: As long as the price remains above these support levels, the uptrend remains intact.
3. Breakout & Price Action Structure – Momentum Confirmation
The breakout from the triangle pattern signaled the beginning of a new bullish impulse wave, and the price action structure confirms this move.
Higher Highs & Higher Lows: The black zig-zag pattern represents a strong bullish structure where each retracement finds support before continuing higher.
Price Movement Post-Breakout:
After breaking above the triangle’s resistance, gold started forming higher highs at an accelerated pace.
Minor pullbacks are bouncing off key support levels, providing re-entry opportunities for traders.
📌 Technical Significance: A breakout followed by sustained higher highs and strong buying pressure is a key bullish signal.
Trading Plan & Strategy
1. Entry Strategy – Ideal Buying Zones
Buy on Pullbacks:
Enter near minor support levels to take advantage of retracements.
This improves the risk-to-reward ratio and reduces exposure to sudden reversals.
Confirmation Signals:
Look for bullish candlestick patterns (bullish engulfing, pin bars, hammer candles).
Increased trading volume on bullish moves supports trend continuation.
2. Stop-Loss & Risk Management
📍 Stop-Loss: $2,661
Placed below the most recent minor support level to protect against downside risk.
If price breaks below this level, it may signal a trend shift or deeper correction.
📍 Why this Stop-Loss Level?
It ensures a tight risk control while allowing room for natural price fluctuations.
3. Take-Profit & Target Projection
📍 Target Price: $3,170
The measured move projection from the triangle breakout suggests a target near $3,170, which aligns with historical resistance.
If the price approaches $3,100-$3,170, traders should monitor for potential reversals or further breakouts.
4. Key Factors Supporting the Bullish Bias
✅ Uptrend Structure: The market is making higher highs and higher lows, which is a textbook sign of bullish momentum.
✅ Breakout Confirmation: The price has broken out of the triangle pattern and is sustaining higher levels.
✅ Support Levels Holding: Each pullback is being absorbed by buyers at well-defined support zones.
✅ Momentum & Volume: Increased volume and strong buying pressure indicate that the bullish trend is likely to continue.
5. Risk Management & Market Conditions
Market Sentiment:
If gold continues to hold above the support zones, further upside momentum is likely.
If price starts breaking below key support levels, it may signal a trend reversal or deeper correction.
Geopolitical & Economic Factors:
Gold prices are often affected by inflation data, interest rate changes, and global uncertainties.
Traders should monitor economic news that could impact gold’s trend.
Conclusion – A High-Probability Trade Setup
This analysis confirms that gold (XAU/USD) is in a strong bullish uptrend following a successful triangle breakout.
🚀 Trade Setup Summary:
✅ Entry: Buy on pullbacks at minor support levels
✅ Stop-Loss: $2,661 (Below support)
✅ Target Price: $3,170 (Next resistance level)
✅ Risk-Reward Ratio: Favorable setup with strong trend confirmation
🔹 Final Verdict: As long as gold remains above the minor support levels, the bullish bias remains strong, making this a high-probability long trade setup.
Would you like to add any additional indicators (RSI, MACD) for confirmation? 📈

Descending triangle + Bullish divergencePrice is stalling. I will wait for a clear breakout to the upside
