CVX & XOM: The Bull case for OilI review the the Daily and Weekly charts on CVX & XOM, showing tradable patterns that they have formed since 2022. These are longer term trading patterns but are still active and fun to watch.
Trianglepattren

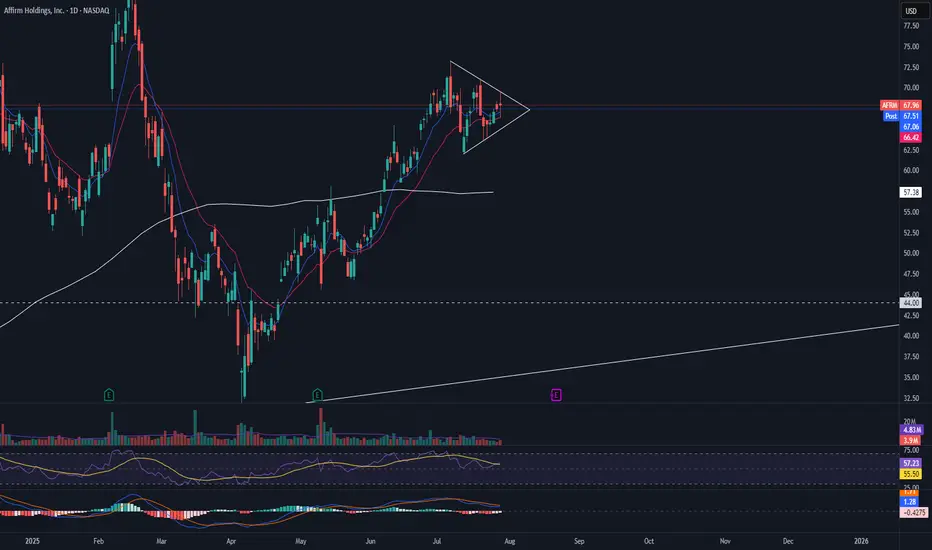
AFRM pre earnings triangleAFRM is currently in a symmetrical triangle with RSI and MACD beginning to show the pattern may come to an end. I would want to see this triangle break with volume before entering a long position.
Gold – Bear-to-Bull Transition in Motion?🧠 MJTrading:
TVC:GOLD – 8H Chart: Bulls, It’s Your Move.
📸 Viewing Tip:
🛠️ Some layout elements may shift depending on your screen size.
🔗 View the fixed high-resolution chart here:
The impulsive move from 3000 to 3500 wasn’t just a trend — it was a statement of strength.
That rally carved the ATH, then left behind weeks of digestion and structural compression.
Now, the market may be setting up for its next decision.
Notice how each bearish leg has been shrinking — a classic behavioral signal that sellers are losing momentum — possibly a shift in control underway.
We’re also pressing above the downtrend line from the ATH (3500), while the uptrend from 3000 remains clean and respected.
We’re now testing the 3400 zone — a key battleground.
📍 If bulls want to reclaim the momentum and show dominance, this is the moment to act.
🔹 1st Support: 3363–3377
🔹 2nd Support: Rising trendline
🎯 Target Zone: 3455–3500+ (Liquidity Pool & ATH proximity)
⚠️ Break back inside the triangle could delay the breakout narrative.
⚠️ If momentum fails to increase from here, and bulls can’t break out with conviction, the market is likely to remain range-bound for longer — extending the sideways phase between 3250–3500.
💭 If you’re watching for a new ATH… stay sharp, stay structured — the market rewards patience and readiness.
“If the structure speaks to you, let it echo, boost it.”
📐 MJTrading 🚀
What do you think?
#GoldAnalysis #XAUUSD #MarketStructure #LiquiditySweep #AnythingCanHappen
#MJTrading
#ChartDesigner
Psychology Always Matters:
Click on them for the caption...

XAUUSD SEEMS TO ESTABLISH NEW BULLISH IMPULSEXAUUSD SEEMS TO ESTABLISH NEW BULLISH IMPULSE
The recovery of the gold market appears to have gained momentum in recent days. This has resulted in the precious metal surpassing what appears to be a triangular pattern.
What is a triangle pattern?
A triangle pattern is a chart pattern with converging trendlines, signaling consolidation before a breakout. Types: Ascending (bullish, flat top, rising bottom), Descending (bearish, flat bottom, declining top), Symmetrical (neutral, both trendlines converge). To trade: Identify the pattern (two touches per trendline), wait for a breakout with volume, enter after confirmation, set stop loss below (long) or above (short) breakout, and target the triangle’s height projected from the breakout.
From here, a break above the June high of 3,450.00 would increase the probability of a further rise toward the record high near 3,500.00. But before that slight decline towards upper border of the symmetrical triangle with further rebound is expected.

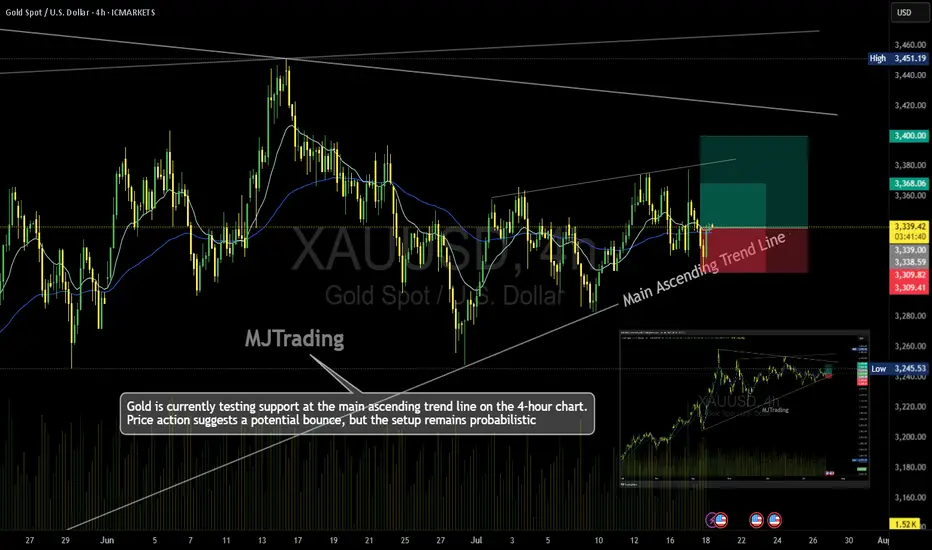
Gold (XAU/USD) – 4H Time Frame Trade Idea📈MJTrading:
Gold is currently testing support at the main ascending trend line on the 4-hour chart. Price action suggests a potential bounce, but the setup remains probabilistic—ideal for traders who operate on higher time frames and manage risk with discipline.
🔹 Trade Setup
Entry: 3340
Stop Loss: 3309
Take Profit 1: 3368
Take Profit 2: 3400
🔍 Technical Context
Price is respecting the long-standing trend line, hinting at bullish continuation.
Risk-reward ratio is favorable, especially for swing traders.
A break below the trend line invalidates the setup—hence the tight SL.
⚠️ Note: While the trend supports upside potential, failure to hold the trend line could trigger deeper retracement. Trade the probabilities, not the certainties.
In case it's not shown properly on your monitor because of different resolutions:
Psychology Always Maters:
#MJTrading #Gold #XAUUSD #Trend #Trendline #Forex #Chart #ChartAnalysis #Buy #Long
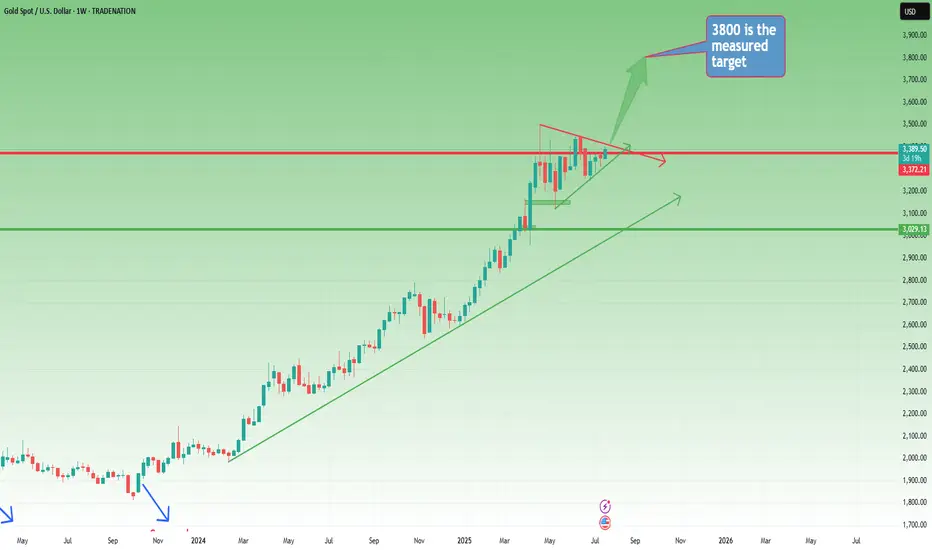
Weekly Outlook: Gold Builds Pressure – Is the Big Move Coming?📆 Big Picture View
Since the start of 2024, Gold has been moving in a well-defined long-term bullish trend.
Yes, there were meaningful pullbacks along the way — but the direction was never in doubt. Step by step, Gold climbed over 15,000 pips in just over a year, reaching a new all-time high in late April.
📉 Post-ATH: A Period of Stabilization
After peaking, Gold shifted into consolidation mode, with price gravitating around the 3300 zone.
This sideways movement has been ongoing for the past three months, but it’s not a sign of weakness — it’s the market catching its breath.
On the weekly chart, this consolidation is now forming a symmetrical triangle, a classic continuation pattern that often appears mid-trend.
📐 The Technical Setup
- The symmetrical triangle shows compression of volatility
- Buyers and sellers are slowly converging toward a decision point
- A breakout is approaching, and when it comes, it could be explosive
🎯 What’s the Trigger?
- A confirmed break above 3450 would validate the triangle breakout
- That opens the door to quickly test the 3500 round figure
- The measured target for the triangle sits at 3800
Given the time Gold has spent consolidating (3+ months), this target could realistically be reached by year’s end
🧭 Strategic Takeaway
- As long as Gold holds above 3300, the bullish structure remains valid
- Breakout above 3450 is the green light for the next leg up
- Until then, the consolidation continues, and smart money prepares
📌 Conclusion:
Gold is building pressure. The weekly triangle is maturing.
This isn’t the end — it’s the pause before the next move.
Stay patient. Stay focused.
Because if 3450 breaks… 3800 is not a dream — it’s a destination. 🚀
Disclosure: I am part of TradeNation's Influencer program and receive a monthly fee for using their TradingView charts in my analyses and educational articles.
P.S: Here you have a short term analysis on Gold
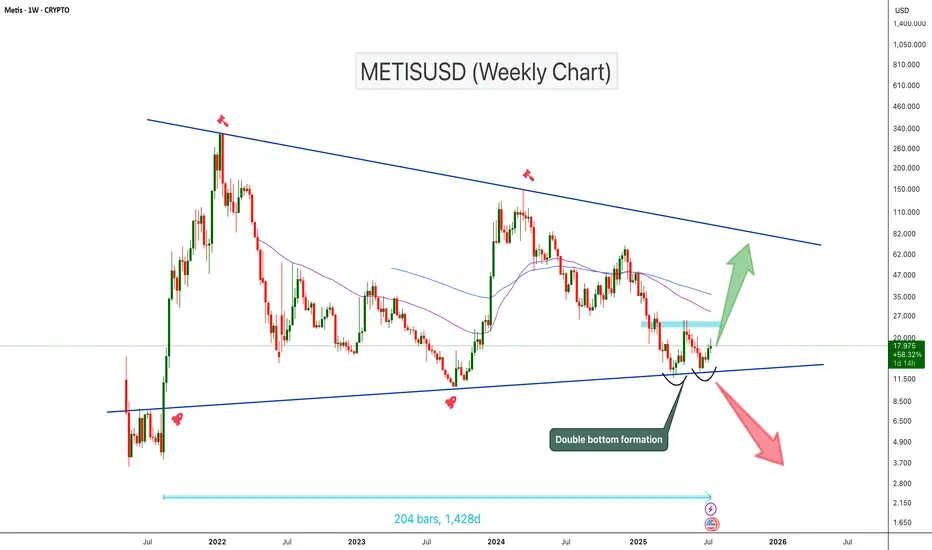
METISUSD Double Bottom at Triangle Support!METISUSD has been trading inside a symmetrical triangle for the past 1,400 days. The price is currently sitting at the triangle support and forming a potential double bottom pattern. The double bottom can be confirmed once the price breaks the neckline resistance zone. If the price breaks this key resistance zone, we could expect a 100%–250% bullish move toward the triangle’s upper resistance
Cheers
Hexa🧘♀️
BINANCE:METISUSDT SEED_DONKEYDAN_MARKET_CAP:METIS
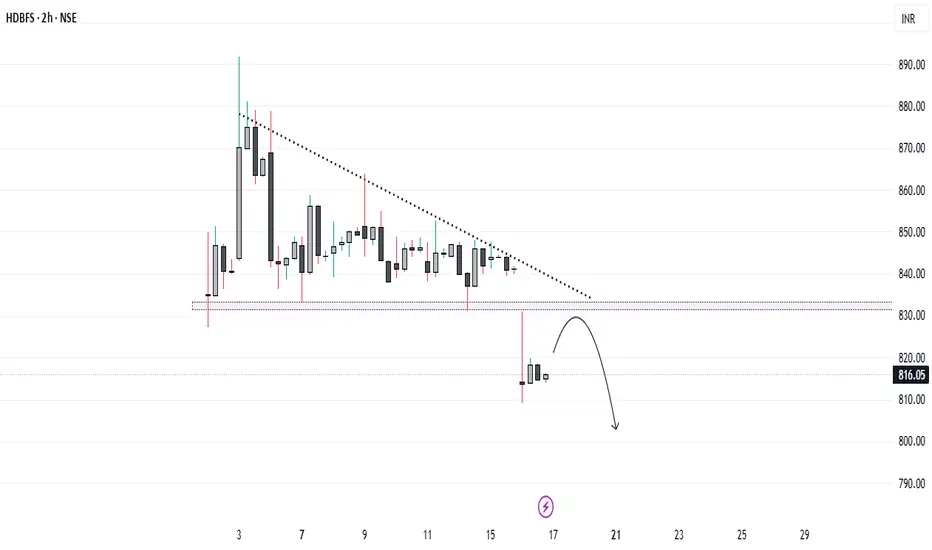
HDB Financial: Strategic Entry Near IPO Price After Breakout...!HDB Financial Services, recently listed at a 12.8% premium over its issue price of ₹740, has shown promising technical movement. After a period of sideways consolidation, the stock has broken out of a descending triangle pattern—an encouraging sign for potential downside momentum.
For long-term investors and swing traders, the ₹740 level presents a strategic entry point. This level, being the IPO issue price, is likely to act as a strong support zone. Investors looking to accumulate quality stocks can consider initiating a position near this level, with a long-term perspective or for a medium-term trade setup, depending on individual risk profiles.
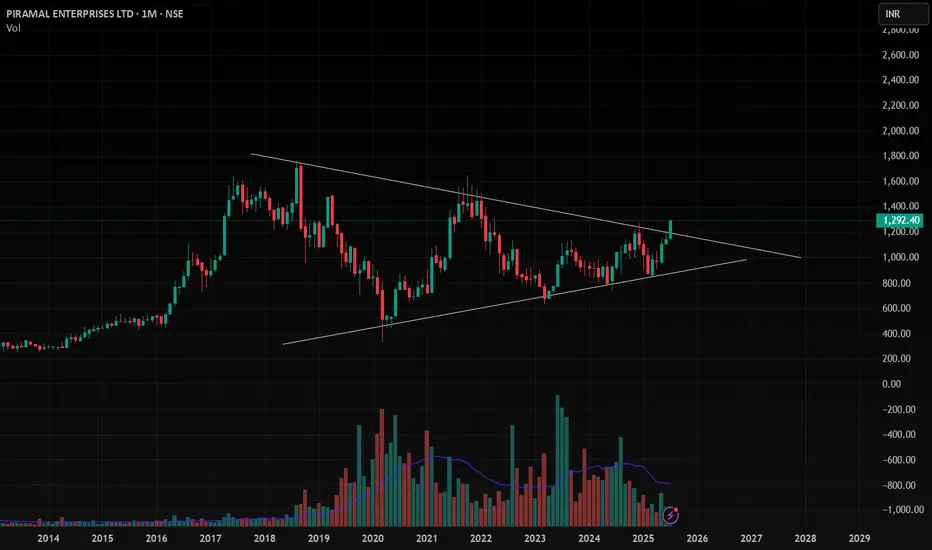
PEL , 1M , BullishThe Triangle Pattern is Breaking Out in Monthly Time Wait for Strong and Perfect close in Weekly Time and Enter after Confirmation .
Take Risk According to your capital
Follow for more ideas like this
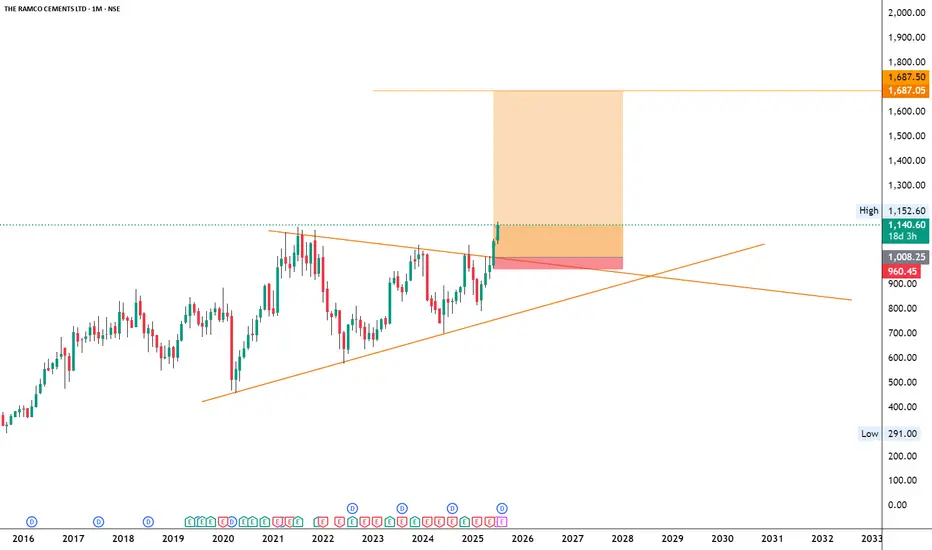
RAMCOCEM
NSE:RAMCOCEM
Note :
1. One should go long with a Stop Loss, below the Trendline or the Previous Swing Low.
2. Risk :Reward ratio should be minimum 1:2.
3. Plan your trade as per the Money Mangement and Risk Appetite.
Disclamier :
>You are responsible for your profits and loss.
>The idea shared here is purely for Educational purpose.
>Follow back, for more ideas and their notifications on your email.
>Support and Like incase the idea works for you.
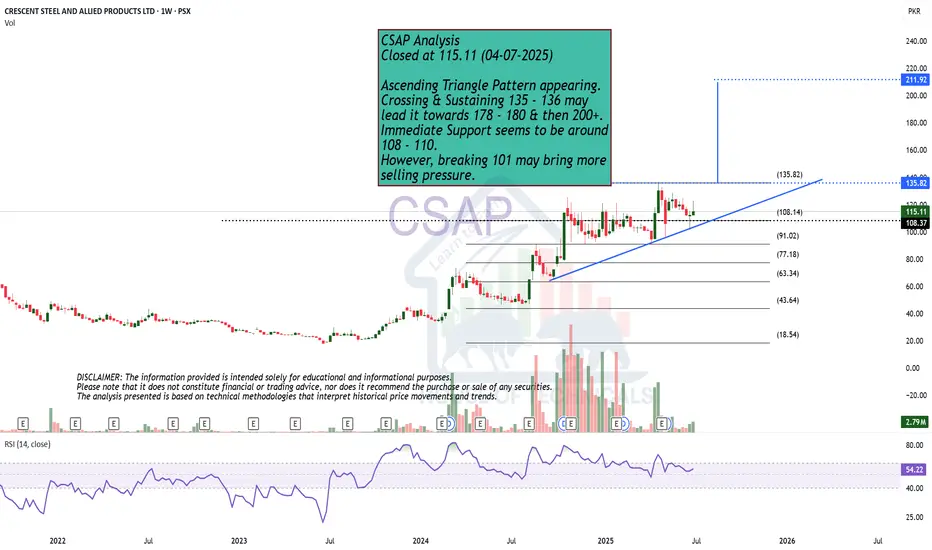
Ascending Triangle Pattern appearing.CSAP Analysis
Closed at 115.11 (04-07-2025)
Ascending Triangle Pattern appearing.
Crossing & Sustaining 135 - 136 may
lead it towards 178 - 180 & then 200+.
Immediate Support seems to be around
108 - 110.
However, breaking 101 may bring more
selling pressure.
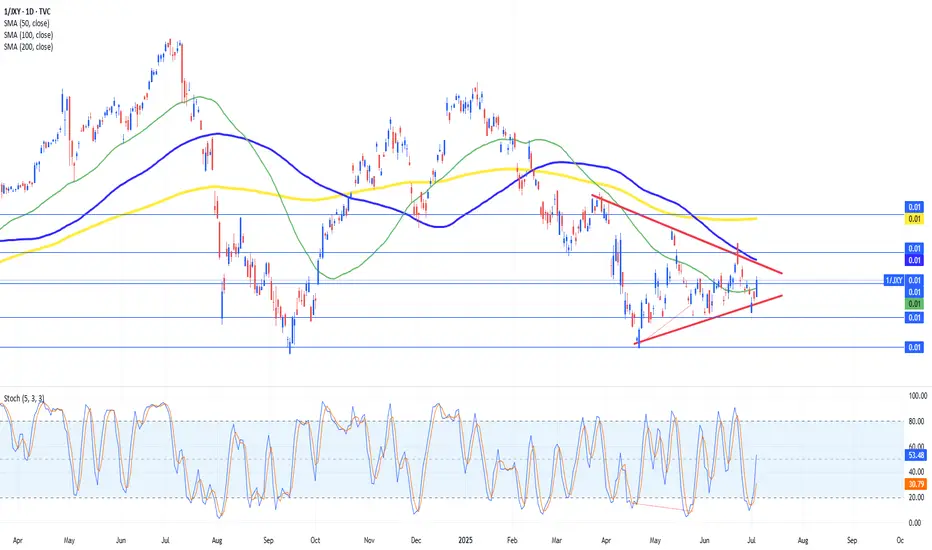
USDJPY Converges in Triangle Ahead of Potential BreakoutUSDJPY on the daily chart is coiling within a textbook contracting triangle, with support ascending near 143.00 and resistance compressing downward toward 147.00. This symmetrical structure suggests traders are awaiting a decisive catalyst, as volatility has steadily declined alongside rangebound price action.
Recent sessions show USDJPY respecting both its triangle boundaries and key moving averages. The 50- and 100-day SMAs near 145.00 have capped advances, while buyers have consistently defended dips toward 143.00. Price remains inside the triangle’s narrowing apex, hinting that a breakout could be imminent.
Technically, the pair has followed recent divergences between price action and the stochastic oscillator. RSI remains neutral near 49, offering little directional bias, while ATR confirms the tightening range with sharply falling volatility.
If bulls manage to push past 147.00 and the descending trendline, momentum could accelerate toward 149.00. Conversely, a daily close below 143.00 would invalidate triangle support and open the path toward 141.00. Until then, USDJPY may continue oscillating between these boundaries.
Fundamentals now favor the dollar, after stronger-than-expected U.S. jobs data showed 147,000 new positions added in June, beating forecasts. While private hiring slowed, the drop in unemployment to 4.1% supports a cautious Fed, likely delaying a rate cut until at least September. This labor resilience underpins near-term dollar strength.
With sentiment and structure aligning, USDJPY’s breakout from this triangle pattern may shape its next major move. Traders should watch for price and volatility confirmation above 147.00 or below 143.00.
NZD_JPY WAIT FOR BREAKOUT|LONG|
✅NZD_JPY is trading in an
Uptrend and the pair has formed
A bullish triangle pattern
And we are bullish biased
So IF we see a bullish breakout
It will be our signal that
A bullish continuation is
Likely and we will be
Able to enter a long trade
LONG🚀
✅Like and subscribe to never miss a new idea!✅
Disclosure: I am part of Trade Nation's Influencer program and receive a monthly fee for using their TradingView charts in my analysis.

BEMLNSE:BEML
Note :
1. One should go long with a Stop Loss, below the Trendline or the Previous Swing Low.
2. Risk :Reward ratio should be minimum 1:2.
3. Plan your trade as per the Money Management and Risk Appetite.
Disclaimer :
>You are responsible for your profits and loss.
>The idea shared here is purely for Educational purpose.
>Follow back, for more ideas and their notifications on your email.
>Support and Like incase the idea works for you.

NMDCNSE:NMDC
Note :
1. One should go long with a Stop Loss, below the Trendline or the Previous Swing Low.
2. Risk :Reward ratio should be minimum 1:2.
3. Plan your trade as per the Money Management and Risk Appetite.
Disclaimer :
>You are responsible for your profits and loss.
>The idea shared here is purely for Educational purpose.
>Follow back, for more ideas and their notifications on your email.
>Support and Like incase the idea works for you.

Elliott Wave Insight Into EUR/USD’s Recent MovesThe EUR/USD chart has delivered a clean Elliott Wave sequence, which helps us forecast what may come next.
Wave Count Overview
The structure leading up to the high shows a clear five-wave impulsive rally, ending at Wave 3 in yellow.
This was followed by a corrective A-B-C zigzag, with:
A sharp Wave A down
A shallow Wave B bounce
A clean Wave C drop, matching Wave A in length, bottoming at the 100% Fibonacci projection around 1.10711.
Why This Matters
Elliott Wave theory tells us that a completed zigzag correction—especially when followed by a consolidation like a triangle—often leads to a continuation in the direction of the larger trend. If this consolidation is indeed a Wave 4 triangle, Wave 5 may soon emerge with strength.
What to Watch For:
Breakout from the current flag/triangle pattern.
Confirmation via price closing above the Wave B high.
Strong bullish momentum and rising volume as signs Wave 5 is kicking off.
Conclusion
EUR/USD may be gearing up for a Wave 5 breakout, following a classic zigzag correction and potential triangle consolidation. If this pattern breaks to the upside, it could offer a great trend continuation trade opportunity.

EUR/CHF Triangle Setup- Breakout or Breakdown ImminentThe EUR/CHF pair is currently consolidating within a triangle pattern on the 1-hour chart. This type of pattern typically forms when neither buyers nor sellers are in full control, leading to a tightening price range between descending resistance and ascending or flat support. In this case, the resistance trendline (marked in red) is sloping downward, while the support zone (highlighted in green) remains relatively flat around the 0.9330–0.9335 region.
The repeated tests of both resistance and support lines suggest that a major breakout or breakdown is likely approaching. The height of the triangle (measured from the initial impulse move) provides the basis for projecting potential breakout and breakdown targets.
🔼 Breakout Scenario (Bullish):
If price breaks above the descending resistance line, especially with volume confirmation, it may trigger a bullish move toward the breakout target of 0.9406. This level is calculated by adding the height of the triangle to the breakout point. Traders could look for buying opportunities upon breakout with stops placed below the breakout candle or just under the triangle.
🔽 Breakdown Scenario (Bearish):
Alternatively, if price breaks below the flat support zone, a bearish continuation is expected, targeting 0.9281, which is derived by subtracting the triangle's height from the breakdown level. This would indicate sellers regaining control, and the pair may revisit recent swing lows. A breakdown with strong bearish candles would validate this move.
📌 Strategy Notes:
This is a neutral-to-directional setup, meaning traders should wait for a confirmed breakout or breakdown before entering.
Volatility contraction inside the triangle typically precedes an explosive move.
Entry can be taken post-breakout with volume, or with a retest of the broken trendline for confirmation.
===============================================================
Disclosure: I am part of Trade Nation's Influencer program and receive a monthly fee for using their TradingView charts in my analysis.

JPY/USD Weekly Chart – Bullish Triangle Breakout Pattern Forming🔍 Chart Pattern Breakdown:
The chart is showing a symmetrical triangle pattern forming on the weekly timeframe of JPY/USD (Japanese Yen vs. US Dollar). This triangle is developing after a massive multi-year downtrend, which started all the way back in 2021. Such a triangle at the bottom of a trend often signals a potential reversal or a strong trend shift.
Here's what's happening technically:
🔺 Triangle Formation (Consolidation Phase):
Lower highs and higher lows indicate a clear symmetrical triangle.
The price has been bouncing between these converging trendlines for months.
This compression is like a spring — it’s storing energy and getting ready to break out.
The triangle pattern is nearing its apex, which means a breakout is likely soon.
📉 Previous Trend Context:
Before the triangle, the market had a strong bearish move — a downtrend that brought the pair into a major weekly support zone.
This support zone (marked in light blue) around 0.0062–0.0063 has been tested and respected multiple times.
📊 Key Technical Zones:
Support Zone: 0.0062 – 0.0063 — this is where price bounced and formed the base of the triangle.
Resistance Zone / Triangle Top: Around 0.0071 – this is the upper boundary of the triangle. A breakout above this will confirm the bullish scenario.
Target Area: 0.00829 – derived from measuring the height of the triangle and projecting it from the breakout point.
Major BOS (Break of Structure): Once price breaks above the triangle and the BOS line, it confirms a shift from bearish to bullish structure.
SL Zone: Stop loss area is just below the support zone at 0.00629 to protect against false breakouts.
🔁 Retest Setup:
After the breakout, it's common to see a pullback to retest the previous resistance (now turned support). That retest often provides a high-probability entry for swing and position traders. If it happens — that’s your golden moment!
🎯 Trade Plan (Example for Education):
Entry Criteria Value/Zone
Breakout Entry Above 0.0071 (confirmed candle close)
Retest Entry 0.0069 – 0.0070 (support flip)
Stop-Loss (SL) Below 0.00629
Target (TP) 0.00829
✅ Why This Setup Matters:
Clear structure on the weekly chart.
Multi-touch points on both trendlines = strong pattern.
Support zone backing the triangle base gives extra conviction.
A breakout from such consolidation patterns often results in sharp movements.
Risk/reward ratio is highly favorable.
⚠️ Risk Management Reminder:
Always trade with a plan, use a stop-loss, and don’t jump into the breakout blindly. Volume confirmation or retest confirmation will help increase the success rate. These kinds of setups are powerful, but only when approached with discipline.
🧠 Final Thoughts:
This JPY/USD triangle on the weekly chart is a textbook example of potential bullish reversal from a major downtrend. It’s showing signs of a structural shift, supported by strong support, tightening price action, and the chance for a breakout to deliver a major upside move toward 0.00829.
If you’re a swing or position trader, keep this on your radar. Momentum is building — don’t miss the move when the breakout hits. 📈🔥

GOLD → Need to break Triangle Pattern !!!Gold Analysis
Following a rejection at the 3,120.00 level last Thursday — a key H4 demand zone — gold is currently forming a triangle pattern.
🟢 Bullish Scenario:
If the price breaks above the 3,250.00 level, it may present a buying opportunity with the nearest target at 3,320.00 .
🔴 Bearish Scenario:
If the price breaks below the lower trendline of the triangle pattern, the nearest selling target is seen around 3,055.00.
Best Regard

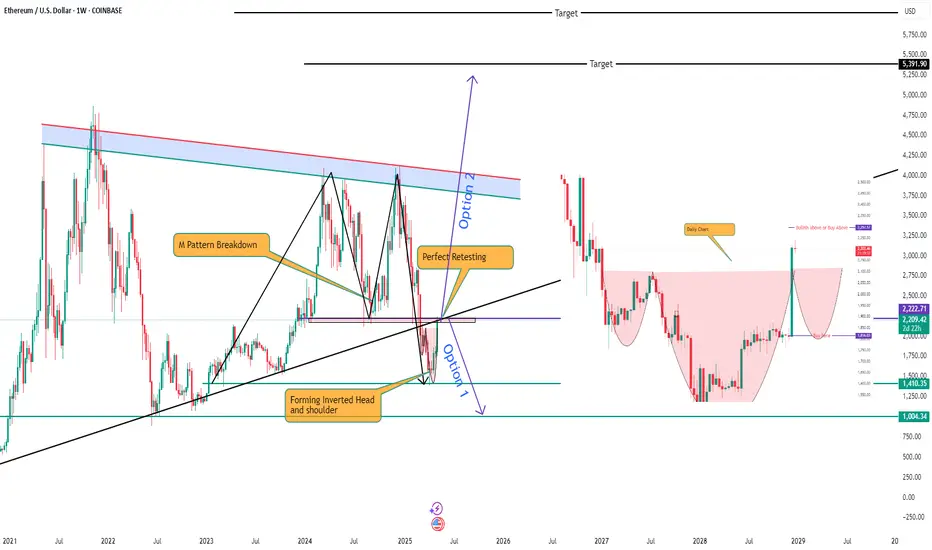
Ethereum - Perfect exactly how I thoughtEthereum
Stage 1 - Triangle Pattern - Gave perfect breakdown of triangle pattern
Stage 2 - Form M Pattern - Have almost completed the selling target
Stage 3 - Retesting completed *Current)
Stage 4 - Forming inverse cup and handle and inverted head and shoulder pattern
Stage 5- in either of the scenario it may come down but if it goes above 2297 expect it to reach 4000/500/7000 in coming days
Stage 5.2 - if the retesting is completed and bearish patter is continued expect it to reach to 900 USD
For more details ping me
GK Trade manthan
A larger corrective pattern is formingIn the previous analysis, a specific range was determined for the price to reverse, after reaching that price range, the price jumped upwards and the price grew by 1700 pips. However, considering that the structure of wave-c is not an impulse, the zigzag was not confirmed and it seems that a larger corrective pattern is forming.
It seems that the reverse contracting triangle pattern is forming, which is currently in wave-d of the triangle. With the completion of wave-d, we can better find the end point of wave-e.

"ZEC Analysis" Currently, ZEC is forming an ascending triangle, indicating a potential price increase. It is anticipated that the price could rise, aligning with the projected price movement (AB=CD).
However, it is crucial to wait for the triangle to break before taking any action.
Give me some energy !!
✨We spend hours finding potential opportunities and writing useful ideas, we would be happy if you support us.
Best regards CobraVanguard.💚
_ _ _ _ __ _ _ _ _ _ _ _ _ _ _ _ _ _ _ _ _ _ _ _ _ _ _ _ _ _ _ _
✅Thank you, and for more ideas, hit ❤️Like❤️ and 🌟Follow🌟!
⚠️Things can change...
The markets are always changing and even with all these signals, the market changes tend to be strong and fast!!

Bajajfinance holding periods decades#bajfinance will break out of this two year triangle, has a huge potential for long run of becoming blue-chip stock,
