BTC in expanded triangleBTC in expanded triangle, After several weeks of lows, we have an exhaustion gap near the wedge
Trianglepattren

Ascending Triangle pattern on GMT/USDTHello guys, Today i saw a bullish Ascending triangle on STEPN and i thought it will be a good long setup.
first position is when the price hits trend line and goes to resistance area , open your long position between 0.9400 and 0.9600(you can open short position now from 0.9787 to trend line).
wait until the price hitting the Resistance area and close your position safely.
second position is after break out , open your short position at 1.0000 and close it after hitting the Support zone.
it's just an idea , always do your research and analysis.
don't forget to follow and boost this idea :) thank you.

Simple Ascending TrianglesJust a look at some ascending triangles forming on the BTC chart over the last couple of weeks. It just touched on the bottom trend line again in the past 24 hours, so I'm looking for a bounce up from here to the upper line. If we break below, than the triangles fall apart. Also looking for volume to increase as the lines converge, for a break to the upside. Otherwise, low volume could see the price reverse. I will be keeping an eye out for these triangles to narrow over the next week or two before reaching a head. This is a borderline rising wedge shape, but seeing as it is relatively flat on the top line, and the rising price from the prior two weeks, this looks to be a continuation in my eyes.
If the price does rise to the vertex, it should bring the price just above a big resistance level, and seeing as there isn't much resistance beyond that from ~$26k to ~$28k, breaking that could be more impetus for the price to break to the upside.

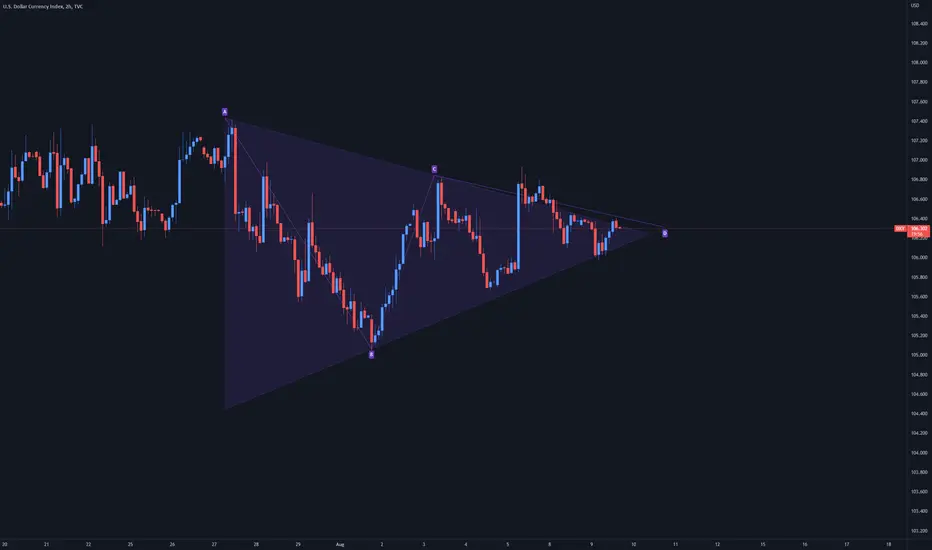
Triangle Formation on DXY on 8/9/22I enjoy trading many technical patterns, but this one I am not a fan of trading until price action shows a non-neutral trending structure. Therefore, I will only be monitoring DXY.
Equilateral Triangle Pattern: This is when the price action s neutral (flat) due to the price trending in both directions at the same time. Typically many fake outs happen with triangle formations, so it is very important to include a price filter when trading this.
Cadchf long....Looking for the simultaneous break of the double bottom pattern and the triangle to long for 3.05R....Like and Subscribe.

VENKEYS EXPLOSION MOVE 75% UPSIDE ^^^VENKEYS India has given a breakout and retesting its previous levels
Reason to enter the trade
1. Breakout
2. Retesting
3. High volume
4. Daily timeframe
I HAVE EXPLAINED EVERYTHING ON THE CHART FOR MY VIEWERS SO THEY CAN EASILY GRAB THE OPPORTUNITY
AND SHARE IT WITH YOUR FRIENDS SO THEY CAN ALSO TAKE BENEFIT OF IT

NET - Breakaway Gap (huge volume!)NET gap out of a right angle triangle with extremely huge volume. This is likely to be a "breakaway gap" which usually occurs at the beginning of a trend and the odds of this gap closing in the near future is slim.
There is a near term possible resistance coming up (filling of a prior gap) at around 77-78. Any dips going forward should be opportunity to long as there is room on the upside.
Disclaimer: Just my 2 cents and not a trade advice. Kindly do your own due diligence and trade according to your own risk tolerance and don't forget that money management is important! Take care and Good Luck!

BB breaking out on all fronts.Of course, this will likely reverse if spy reverses, but fingers crossed.

maxhealthMaxhealth broke out of traingle pattern on daily/hourly charts with good volumes.
Could be bought with mentioned stoploss & target.

USDCAD Bulls in control?After the failure for the bears to go down after the ascending triangle breakdown, will the supply zone hold?
It can also be seen as a bear flag, considering the big downtrend it comes from.
But the move down definitely failed. Waiting for a move higher and a retest.

ETHUSDTHi Guys!
here we see a descending channel(ETHUSDT;D1)
and the price have touched the top of the channel
if the price breaks the HL it may go down to the bottom of the descending channel :)
The analysis is based on the Elliot Waves and Elliot patterns TOO ]:

CenturyTex Traingle Pattern near breakout on daily time frame going to break beautiful tringle pattern on a daily time frame good opportunity to go long for swing trading if break strong

TWT Multi-Year Triangle Pattern Calls for $1.4 TargetSince its inception, Trust Wallet Token (TWT) entered into a long period of consolidation, developing a symmetrical triangle formation. The multi-year symmetrical triangle pattern now calls for a retest of the upper resistance level around the $1.4 level.
Symmetrical Triangle Pattern
This multi-year pattern has the potential to continue driving the price action in the coming months unless we get a clear breakout on either side of the symmetrical triangle. First, TWT's price made a base near the $0.30 level, which was followed by a powerful uptrend topping out at $1.65.
A subsequent sell-off pushed TWT's price down to around the $0.45 level, generating another base from where we rallied again, but failed to reach the previous high. TWT topped again at $1.40 and sold off to $0.55 to form another base.
In the short-term, we have left the base, and if the same pattern repeats again then the current rally could fall below the March 2022 high of $1.40.
A weekly break and close above the $1.00 psychological level has the potential to cement the bullish case scenario.
RSI Oscillator
The weekly RSI has also broken above the 50 mid-level; the last two times this signal occurred, we had two powerful rallies. The bulls have the upper hand as long as the weekly RSI continues to print positive momentum readings.

LPTUSDT Symmetric Triangle!LPTUSDT technical analysis update
LPTUSDT currently trading at $9.80.
Buy Zone: Below 9.95
Stop loss: $8.56
TP 1 : $10.80
TP 2 : $11.90
TP 3 : $13.40
Always keep stop loss
Thanks
Hexa

Looking At Some Symmetrical TrianglesTwo symmetrical Triangles,
One on the left showing price poised above the higher trend line, which will likely lead to bull continuation as indicated by the green arrow
The one on the right shows a stronger breakout
Both of these scenarios are bullish and follow well with the bullish nature of symmetrical triangles

Tow Away is For ETH Price - Range or PumpHey to Tradinview users I gald to be Well!
ETH have tow way in Next
ETH will range i think
but the second idea is pump for Ethereum if ETH can breakout triangle we will see a big pump for Ethereum that can pump eth to 2k
Its not a signal just an Idea!

MICROSOF SHORT POSITIONMicrosoft Corp. is in a symmetrical triangle.
We expect the breakout to the downside if upcoming earnings are negative.
Target shown in the chart.

Silver long....Am waiting from the bullish 4H momentum break of the confluence zone (blue).
Entering on retest for a quick 3.02R.....scale-in brings in extra 0.5R.....
Like and Subscribe.

Balkrishna Industries forming Triangle pattern in daily TFBalkrishna industries has formed triangle pattern in a daily time frame if strongly broke expect higher higher targets

two triangle Set Up.When Price reaches an extreme it will turn back 80% of the time.
Therefore we leverage this wisdom and apply a simple Two triangle Pattern Set up.
The first triangle creates the high. The second triangle peak will create second High but lower : this is your entry.
10:30am we are in a FREE FALL. Pick your entry. Cause she's dropping it like its HOTTT!!!!
Never over Leverage.
trust your trade set up.
Have Fun!
And have a GREAT Weekend.
I Am Pro Trading Made SIMPLE

TRXUSD - Symmetrical Triangleprice is entering a crucial phase of this Symmetrical Triangle on this 4Hr time period
Break out of this triangle will push TRX to new highs

Nikkei - 4 Hour - Triangle Breakout We're seeing this setup across a few indices but here on the Nikkei we've recently had a completed ascending triangle pattern which has broken to the upside & is now starting to consolidate.
My initial prediction was that IF we break to the upside from this ascending triangle THEN we're likely to continue higher.
Now the question is IF we're likely to continue higher THEN where are we likely to go & how are we likely to get there.
The answer to the first question is our most recent major level of structure resistance & the answer to the second question is either by a pullback to previous structure resistance (now turned potential support) or by the formation of a high & tight flag pattern followed by another breakout.
Hope this idea was helpful. if you have any questions, comments or want to share your opinion fee free to leave them in the comment section below.
Also, if you're around I host a TRADE OF THE DAY Live Stream here on Tradingview each Tues, Wed & Thurs at 7:30 am NY, 12:30pm UK time. Feel free to join the discussion.
Akil

BTC/USDT broke the triangle to Go higher levelgood morning From lovely Iran
if you can read the chart so good for cause everything is on the chart.
if you can't see well, we have great triangle pattern that is active now and its going to higher levels according , the base of the triangle that is about 29%, and there are very strong resistance which is Flat senko B on ichimocu daily setup...
so good luck traders.
