GRASIMNSE:GRASIM
Note :
1. One should go long with a Stop Loss, below the Trendline or the Previous Swing Low.
2. Risk :Reward ratio should be minimum 1:2.
3. Plan your trade as per the Money Management and Risk Appetite.
Disclaimer :
>You are responsible for your profits and loss.
>The idea shared here is purely for Educational purpose.
>Follow back, for more ideas and their notifications on your email.
>Support and Like incase the idea works for you.
Trianglepattren

GBP-AUD Bearish Triangle Pattern! Sell!
Hello,Traders!
GBP-AUD has formed a
Bearish triangle pattern
So we are bearish biased
And IF we see a bearish
Breakout then we will be
Expecting a further
Bearish continuation
Sell!
Comment and subscribe to help us grow!
Check out other forecasts below too!
Disclosure: I am part of Trade Nation's Influencer program and receive a monthly fee for using their TradingView charts in my analysis.

USD/CAD 1H Breaking Structure: The Start of a New Trend?Hi traders! Analyzing USD/CAD on the 1H timeframe, spotting a potential bullish reversal from a descending wedge pattern:
🔹 Entry: 1.38846
🔹 TP: 1.40286
🔹 SL: 1.37692
Price is bouncing off the lower boundary of a falling wedge, showing signs of bullish divergence with RSI also turning upwards. The breakout of the descending structure may signal a trend reversal or at least a corrective move to the upside.
The RSI is recovering from the oversold region, reinforcing the idea of a possible bullish push. A break and close above the minor resistance zone could confirm the move towards higher levels.
Watching closely for momentum confirmation!
⚠️ DISCLAIMER: This is not financial advice. Every trader must evaluate their own risk and strategy.

Bullish on Bigger Time Frames.Bullish on Bigger Time Frames.
but Important Resistance area is around 145 - 148.
Crossing this rangewith Good Volumes will expose
the levels around 170 & then 190.
132 & 125 are important Support levels as of now.

ETH back to 1900$ soon?ETH has broken the downtrend line and just completed a successful retest. Price is now moving within a new compression triangle, showing signs of consolidation before the next move.
Meanwhile, BTC is showing positive signals, adding momentum to the market.
📊 Breakout loading? Stay sharp.
The analysis provided reflects personal opinions only and does not constitute investment advice.

Learn These Patterns And You'll Never Regret ItEVERYTHING ON THE TRIANGLE PATTERN
a triangle chart pattern involves price moving into a tighter and tighter range (like a consolidation phase which has a triangle-like shape) as time goes by and provides a visual display of a battle between bulls and bears.
The triangle pattern is generally categorised as a “continuation pattern”, meaning that after the pattern completes, it’s assumed that the price will continue in the trend direction it was moving before the pattern appeared.
note: the triangle pattern depends on the trend however don't hold on to that thought since fake-outs are possible. the point i am trying to make is that you should not be obsessed with which direction the price goes, but you should be ready for movement in either direction.
there are three triangle patterns:
a) the ascending (upward slope consisting of higher-lows and a consistent resistance),
b) descending (downward slope consisting of lower-highs and a consistent support)
c) symmetrical (equal slopes the market is forming lower-highs and higher-lows)..
the triangle is different from a wedge. however, a wedge can be in a triangle or better put the general formation of a wedge is a triangle-like shape (in some cases).
point to note:
• you need at least two points (bullish or bearish) to connect for a triangle to be considered, and a consistent support or resistance.
• the volatility of price of any instrument decreases when there's a triangle pattern and increases on breakout of the pattern.
• measuring the size of the triangle can serve as a good profit target (will explain in meeting)
• keep an open mind at all times.
📝..

XAUUSD TRIANGLE PATTERN IN 30-MI Created This XAUUSD Chart Analysis In 30-M Tf
Entry: BUY from 3014
Support zone : 3010 / 306
Target Will Be : 3040
FOREXCOM:XAUUSD make TRIANGLE PATTERN, It went to Uptrend, Let me know your thoughts in comments section

FluoroChem ,1WFirst Triangle Pattern is Breaked Out and Next Channel Pattern is Formed at Retest for Triangle Pattern .
Now Channel Pattern is Ready to breakout , SO look an Eye on it when Breaking
Only Enter after the breakout of upper Trendline of Channel Pattern .
Be Careful when entering at breakout
Follow for more Swing Trade Ideas Like This

CHANDI CHANDI CHANDIChandi made classic triangle pattern on daily charts & its on the verge of breaking out of golden triangle .
Risk:Reward = 1:3
Could b bought above 93660 with short/long term stoploss & mentioned target.

NikePoor results mean Nike has broken out of a triangle pattern which started forming in March 2022.
Clean break down with large sell side volume.

a Bounce is expected from the Current level but Resistance aheada Bounce is expected from the Current level.
but 21 - 21.20 is a Very Strong Resistance.
as of now. & if it is Crossed with Good Volumes
& Sustained, we may see the price touching 22.50 - 23.50
& lets enjoy further upside above 24 - 25.
However, Monthly Support is around 16 - 16.50.

Bitcoin (BTC/USD) – Symmetrical Triangle Breakout or Breakdown?Bitcoin is currently consolidating inside a symmetrical triangle on the 1H timeframe, preparing for a strong move in either direction!
Key Levels to Watch:
📌 Breakout Target: $105,939 (+18%) 🚀
📌 Breakdown Target: $73,429 (-18%) ⚠️
📌 Resistance Zone: $92,000 (important breakout level)
📌 Support Zone: $84,000 (potential breakdown zone)
Technical Analysis:
🔹 BTC is forming a symmetrical triangle, which typically leads to a strong breakout or breakdown.
🔹 A breakout above $92,000 could send Bitcoin towards $105,939.
🔹 A breakdown below $84,000 could push BTC towards $73,429.
🔹 Confirmation with volume is key before entering a trade!
Trade Plan:
✅ Bullish Scenario: Buy above $92,000, target $105,939
❌ Bearish Scenario: Short below $84,000, target $73,429
🎯 Wait for a confirmed breakout or breakdown before entering a position.
Bitcoin is at a critical decision point—which way will it go? Let me know your thoughts in the comments! 🚀👇

BTC triangle broke downBTC is breaking down the triangle, it can be a downtren continuation. Just wait for candle close and see where iy goes from there. You know Bitcoin, sometimes retraces and price action gets back in the triangle.
ETH Weekly chart - do you get the pattern?Well, my friends,
This is the CRYPTOCAP:ETH with the weekly chart.
Following my other Chart using the #GANN Fan, I now drawed the triangle for you.
Like that you can see how the #ETHERUM behaves and when we will see it imo in a few months.
This is almost the beginning of the #ALTSEASON.
The #ETH still has some work to do.
We need to see a clear break of the last high at 2924$ and then based well above 3000$.
After that, we shall start attacking the 3400$ area and we will have to watch the retest of that area.
Once we are done with those technical areas, we will be able to push to the 4000$ and #ATH
What is missing now, is the MA13 MA30, and MA55 Slopes, I want to see them turn positive and to see MA13 cross MA30 and then MA30 cross MA55, this should be MEGA BULLISH and we are on the way there.
NFA
DYOR

#ARCUSDT - Monitor this asset closely📈 LONG BYBIT:ARCUSDT.P from $0.25588
🛡 Stop Loss: $0.24176
⏱️ 1H Timeframe
✅ Overview:
➡️ BYBIT:ARCUSDT.P has broken out of a Falling Wedge pattern and is following an upward trend.
➡️ The POC (Point of Control) at $0.24041 confirms liquidity in this zone, potentially acting as strong support.
➡️ The key resistance is at $0.25588; if the price holds above this level, it may lead to further gains.
➡️ Increased volume signals strong buyer activity and a high probability of continuation.
⚡️ Plan:
➡️ Important: Set an order in advance to ensure execution when the price reaches the entry level!
➡️ Enter long above $0.25588.
➡️ Stop-Loss placed at $0.24176 for risk management.
🎯 TP Targets:
💎 TP1: $0.26618
🔥 TP2: $0.27640
⚡️ TP3: $0.28670
🚀 BYBIT:ARCUSDT.P - Monitor this asset closely!
🚀 Place your order in the listing so that it executes automatically when the breakout occurs.

WAIT FOR BREAKOUT...MCX:COPPER1! trade in a triangle range since 7 month, you wait watch for an upside move after breakout.

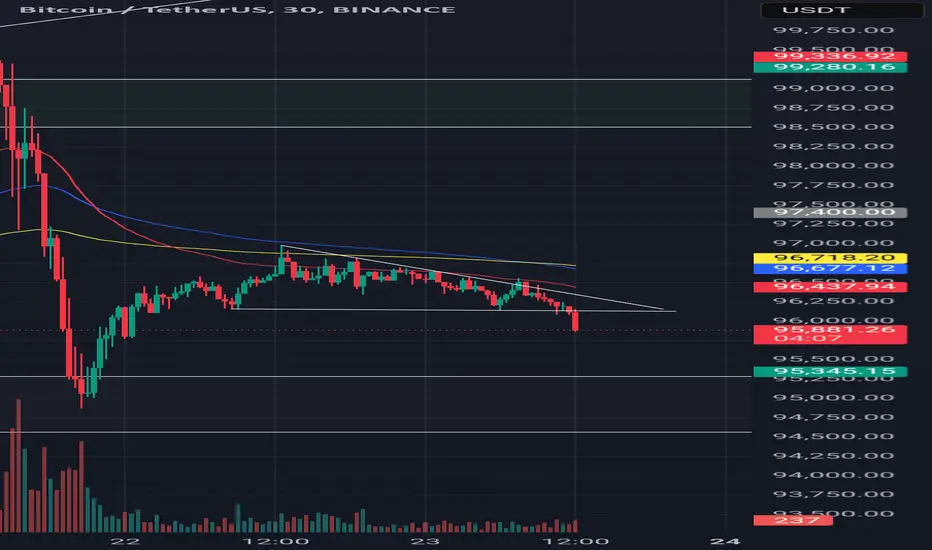
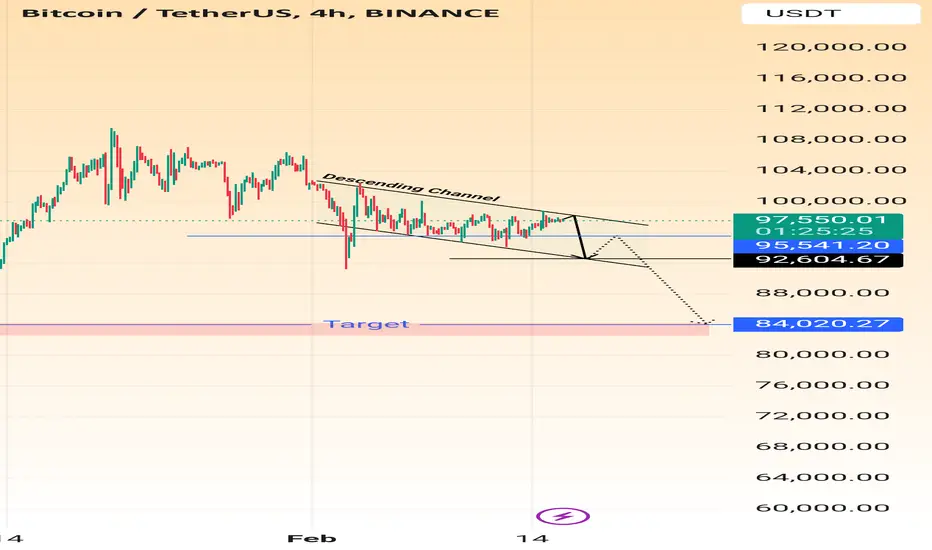
BTCUSDT - H4 Analysis For Next Possible Move!Hello Traders!
As price is moving within a downward-descending channel, which suggests a bearish trend.
The chart labels this pattern as a Descending Channel, which typically signals continued downward movement unless a breakout occurs.
Bitcoin is currently priced at $97,680.
A breakdown from the descending channel, leading to lower price levels.
The target price is set at $84,020.27.
The price is expected to test the lower boundary before breaking further down.
If BTC breaks below $92,604.67, it may trigger further declines toward $84,020.27.
Alternative scenario
May wait for a breakout above the descending channel to confirm a trend reversal.
If BTC breaks upward, a move toward $100,000+ could be considered.
Thanks
Regard: PipsOptimizer
Gold Retest Completed Now Next Impulsive Move!Hello Traders!
As we know that gold is trading in two ascending channel, one is internal and 2nd is external and following trend every time like this impulsive move till upper trendline of external channel and retest move till down trendline of internal channel according to this trend next move would be 3016.
there was a FVG and Order Block in H1 thats the reason for yesterday move still gold is in bullish trend.
Resistance: 2924
Support: 2908
i am bullish till 3016 because its also a target of weekly bullish flag which i have already posted in ideas section you can check in related post
Regards: PipsOptimizer

When Will the 2025 Altcoin Season Arrive? Patterns Reveal !OTHERS.D is copying the same script as the last two altcoin seasons.
I’ve marked points 1-8 in the structure.
Each time, it formed a triangle consolidation before breaking into a bull run.
In the last two cycles, point 8 was the final low before the rally.
Right now, it's retesting point 8, which is the lower boundary of the triangle.
Will it repeat the script and break out, or is this time different?
Could we see a new scenario, or is it possible that altcoin season won’t come at all?
If the altcoin season does happen, CRYPTOCAP:OTHERS could 2x from here.
What do you think?
Do you believe we’ll see a crazy 2025 altseason?
🔴 for more future script "guesses" like this!
🔥 I've dropped another 2 analyses for the 2025 altseason on the right hand side if you're using computer, and scroll down a bit to see the link if you're using mobile.

Is ETH Done Dropping?A few days ago, the crypto market experienced another brutal sell-off, leaving most traders in despair.
But historically, whales love to shake people out before pushing prices up.
Looking back at past bull runs, it’s common to see a sharp crash forming a bearish pattern, only for the price to suddenly skyrocket—leaving everyone behind.
Will it happen again this time?
I can’t say for sure.
But based on the overall market structure— BINANCE:BTCUSDT , BINANCE:ETHUSDT , CRYPTOCAP:BTC.D , CRYPTOCAP:OTHERS , CRYPTOCAP:TOTAL3 —the bull market still seems intact.
Now, let’s talk about ETH.
The recent crash completely invalidated the inverse head-and-shoulders pattern, and that massive wick just happened to hit the weekly M-top target (light blue line).
Zooming out, the massive symmetrical triangle (yellow lines) from 2022 is still holding.
It looks like the whales intentionally broke below the triangle to create a bearish illusion and scare people into selling.
They did the same thing last August to November—three months of shaking out weak hands at the lower edge of the triangle.
At the time, many turned bearish.
Then, whales pumped ETH back into the triangle and even broke the upper boundary.
So right now, we see similar bearish traps :
An M-top that didn’t break the neckline.
A fake breakdown below the triangle’s lower edge without follow-through.
To me, this seems like another deliberate move to clean up weak hands.
Short-term, we’ve probably already hit the bottom.
From here, we’ll watch how the chart develops.
If you’re looking to enter, now seems like a reasonable time—but make sure you set a strict stop-loss.
🔴 for more future script "guesses" like this!

When Will the 2025 Altcoin Season Arrive? Clue from OTHERS.DCRYPTOCAP:OTHERS.D is copying the same script as the last two altcoin seasons.
I’ve marked points 1-8 in the structure.
Each time, it formed a triangle consolidation before breaking into a bull run.
In the last two cycles, point 8 was the final low before the rally.
Right now, it's retesting point 8, which is the lower boundary of the triangle.
Will it repeat the script and break out, or is this time different?
Could we see a new scenario, or is it possible that altcoin season won’t come at all?
If the altcoin season does happen, OTHERS could 2x from here.
What do you think?
Do you believe we’ll see a crazy 2025 altseason?
for more future script "guesses" like this!
💰 Bitget 20% Trading Fee Discount:
lihi2.com

CHR Set to Skyrocket? Potential 43x to 165x Ahead!▍Reason 1:
BINANCE:CHRUSDT is perfectly replicating the price structure from the last bull run.
You can refer to the points I marked (1-7) in the chart.
In the last cycle, point 7 marked the lowest point before the price surged 84x.
▍Reason 2:
Since January 2021, CHR has been forming a multi-year symmetrical triangle, and it's now approaching the end of this pattern.
According to triangle consolidation theory, this means a major breakout is imminent.
Considering that altcoin season is also approaching (I've attached my previous analysis below), CHR is very likely to explode upwards!
▍Price Target Projections:
1. Fibonacci Target (marked in the chart) suggests a target of $6.6, representing a 43x increase from the current price.
2. Triangle Breakout Target (marked in the chart) suggests a potential high of $25, an incredible 165x from the current price!
I don’t think this bull run will deliver 100x+ gains, but with this potential, isn’t it worth getting in now?
for more future script 'guesses' like this!

ETH Forms Large Head & Shoulders Bottom, Might Break $4,000 SoonCRYPTOCAP:ETH has completed the right shoulder of a large head-and-shoulders bottom pattern, with the drop almost identical to the left shoulder.
Zooming in, #ETH is currently testing the ascending trendline (marked in pink) that started on 11/14.
In the coming days, watch if it can hold above this line. If it holds, the price could quickly surge past $4,000.
A key level to watch is around $3,331, which is the bottom of the candlestick with the highest recent trading volume.
Although it seems less likely right now, if this level breaks, it's possible that major players might intentionally push the price below the large triangle convergence bottom (marked in yellow) formed since June 2022, further shaking market confidence.
(From August to November last year, there was a similar intentional move, where the price was suppressed along the triangle's lower edge for three months, creating multiple bottoms before a strong rally.)
Follow me for more future price action scripts for different coins!
