AUDUSD - Potential SELL SignalPotential SELL - AUDUSD
Break Triangle Pattern H1
break @0.6939
on retest of the bottom trendline and if price failed to go up the entry point can be 0.6930
Trianglepattren

EURCAD Beginners Attempt Chart AnalysisSo, I'm no expert at this just yet but I have been practicing and seem to think that this idea will play out as I am predicting it to...
Please don't take this idea as financial or trading advice of any kind - instead, if it is not correct, can someone please tell me where I went wrong?
Happy trading everyone!

BTC FORMING BULLISH EXPENDING TRIANGLE!!BTC is forming this bullish expanding triangle pattern currently retesting according to the pattern we may bounce up to 21% from there but we need a successful retest.
RSI is showing some bullish diversion moves.
Let's see how the market reacts in a few hours.

ETH DESCENDING TRIANGLEETH forms a descending triangle.
The price returned from the support area and tested the resistance of 1244$.
In order to climb, this resistance must be broken in order to have an ascending view.
If the 1019$ support area is broken, the price may fall to the 800$ support area.
Let's see what happens.

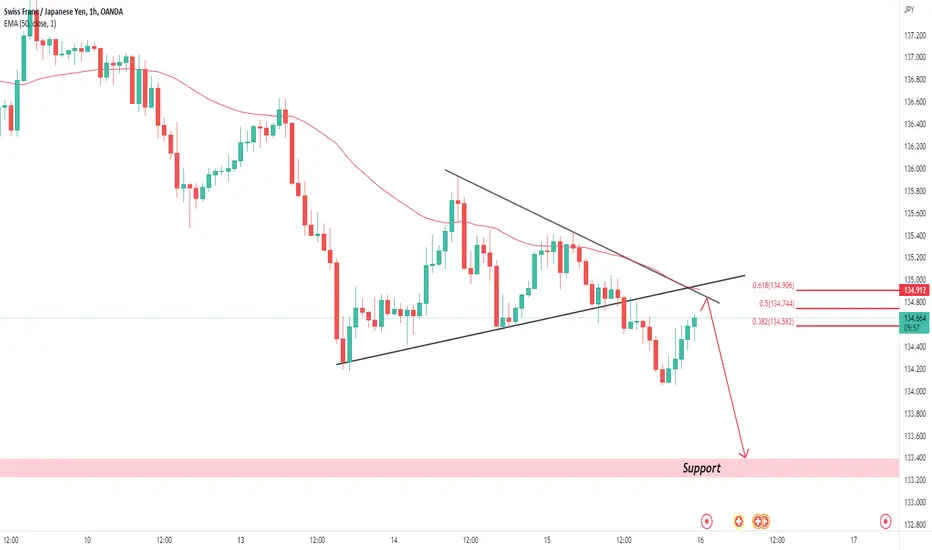
CHF/JPY 220 Pips from last analysis new entry addedHi Traders, we have opportunity to take rest of goal with arrive price to broken trend line and falling trend line + Ema 50
if you like this idea support me with a like and follow
Silver Shortpair trading within triangle i expect fall from this level to support until will start rising wave from support at 21.50

[Bitcoin] Short-term convergence in progress.#Crack #Bitcoin #Binance #1H
- Bitcoin has failed to break out the $30,655 resistance and is in the process of convergence in the short term.
- With the failure to break out the $30,655 important resistance line, the possibility of further drops should be left open, and confirmation of the $29,301 important support seems critical when the convergence bearish breakout occurs.
- The turquoise large convergence lower end and the $23,901 important support line overlap. If that support fails, it is necessary to keep in mind the emergence of a large sell-off as a bearish breakout of the large convergence.
- However, if the support of the next strong resistance, $28,750, succeeds, we can expect an extension of the large convergence.
- Breakout from white convergence, $30,655 resistance, $29,301 support, $28,750 support, check these four points carefully before responding.

XTZUSDT is going to have a breakout from the triangleThe price is testing the 4h resistance on the triangle.
The price had a breakout from the dynamic resistance and now the market is testing the 0.618 Fiboancci level. If you look on the left you can see that the price has a supply zone on 2 - 2.1 $
How to approach it?
The price needs to create a clear breakout from that area.
If the price is going to get momentum and volumes, According to Plancton's strategy, we can set a nice order

ES Long/ShortI'm seeing a triangle. Maybe will get to 4170 - 4180 range tomorrow and slapped back down end of week.
What do others think?

NIFTY may bounce morebears not aggressive in selling.
bulls confusing with direction
result; bear trap may form to induct more retail investors
what EW/NW chart says;
5 waves completed as triangular correction ABCDE.
wait for 50% recovery till 16725
If it passes over then bulls are strong. BUY ON DIPS
If It fails then bears will start the game
now be in longs only until 16725

A Good Chance of 0.8 in 3 DaysWe are at the second testing of the upper bound of the triangular formation consecutively without reaching the lower bound. This indicates that the bulls are pushing upwards and that a decisive move is imminent in the coming few hours. If the early hours of today are bullish to the point of breaking the upper bound, 0.8 could be reached easily within 3 days according to Fibonacci levels as well as Gann charts.

BULLISH SYMETRICAL TRIANGLE EUR/USDEUR/USD is expected to continue the bullish momentum it has been showing in the last couple days with a symetrical triangle formation.
Comment your thoughts and stay updated for the results 👍

Bullish scenario for Crypto Total market capBullish scenario for Crypto Total market cap - triangle breakout to 1.714
This triangle target fit very well a huge volume profile resistance.
Of course breakout to the downside has to be considered as well and is still more likely since we entered the triangle falling from the upside.
What do you think?
Drop me a nice comment.
*not financial advice
do your own research before investing

More Swinging to Come for EtheriumThere's an upside for the story: there's an upside for Ethereum on the short term. The downside is that the medium future is rather bleak. Etherium's curve seems to be going through a classical shedding phase since a while. From a geometrical perspective, it is hard to imagine a reversal soon; on the contrary, an avalanche similar to what happened with Bitcoin a few months ago is about to come, especially due to the correlation with the macro economy which will continue to struggle for a while.
Trend curve projections show that next week is a prominent challenge to the current surge. I expect ETH to struggle a bit but then move up for a while until it reaches the upper consolidation area about 2500, the upper bound of the forming triangle. That's when everyone would start thinking that Crypto is back and dream about the 100 million in their banks next year. Institutional traders and whales, meanwhile, will have made their millions already and will initiate selling, knowing that the current economy and the physics of the market can't support higher levels. An avalanche would ensue until it hits a bottom around 1300, touching the lower trend somewhere in August, perhaps, after breaking away from the lower bound of the triangle.
The theory is also supported by the volume profile which confirms the levels of the Gann charts.

DYDX- A new all time low??!Hi everyone
As we have seen a failure from MTR pattern,the bearish market was clear.Now we got ourselves a triangle and we have to see how does the price react.
The reactions mostly happens near the support and resistance levels, so we got support levels of 1.625$ and the bottom of the triangle,and for resistance we got 1.8$ and after that we got the top of the triangle.
Hope this analysis helps you in a way.
I will gladly answer your questions,Just leave a comment below and PRESS THE LIKE BOTTOM please.

Triangle Pattern DefenseAscending Triangle Pattern Defense.
Helps you get out of up trend consolidation.
This demonstrates this defense LIVE!

TARGET PROJECTION FOR GMTUSDT IN THE DIARYPrice formed a double bottom pattern, in a downtrend, also characterizing a descending triangle and, in my view, if it breaks ~up, the price can seek this price projection.
Obviously it may take a few days, even because the chart is in the diary. But I believe you can look for that price region.
disclaimer
*** In accordance with CVM Instruction No. 598, of May 3, 2018, Art. 21, I declare that the recommendations of this analysis reflect solely and exclusively my personal opinions and perceptions and that they were prepared independently and autonomously. Not being considered a purchase and/or sale recommendation. ***
Any questions do not hesitate to contact me. I'm happy to be able to help you in the best way I can. 🙏

Torrent PowerTorrent power broke out of triangle pattern with good volumes on an hourly chart.
Could be bought with mentioned soploss & target.

REEFUSDT is creating a triangleThe price is creating an ascending channel below the daily resistance of 0.005$.
As you can see the daily area is very strong for the market, and the price got several rejections from that area.
How to approach it?
IF the price is going to have a breakout from that area, According to Plancton's strategy , we can set a nice order
–––––
Keep in mind.
🟣 Purple structure -> Monthly structure.
🔴 Red structure -> Weekly structure.
🔵 Blue structure -> Daily structure.
🟡 Yellow structure -> 4h structure.
–––––
Follow the Shrimp 🦐

USDT DOMINANCE BREAKDOWN! BULLISH RALLY AHEAD IN THE MARKET!!Hello everyone, if you like the idea, do not forget to support with a like and follow.
Welcome to this USDT DOMINANCE update. USDT.D looks bearish here.
As you know USDT Dominance is inversely proportional to the BTC and Alts. When USDT.D dumps the whole market (BTC and Alts) starts pumping.
According to the 4hr chart, USDT Dominance breaks down the triangle and now all we need is a successful retest. After the retest, we can expect more drop-in USDT Dominance.
When USDT Dominance retests we have a perfect chance to take lower entries in Altcoins. I'm waiting for a retest to long some Alts.
What do you think about this?
Do You think we get a retest from here or do you believe that this will be a takedown?
Share your thoughts in the comment section.
If you like this idea then do support it with like and follow.
Thank You!

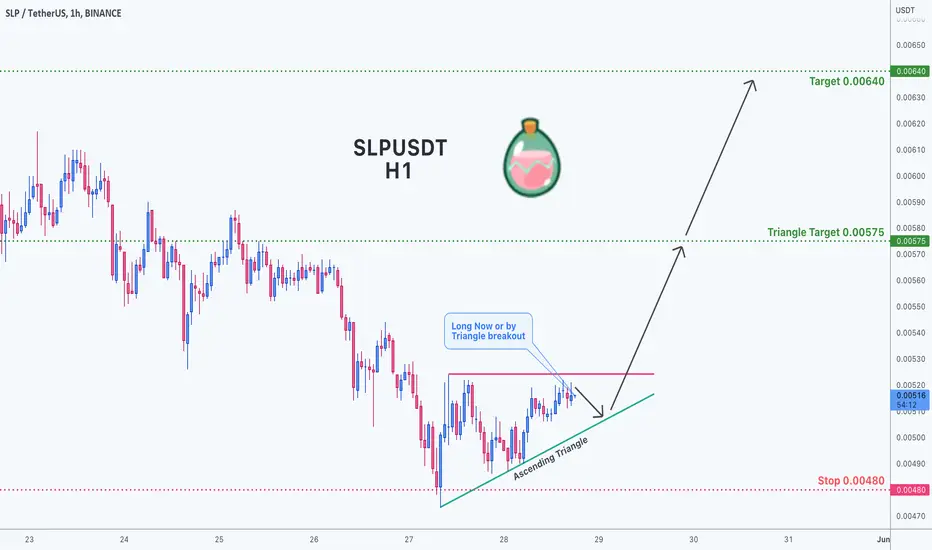
Ascending Triangle on SLPUSDTBased on technical factors there is a long position in :
📊 SLPUSDT
🔵 Long Now or by Triangle breakout
🧯 Stop loss 0.00480
🏹 Target 1 0.00575
🏹 Target 2 0.00640
💸Capital : 1%
We hope it is profitable for you ❤️
Please support our activity with your likes👍 and comments📝
LINKUSDTIt seems that the price has no limit to reach the $ 4.26 area !!
It is very likely that the triangle pattern will be broken from the bottom, but we have important orders in the QM range that if the price reaches that range ($ 7.25), our momentum of a downward movement could be stronger.

RACE to triangle support RACE has been on the decline since nov 2021 and bounced off the 181 support twice forming a declining triangle.
Taking a short term bullish trade from the last bounce and watching the price action for any weakening to get out.
Currently holding this trade as MACD and RSI are going bullish - planning to exit when the RSI becomes overbought.
27/5 Planning to move my stop to reduce risk and watch the 4hr candles for the 27th and decide if i need to move the stop again or keep holding.
