Farm finance Triangle Breakout. PART 3Since it doesn't like to be trapped. I just decided to drop some lines down, lets see what it do xD
Trianglepattren

Farm finance Triangle BreakoutWhat is this thing and why is it always mooning. Looks like some serious potential incoming.

XRPUSDT: triangle pattern broke to the upside, LONG OPPORTUNITY?XRP price today is $0.718515 USD, down 3.32% in the last 24 hours, with a 24-hour trading volume of $2,449,258,622 USD.
On daily chart we can see how the descending triangle pattern started forming in May just broke to the upside testing the first resistance level at $0.78, where it got rejected. Now a pullback retesting the previous support at ~$0.66 is expected, and this can be a good entry opportunity for long trading.
Following the triangle pattern , the aimed target should be $ 1.17, but personally I don't believe it would reach it in the short term, therefore I would set many "taking profits" at the previous resistance levels.
RSI on daily chart is decreasing and is now headed to test the previous resistance identified at 46.6 level This is the reason I believe price will suffer a pullback up to $ 0.66 level, before rising again, range which corresponds also the the EMA of Keltner channel (on daily chart ). If this will happen, this can be considered a confirmation for going long as historically, whenever price broken the upper level of the channel immediately a pushback happened to the EMA level before retesting the upper boundary.
MACD still looks bullish on daily time frame and Keltner channel is becoming thinner and thinner, a sign that volatility is decreasing. This usually happens before a big move to the upside.
TRADING POSITION: Long
ENTRY PRICE: < 0.66
TARGETS: 0.77 / 0.84 / 0.87 / 0.95 / 1. 01 / 1.08
STOP LOSS: $ 0.58
TARGETED PROFITS ARE HIGHLIGHTED IN THE GRAPH
While on daily chart the price looks bullish , on 4h chart we can see how MACD is under the trendline, price therefore is under the EMA of the Keltner channel and is now decreasing headed to test the lower boundary of it, this corresponding to the spotted entry price. Therefore, 4h chart allows us to understand with more certainty that price will suffer a decrease before our long targets being reached. Moreover the lower boundary of the channel on 4h time frame corresponds to the EMA on daily time frame, a possible confirmation that price won't go under that level.
Let's see if XRP will perform as expected. For more ideas like these, please follow us on our social medias as well!

EURUSD possible in wave E (yellow) of triangle. 11/August/21EURUSD price have broken the previous low of zigzag wave pattern at 1.17500. Probably will form double zig-zag instead of simple zig-zag pattern. And EURUSD current price could be in wave E ( Yellow) of triangle. Where wave E (Yellow) may find support at around 1.1600

AMC Triangle ART SO amc to start accepting BITCOIN????Enjoy some trendline triangle art while hedge funds control the life out of it.... for now.

Mahindra & Mahindra Limited - Triangle pattern breakoutMahindra & Mahindra Limited - Triangle pattern breakout
StopLoss @ 752
Target 1 @ 820
Target 2 @ 867
Target 3 @ 917


BTC quick pump then to continue the 'BearMoon' trend.BTC quick pump then to continue the 'BearMoon' trend.. Those DAMN WITCHES at it again!

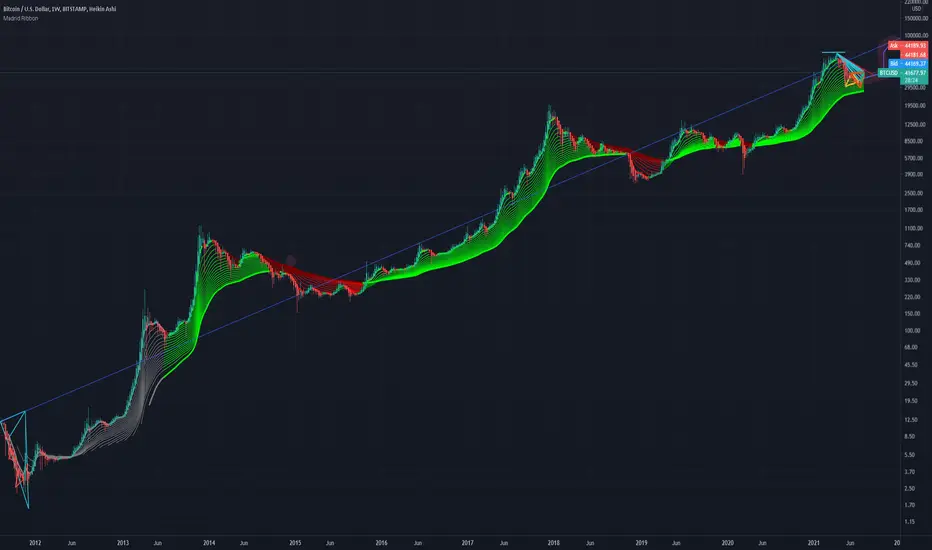
This one trendline decides all of BITCOINS direction ACCURACY This one trendline decides all of BITCOINS direction ACCURACY
take a look on how accurate even in 45min chart. ALL time frames this trendline works out to be.

How I found "The Corrective Trend-Line" of BTC (BacKstory)The very FIRST 'bear-moon' and that giant candlewick was the deciding factor in BITCOINS direction forever ;) I call this "The Corrective Trend-Line"

This one trendline decides all of BITCOINS direction..Part 3Part 3 of This one trendline decides all of BITCOINS direction. LMK what you think! This is just for fun!
SLP PROJECTIONThe market shows us a glimpse of bullish today were the market reacted from our daily POI. The market bounce off from expected area 👌
Confluence I have seen for LONG bias:
1. Mitigated D1 POI
2. Potential liquidity has been grab
3. Market reacted from our TL support
3. (Doji reversal candlestick pattern) in POI
4. Bullish harami in POI
5. Potential bullish engulfing in POI
This is the previous SLP analysis:

BTC has broken...BTC has broken out of this TRIANGLE/trend I drew up a couple days ago!! lets goo!!!!!!

NSE : KOTAKBANK - KOTAK MAHINDRA BANKChart is self explanatory.
Comment if in doubts.
Good bank, but bearish short term.
Technical trade setup.

NASDAQ - TRIANGLE!In the NASDAQ I cannot see any new intermediate highs so far, which presents a corrective character of a triangle. I assume that the triangle is the wave (4). As long as we are within the triangle, the upward movement is intact and I expect prices in the 15600 area in the next step. Should we leave the triangle below and go below 14789, we will see larger sell off (also coming below 14445!). So that the upward movement remains intact, the 14708 mark should not be undercut. I´m still in good spirit that the upward movement will continue. I assume that we will hit the lower edge of the triangle again before reaching new all-time highs.
H1:
Kassa wolfe wave:

DXY will continues downDXY beared break out from symmetrical triangle formation on 1H. DXY will fall continues to target 1: 91.8 and target 2: 91.6

Bearish case for silverThis would be the bearish case for silver:
Triangle pattern broken to the downside. Price quotes are under the 50's MA. Target for this case according to the height of the triangle would be ~17 USD / Oz..
According to inflation and so on it would be a rather unlikely scenario, but the market does what the market does.

bajaj holdings 2/8/21this one of the price action patterns widely seen.it has
formed good structure but not good price volume expansion.
weekly bullish engulfing is formed.enter this stock only after
bullish confirmation above 3947.75 level

BTC Wyckoffian Analysis - Appearing alerts of Redistribution I posted on my last post here, that I’m thinking the price will rise, but now I think I was wrong.
I think there’s a lot of weakness in the market and I will explain why:
1. The highest VP points on the lower half of the range - that is a Sign Of Weakness(SOW) because it means the for most of the range, there is not enough demand, the supply slowly pushes the price lower, and the demand fails to handle it.
2. The volatility is noticeable - there is not even one bullish movement that is not answered with an equal or stronger bearish movement
3. The range keeps getting lower lows
4. OBV decreases through the range - indicates higher volume for bearish movement
5. Macro descending triangle - the range is also a triangle pattern, which indicates movement continuation
6. Macro H&S - the range is the right shoulder of a much bigger H&S pattern

BELUSDT is testing the weekly resistance 🦐BELUSDT is testing the weekly resistance inside a triangle. IF the price will have a breakout and turn the current resistance into new support, According to Plancton's strategy (check our Academy ), we can set a nice order
–––––
Follow the Shrimp 🦐
Keep in mind.
🟣 Purple structure -> Monthly structure.
🔴 Red structure -> Weekly structure.
🔵 Blue structure -> Daily structure.
🟡 Yellow structure -> 4h structure.
⚫️ Black structure -> <4h structure.

Setting upNYSE:NIO
Pretty nice wedge forming up here after the break of the previous wedge. Hanging around support here while this forms.
Would love an entry down in that 38.50-40 range as this will be a massive move if/when it decides to break upside & clear those nodes!

TCS LONG SETUPOn one hour time frame basis TCS is forming an ascending triangle pattern and if we see overall IT sector is also bullish. we will go long on TCS for positional basis for the target of upper resistance formed. Good luck traders.
(Note:- This is my personal views. Please consult with your financial advisor before taking trade.)

XAGEUR : possible buy zoneAs you can see on the chart, clearly we are in a possible reversal zone to the upside .
My intentions is to start buying and build a position gradually.
The ultimate goal is to catch the next low inside the big triangle but the position will be adjusted according to price action , momentum and so on
best of luck :-)
