#BITCOIN - Triangle Pattern In Elliott Wave Theory - Part 2 -BTC Decision Time
Will the $9K Fortress Fall?
There is a seriously crazy amount of stuff happening in the world!.
- Global pandemic.
- A very just and long overdue fight for equal rights.
- Economic turmoil.
The list can certainly go on, but we'll only add one more thing to it — DECISION TIME FOR BITCOIN.
It is very likely that Bears will once again storm the $9K BTC fortress, but will they finally succeed where they have been soundly defeated on several recent occasions?
The Last weeks, bulls were routed, trounced , decimated , by staunch $10K defenders when it blasted clear of the five-digit mark only to violently crash back into the $9,000 region.
Here are a few of the predominant factors holding BTC under.
Focus on Traditional Markets
Retail traders are nowhere to be found, as has been the case since civilians were completely and utterly "REKT" after the 2018 bear market.
That leaves the vast majority of price action up to the pros who have a lot on their hands as of now. Compared with traditional market traders, there are far fewer traders whose sole focus is on cryptocurrency.
Meaning most traders are dabbling across several different types of assets — and not all of them digital . With the irrational-but-widely-accepted ongoing bull market in the Dow Jones; S&P500 and Nasdaq showing little sign of letting up, the spotlight on digital assets has dimmed.
There Is Still a Pandemic.
(In Case You Forgot)
Simply put, there is still a pandemic on. This thing is just throwing a curveball no matter how you look at it.
Currently, it is impossible to say if the pandemic is a boon or hindrance to Bitcoin's fortunes. But, logic might tell us that under such circumstances, an unabated rally to the moon is just not in the cards yet.
From prior experience, Bitcoin always loves a good counter-trend rally, with the recent move from the $3,000s back to $10,000 being another one for the books.
Nonetheless, the insecurity around the economy and the whooping America has taken at the hands of the virus (being the world's leading source of BTC trading activity) means the bull-case is still psyched out.
$10,000 Is a Major Psychological Hurdle!.
Certain numbers are powerful. For Bitcoin, 10,000 is just such a number. Try as it might, BTC hasn't been able to completely break free of the orbit caused by 10,000's gravity.
Even after posting major gains and sustaining prices near the $20K mark, the Bitcoin pendulum has swung wildly even without the myriad forms of turmoil seen today.
Getting near the $10K mark has already been a very wild ride, and breaking through it will be one, too.
The reason we've seen such swift rejection at or above $10,000 recently is that bears need to exert immediate and definitive downward pressure to keep the psychological barrier in play. Too much time spent above $10K will give hope and gather forces on the other side of the equation.
So far, bears have shown more power in defending their fortress, but the longer that fortress remains sieged by prices hovering nearby, the sooner we can hope it will fall.
Trianglepattren


Bearish Trend After Breaking Trianglethe detail is shown on the above Idea.
this Idea is in Continuation of my Confirmed Previous Idea.


#SIEMENS | NSE | 1D | LONG | #SYMMETRICALTRIANGLE01) Symmetrical Triangle
02) Stock Trading above 20 EMA
03) Breakout Candle - 03-07-2020
04) Check High Volume
05) Target - Check Green Arrow near Channel Top
06) SL - Below Swing Low / Below 20 EMA
-------------------------------------------------------------
Note : This study for educational purpose only.
-------------------------------------------------------------
Please like, share and follow for new positional ideas. Comment if any querry.
-------------------------------------------------------------
Twitter - @bagade_arvind

EURUSD LONG IDEA, still trading on a triangleSaw a double bottom at 15 min time frame.
Wait for breakout and enter for long
At bigger time frame, we have a triangle
so TP is set on the top of the trendline.

VBL continues uptrend Long for profits with a SL !!!VBL is in a strong uptrend. After a fall it took support at 675 and is continuing is steep uptrend. Can go long.

Next 2 weeks crucial for Nifty ???Nifty is making a a rising wedge triangle pattern. It is about to face a very strong resistance at 10700 levels. We may see a fall !!! Just take the opportunity and convert it to cash !!!

Titan touching upper side of triangle Short !!!Titan is making a symmetrical triangle pattern on daily charts. As seen in the 15 minutes charts it is resisted at the resistance line. Great idea to short for a trade.


Bharti Airtel making descending chart pattern !!!Bharti Airtel is making a descending chart pattern on daily time frame. It is not likely to fall. Can go long at 550-600 with a price target of 590-600 at breakout.

AXISBANK is making a Triangle Pattern A breakout in either direction can be anticipated soon. Please keep a check of price action and accordingly take bets.

The future of oil pricesOil prices are likely to fluctuate on the floor and ceiling of Bollinger Bands and are forming a triangle pattern.
Also, in the stochastic market indicator, the formation of the double bottom pattern can be seen, and it seems that the price will be well supported at this point.

ARDRBTC Fills the wick? 🦐ARDRBTC Fills the wick?
According to Plancton strategy, we can set a nice order
–––––
Follow the Shrimp 🦐
Here is the Plancton0618 technical analysis, please comment below if you have any question.
The ENTRY in the market will be taken only if the condition of Plancton0618 strategy will trigger.

XAUUSD BUY ENTRYHello traders, Gold is forming some strength to push upside. we will buy it after Breakout. Set Stop loss below Supportline.
Don't Forget to Hit the like button if you find it helpful and informative and follow to catch every wave correctly and remember to share ideas.
Previous analysis

BITCOIN Critical Point(Video On Pennant vs Symmetry Triangle)Thank you for supporting by liking and commenting.
This video will teach you how to identify a Pennant Pattern and a Symmetry triangle, and also how to differentiate them.

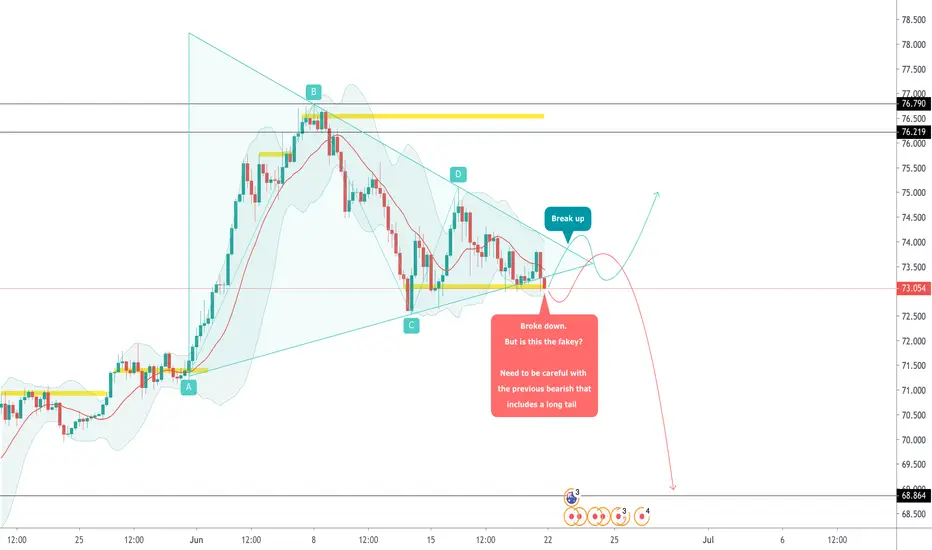
AUDJPY broke down the triangle pattern. But is this fakey?As you can see, the triangle pattern broke down. But is this the fakey? We need to be careful with the previous bearish that includes a long tail. When we have the trusted structure to confirm the price is going to break down or up, let set the position. Good luck to you! 🤓
Possible bull continuation at the bottom of a forming triangleTriangle formation at 1D time frame. It is resisted three times to the long side along the trendline. It also supported two times the second time with a hammer at the bottom. I could possibly continue up to the bull side if we get one or preferably two more confirmations to enter. It could also retest and continue down to the main upward trendline, but again we need more confirmation to enter either side, but for now I am inclining myself more to the bull side.

PK in a triangle patternPK is now in a triangle.
Bulls and bears are exhausted; watch the decreasing volume across the triangle body.
Im currently holding my 10.6$/share position and will sell if bears control the trend.
if bulls break the triangle then first exit target is 15, and second exit target is 17.

PIDILITE Triangle Formation On Daily and Weekly ChartsPidilite is in Triangle Consolidation For Quite a Time Now And Breakout is Expected Soon,
If The Upside Breakout Follows Then We Can Expect Minimum Target of 1600 But if It Goes Beyond it Then The Other Target Would be 1700.
If a Downside Breakout Happens Then There's a Minor Support at 1350, But As Per Technical Analysis Rules Another Target Can Also Be near 1200

NZDUSD double top patternNZDUSD has formed a double top alongside of break out of neck line and we are waiting for a proper retest on neck line AKA as resistance area so after getting candle confirmation you are welcome to use any pattern you want but doji-engulf is the best one in my opinion so im willing to hear any new idea you have on this one but after that with a low sl level we can go short and on every target point which is shown by horizontal ray you can move your stoploss again and one more thing about sl lvl its better to put it on top of the double top cause we may have a triangle patter of course so we might have a little bit of noise again to the upside and please use proper mponey managment its not a perfect set up more confirmation is needed
if you have more questions or opinion on this one please share it on the comment section
------------------------------------------------------
check out our social media and website for more educational content and daily analysis
telegram t.me/fxfortuna
"patience is a key element of success"

ADA is doing........somethingI don't even know if there is a name for this but I've seen it happen so many times I'm finally going to make a plan to trade it.

