Long #BTC #Bitcoin #BTCUSD W4 W5 #triangle #Elliottwave 16Oct23This count is based on my assumptions so anything can happen not a trading or financial advice just for educational purposes only kindly do your own ta thanks trade with care good luck.
Triangle Wave

Btcusdt ,,, Break the trend line My hypothetical trend line and triangle are broken, the future is nothing but a repeat of the past, I expect Bitcoin to grow up to 35 and 40

XAUUSD ↘️ ShortXAUUSD
Short Order
🟢 TP 1850
🔴 SL 1987
💖Good luck and thank you 💖
💖Please like, comment and follow 💖


Triangle burst Elliottwave pattern in Global EducationThe Global Education chart looks so good when it is making a triangle pattern.
The five waves such as the abcde of the triangle are complete and it is directed upward.
The move from here is near about 50%.
Play with your risk and you will earn good money on your capital.
Thanks

PC JEWELLER 25% RETURN🔥🔥sept 5
swing trade perfect symmetrical triangle short term opportunity for upside take trade after breakout from the trendline according to own risk this is not call just a analysis.
when nifty turns bullish take trade

No volume but there is something#GOLD... market just trade above your area 1953 and didnot break it even in 5 mins chart frame,
Now we have another trade setup, keep close and stay sharp..
Trade wisely
Good luck

How to Count Waves Using Chart Patterns?We can count waves using traditional patterns like Head and shoulders, Double Top and Bottom,
Triangle, cup & handle, etc. This article is about how you can count waves by identifying chart patterns.
I have covered Three chart patterns in this article,
1) Triangles
2) Head and shoulders
3) Double Top and Bottom
1) Head and shoulders:
In addition, the two lows formed when the price failed to rise and fell back down were basically at the same level. The horizontal line is often referred to as the "neckline" When the price fails to fall back for the third time neckline will break. So "head and shoulders" was officially established.
Changes in volume with head and shoulders:
During the formation of "head and shoulders", the left shoulder has the largest volume, the Head has a slightly smaller volume, and the right shoulder has the smallest volume. The phenomenon of diminishing trading volume shows that when the stock price rises, the chasing force is getting weaker and weaker, and the price has the meaning of rising to the end.
Operation plan after the Head and shoulders appear:
When the head and shoulders formed, you can decisively follow up the short order. The formation of the head and shoulders indicates the beginning of a new round of decline in the market, and the minimum drop is the distance from the head to the neckline. The profit is very substantial. Therefore, studying the formation of the Head and Shoulders is also a necessary analysis process for band enthusiasts.
Wave Count:
The left shoulder: wave 3/A.
The first touch on the neckline: wave 4/B
Head: wave 5/C
The second touch on the neckline: wave A/1
The right shoulder: wave B/2
The ending point of the right shoulder: wave C/3
2) Triangles:
These are the most commonly used triangle patterns. In this motion, we are going to understand the triangle in terms of the Elliot wave. We'll be talking about the classical triangle pattern in an upcoming educational series.
Wave Count:
A triangle forms in corrective waves. There are Four corrective waves in Elliott wave theory. The corrective waves are 2,4, B, and X.
There are four waves in a triangle which are A, B, C, D, E.
The starting point of wave A of the triangle is the ending point of impulsive wave 1/3/A/W. After the completion of wave E of wave 1/3/A/W, the Impulsive wave will initiate.
3) Double Tops and Bottom:
In the chart, you can sometimes see the stock price fluctuations. The stock price fell back after reaching the highest price. After some sorting, it rose again to near the previous stock price level and then fell back. Two "normally highs" The high point is formed on the circuit diagram and will not be seen again in the short term.
Wave Count:
In a Bull market, The first Top of the pattern represents the completion of the impulsive wave. The ending point of the Impulsive wave is the starting point of the corrective wave.
I started the wave count from the first Top and labeled it as A, B, and C waves.
In a Bear Market, The first Bottom of the pattern represents the completion of the impulsive wave. The ending point of the Impulsive wave is the starting point of the corrective wave.
I started the wave count from the first Bottom and labeled it as A, B, and C waves. After wave C is complete, we can ride the impulsive waves.

TSLA | TFW Wave Projection Triple Correction - Reversal PatternTesla : Wave projection with a triple combo correction scenario - 1. extended flat 2. zigzig 3. potential a triangle reversal pattern breakout downtrend line.
This week is moving below wave b.b.b downtrend baseline, squeezed between ma50w and ma200w - still choosing breakout side.
The price could retest and fakebreak ma50w - a possible short entry targeting near the previous liquidity support level.
RRR: 2.5:1
Always trade with affordable risk and respect your stoploss!

SUPRAJIT swing trade take trade when nifty turns bullish swing trade perfect symmetrical triangle short term opportunity for upside take trade after breakout from the trendline according to own risk this is not call just a analysis.

IRCON SWING AND INTRADAY TRADEswing and intraday trade take entry once the trendline get broken with good volume candle close rr is like 1:3rr which is good enough


{ NELCAST } SWING TRADE take trade when nifty turns bullish swing trade perfect symmetrical triangle short term opportunity for upside take trade after breakout from the trendline according to own risk this is not call just a analysis.

Short on TataMotors (Triangle Pattern) SL-451Triangle Pattern Formation in Tata Motors .... But Still Wait For Close of Candle Below Trend line
SL will be Around 451.....Agressive Traders can jump in now....

LINKUSDT Potential Bullish Gartley to turns Bearish / FlatPotential reversal price action in a potential ending diagonal Elliot pattern corrective, plus potential bullish Gartley and AB=CD projections aiming demand zones.
The price is ranging @ upper region of a monthly Inside Bar candlestick pattern. I'm expecting the breaking of Aug '22 low to lowers lows newer targets. The price action above this level tends to ranging in zig-zags.
Anchored VWAP from the Aug '22 low is a important intraday support. Price is ranging between the upper bands 0.618-1.00 from this VWAP.
Bearish divergences on RSI and Chaikin Money Flow oscillators.
Similar pattern linked below.

DOW JONES CONTINUES BEARExpanding Diagonal of Wave A, minor uptrend since September 2021, in my perspective was Wave B.

Forget about chart patterns! Hello, my dear friends and happy New Year!
I wish you to be healthy and reach all your goals in trading and not only! Never give up on this difficult way which we are going to overcome together!
Today we have a very important topic. How to use Elliott waves instead of classical chart patterns. This is the natural exposure why the chart patterns are garbage. I remember my third year at university when we have the trading lessons. Our teacher gave us a lot of useless knowledges about support, resistance and chart patterns. I have not understood why it should working and it was not soo intereting subject for me. That’s why I returned back to trading much later using self-education. Now I have the clear understanding why Elliott waves is the best tool and why it’s working. Most of traders even don’t understand that chart patterns is just the special case of Elliott waves. That’s why today I decided to explain you how you can change the first one to the second one. Let’s go!
Double Top(Bottom)
On the chart above I drew the different types of double tops. Generally we have 3 types of this pattern
Double top with the second top higher than the first one. In this case we can interpret it in two ways. It could be the classical waves 3, 4, 5 and the corrective wave A at the ending stage. In this case we can anticipate waves B and C. Also it could be the irregular correcton ABC inside wave 4 (rarely in wave 2). In this case we should wait for the wave 5 after that. Traders usually execute short position on the neckline breakdown and suffer when the wave 5 smashed their stop-loss. They are wondering why double top does not working.
Double top with the equal highs has the same possible outcomes. The only one difference that correction called flat instead of irregular.
Double top with the second top lower than the first one. Here is the most common variant is the end of the ABC correction. In this case we have the low potential for shorting the market becuase the new impulsive wave to the upside can hit all stop losses.
Head & Shoulders
This is the easiest pattern for analysis. The right sholder usually is the wave 4, the head, obviously is the wave 5 and the right shoulder is the wave B. On the neckline breakdown we have the shorting potential only in the rest part of the wave C. You could correctly count waves and short that the bearish reversal bar of the wave 5 or, as a last resort, at wave B potential top. Shorting at the neckline has sence only if you are sure that the wave B was the the wave 1 of the impulsive wave to the downside if higher degree and now the market is in wave 3. We have to learn how to count waves in a correct way. I would recommend you to read the Trading Chaos book by Bill Williams because it has the best explanation how do waves work.
Triangles and Wedges
This part is common for all types of triangles (ascending, descending, symmetrical) and wedges (falling and rising). This patterns have the similar structure. If we faced with one of these patterns we have 4 possible scenarios.
Triangle in the downtrend after the wave 3. In this case triangle is the wave 4, which is represented as the triangle correction. This correction type consists of 5 waves A, B, C, D and E. When the wave E is finished market will continue it’s move in the direction of a trend, printing the wave 5.
The same, but in the uptrend.
When the market showed us the 5 waves cycle to the upside and the correction is in progress. Triangle can appears in the wave B. In this case the price will continue the corrective move in the wave C after it’s finished.
The same with the downtrend.
Guys, of course there are much more types of chart patterns. For example, tripple tops and bottoms and so on. The purpose of this article is giving you another view of the market structure and to motivate you studying the Elliott waves theory. Believe me, it has much more potential than it seems on the first glimplse.
Best regards, Ivan
________________________________________________________________________________________________
If you like my educational ideas, please smash the boost button to stimulate me make more quality articles!

USD/CAD corrective mess triangle/complex correctionthe wave count dictates that we are in wave X of a minute degree and yet we haven't show the complete pattern so here is the probabilities:
1) Triangle : it is the highly probable pattern, and since the wave B/X is smaller than A/W and wave C/Y is bigger than wave B/X allows us to assume that a probable triangle would be a barrier triangle, with that being said we should anticipate price being supported at the red line, currently price has made and distinguishable abd correction but even with the NFP report coming out it positive for the Green price couldn't complete wave D this indicates to us that price is preparing a WXY correction inside of wave D but this still remain to the price to make it.
2) WXY : this is probable if price hasn't been supported at the red line we can assume that this corrective pattern is not a triangle which led us to this probability (WXY correction) but we cannot confirm this count until the price break the green line that server us as a support .
3) WXYXZ : as all wave practitioner i do know that this correction is rare but it still possible if price didn't visit the red support and continue it's rising.

GBPUSD LONG GBPUSD OUTLOOK
Waiting for price to hit the unmitigated demand zone to continue the break of structure for a long

ETHUSD | Wave Projection | 4-Wave Always TrianglePrice action and chart pattern trading setup:
> A possible symmetrical triangle 4-wave breakout now a C-wave uptrend resistance SMMA50W - +25-30% upside triangle target (RECOMMEND SHORT ENTRY POSITION)
> Entry @ A pullback trade entry could be possible at EMA10W support
> Stoploss @ lower support B position -15% downside
> Risk reward ratio: 2.5:1
Always trade with affordable risk and respect your stoploss, nothing 100%!

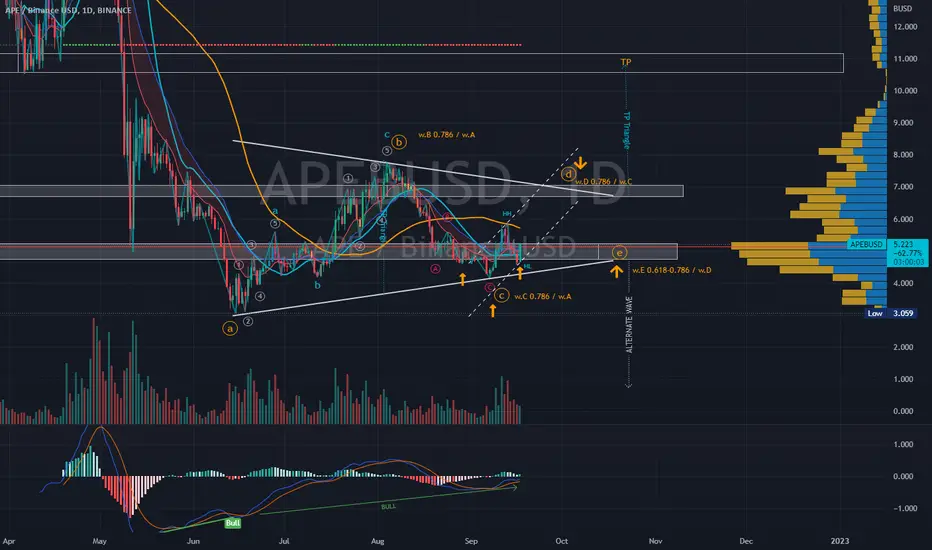
APEUSD | Wave Analysis | Bullish Triangle ABCDE ProjectionPrice action and chart pattern trading setup
> A possible upcoming bullish triangle ABCDE wave within 1-2 months
> B-wave retraced 0.786 of A-wave and recent C-wave retraced exactly 0.786 of B-wave.
> Expecting uptrend D-wave at 0.786 of C-wave with an inverted head n shoulders reversal pattern.
> Entry: head n shoulders breakout
> Target: D-wave position +30%+
> Stoploss: right shoulder -10%
> RRR: 3:1
Indicator:
> MACD above signal line just below 0.
> RSI bullish momentum rebounded from MA line
Nothing is 100%, always trade with affordable risk and respect your stoploss
DELTA | Wave Analysis | Target Projection - Take Profit ZonePrice action and chart pattern trading setup - take profit position
> A descending triangle major wave 2 - ABCDE pattern with 3-3-3-3-3 complex structure
> Target: a possible scenario of making D-wave with an upcoming ending diagonal at the upper resistance of the triangle 0.786-1.0 retracement +15-20% upside
> Stoploss: at the previous high position a-wave - 8% downside
> Risk reward ratio: 2:1 approx.
> After completing the D-wave could possibly retrace downward trend 0.382 - 0.786 for the final E-wave which is the most difficult wave to predict.
Always trade with affordable risk and respect your stoploss
Good luck

LANNA | Wave Analysis | ABCDE Triangle Breakout TargetPrice action and chart pattern trading
> Elliott Wave Projection - Rising triangle wave ABCDE breakout pattern
> TP1 @ Upper channel resistance wave v leading diagonal - 1.382 extension of wave iii +12% upside
> TP2 @ 1.618 extension of wave D +18% upside
> Stoploss @ SMA20 - 6-7%
> Risk reward ratio: 2.5-3:1
Always trade with affordable risk and respect your stoploss
