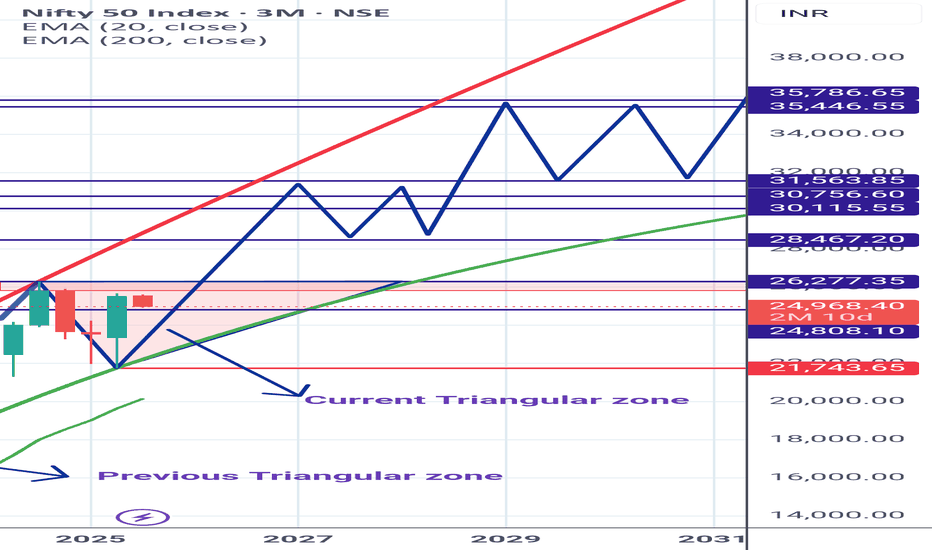
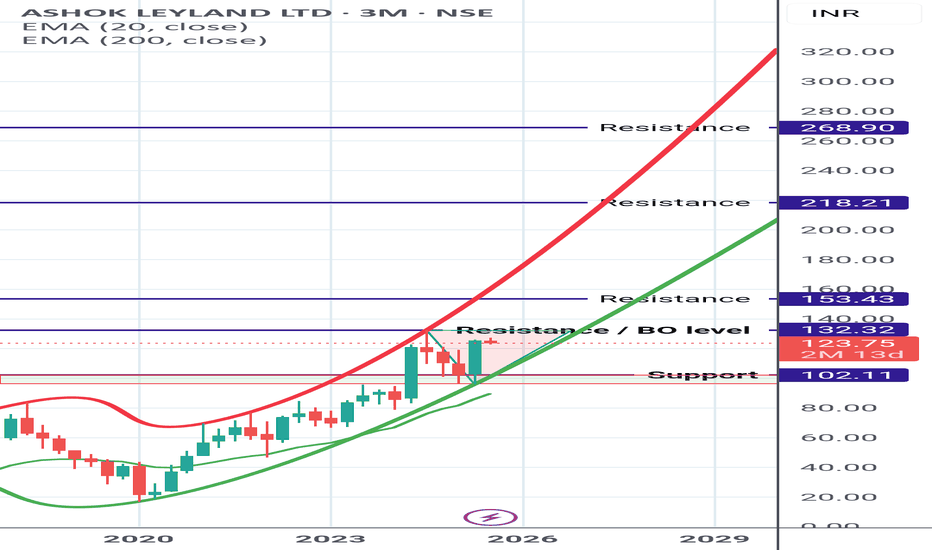
Triangularpattern
AMC's decreasing triangle - waiting for its breakoutAMC has been providing fake buying signals since last June, which has ended up creating a decreasing triangle composed of a buying zone and a series of decreasing maxima.
Right now, the price of these shares is placed inside of a buying zone, which in a normal situation could entail a buying opportunity. Nevertheless, as the triangle figure is very close to the appex,it is a better option to wait until the price of the shares breaks the triangle in any direction. Once it breaks, operating in the direction of the new trend could be a potential strategy.
We'll keep track of this share price evolution
Cipla Triangular pattern at 38% fib level- ready for breakout?Higher time frame analysis was posted on May 10 2021- There I had mentioned "W" pattern formed at 38% fib. So based on that and current behavior of price action I feel like the stock is about to give a breakout. This is not a signal to buy but a stock to watch out for coming days.
Moving down to 15 min time frame it is giving a triangular pattern (which is a breakout pattern). Enter into a long position if 906.75 is broken.
Reliance at a make or break levelNSE:RELIANCE is at a make or break level. It has respected the lower trendline since a long time, but it now faces strong resistance due to sentimental factors as well as rejection of 2200 psychological level. With the AGR dues hearing not being too favourable for Jio and the final verdict expected on August 17th, Monday's trading session should be quite crucial for RIL to keep its flawless uptrend intact.
Historically, the stock has given a fakeout fake out before retracing and then hitting a new ATH after a few weeks. Monday me be one of two things:
Fake out.
Retracement.
Continuation of the uptrend (which may later bring up the discussion about fake out vs break out once again).
Adding to the uncertainty, the past week has not seen very healthy volumes, especially on the trendline support.
While the trend is not bearish yet, I am not confident about entering fresh longs just yet, especially due to news-based factors.
Super triangular patternIn the USDSGD currency pair, we are seeing the formation of a continuing triangular pattern, so we expect the price to continue to move down and touch the following targets.
TP1: 1.38322
TP2: 1.37588
TP3: 1.36853
TP4: 1.34584
If the price goes above the triangle, we expect the price to rise to at least 1.40051. But keep in mind that the probability of a price increase is 20%.
The analysis is performed on a daily basis and is long-term.
🔸Signal by Yazdani
EURUSD Triangular SqueezeStructure: Technical Triangular Squeeze
Tendency: Downward
Fundamental Analysis: With EURO looking to ease as well as a potential for the trade war to move forth potentially further than 2020, this pair is at odds to move indifferently between the two currencies.
Telegram: t.me
GBPAUD Potential Pennant formationUsually this pennant pattern means price action can go either direction. Meaning it requires patience and to wait for a break (aggressive) or break and retest (conservative) before entering.
Given the macroeconomic state of Britain with bearish sentiment regarding the Brexit deal and the formation of this Pennant triangle pattern my bet is on it to eventually break SHORT.
But lets wait and watch if the market agrees!
$BTC and personal Crypto Plays $DIME $DBC $NXT AnalysisSeems as if Bitcoin is on its way to creating another triangular flag pennant for another breakout upwards. Should be interesting as alts begin to run again for the possible 10K break this time :-)
$DIME $DBC and $NXT has some of the best ROI potential in the Crytpo Sphere and great teams at the heads of them. In addition the technology on all three alts should have many eyes on them in the upcoming weeks.
Very long term holds.
XVG-Verge/BTC /Triangular signal/Let's get the industry to know if it's going to get closer to the Crypto industry, or Verge will find himself a virgin
And remember, buy cheap and sell dear. :)
BULLISH BITCOIN PLAYproposed STOP LOSS : ~10,600
proposed TAKE PROFIT : ~17,000
Risk-reward : over 4x
Longer term trend: BULLISH
Current trend: BULLISH
General comments:
Bitcoin has seen bullish movements since the start of February 2018, making higher lows with highs pegged at 11,700. The result is a beautiful bilateral triangular pattern.
A bearish break below the trendline will have my bias be bearish, with a target of around 6,000.
However, a bullish break above the resistance will mean bullish movements are likely. This post will favors and assumes a bullish break in the foreseeable future.
What I like:
1) 3 touches of resistance and bullish trendline. This translates into a
well developed triangular pattern, with support and resistance being highly respected.
2) excellent risk-reward, about 4x.
What I dislike:
1) still quite premature to risk capital for the large play. Fortunately, price hitting the 11,700 resistance is quite likely considering a bullish engulfing pattern formed at the support.
2) A bearish pin formed just after the bullish engulfing bar, showing signs of weakness even for the short term play.
Other things to note:
1) Bitcoin has been bullish for the past month but many other large and mid cap coins are moving sideways. This signals a weak cryptocurrency market and should be taken into consideration should you choose to risk capital for this bullish play.
* Do support by liking and following! All suggestions/feedback welcome!
x,
iskfx
Bitcoin Cash Buy IdeaH4 - Price which was moving inside a triangular pattern has now broken out at the bottom of this pattern.
Currently the price is moving higher, if this turns out to be a false break then wait for the price to move higher and break above the top of this pattern and the most recent high.
Once that happens we can join the bulls.


