Macro Ascending Triangle & Triple Bottom?It appears as though TNY may be trading in a huge ascending triangle on a 4-year chart.
Recently the RSI went to all-time lows, and since then we've seen a nice Triple Bottom & some bullish momentum.
Notice where I've placed the blue sideways arrows, there are three bottoms that coincide with a price range of roughly 23c in March 2017.
Again in late July & Aug 2017 at approximately the same price range.
And more recently we found a low of roughly 18.5c, which could potentially represent the third bottom of the Triple Bottom. We can see on this chart that there was a Triple Bottom that happened in late 2016 until late 2017, I have three blue arrows inside of a descending triangle patten that represent what I am refrencing.
A triple bottom is a visual pattern that shows the buyers (bulls) taking control of the price action from the sellers (bears).
A triple bottom is generally seen as three roughly equal lows bouncing off support followed by the price action breaching resistance.
The formation of triple bottom is seen as an opportunity to enter a bullish position.
There should be an existing downtrend in place before the pattern occurs.
The three lows should be roughly equal in price and spaced out from each other. While the price doesn't have to be exactly equal, it should be reasonably close to the same price, such that a trendline is horizontal.
The volume should drop throughout the pattern in a sign that bears are losing strength, while bullish volume should increase as the price breaks through the final resistance.
Triplebottom

BITCOIN BULLISH - BUT HEADING SOUTH FIRST!Hey all!
Hope everyone is having a geat day! ... errr night. errr wait. Morning. Whatever time of day it is -I hope you're enjoying it.
Update to my previous 5 published ideas.
We look to be continuing to play out the larger CUP AND HANDLE BULLISH REVERSAL PATTERN over -all.
The tricky part has been ID'ing the HANDLE structure and where to expect BTC to begin it's break out. It's looking a bit more clear now.
ALSO! - Keep your eyes and ears out tomorrow into Monday morning with the Stock Market opens... For a better take on the this, check out @davincij15 's Tweet: twitter.com
What do you think? Would love to hear your take on this price action.
Cheers-

Bitcoin triple bottoms never end wellI think it is highly unlikely the yearly low is in. Looking at the weekly chart, we can see the 3-4k range has served as a key has served first as support, then an accumulation range and has been tested for the third time.
From my observation, double/triple bottom patterns are not high probability setups in Bitcoin (or any market for that matter).
Key arguments:
First test: S/R flip. Down move to 3k effectively led us to ATH.
Second test: 4 month accumulation range, led us to 14k (2019 high)
Third test: Q1 2020 collapse as result of global fears.
I think the most significant point here is that the move from early 2019 to 14k failed to reach ATH before retracing the entire move: it seems that interest has been exhausted. I would be surprised if we didn't see 1.5-2k levels in the next 12-24 months. That being said, it would not be the end for bitcoin entirely, but it would see lots of the remaining retail traders/speculators leave the market. If we do recover to over 10k in the next 12 months that would present a very bullish structure, but for now it is sensible to hedge expecting lower prices coming.

Triple Bottom on the RSI? Inverse Head & Shoulder?Since Tinley has broken down from a Descending Triangle / Bearish Flag pattern, which outlined in dark red, it appears as though Tinley may have created a Triple Bottom on the RSI.
It looks like an Inverted Head & Shoulders where I have the Blue arrow pointing sideways on the RSI, and at the same time could be a Triple Bottom if there's continued bullish momentum.
The bottom of the descending triangle pattern is where I expect to see a potential bounce 2, if Tinley can release any substantial news there's merit for bullish price movement back into the pattern or slicing through it like butter.
I expect to see rejection or some heavy resistance preventing Tinley from breaking above were the Green arrow ends upward.
The RSI is so oversold on a 1 year chart it's hard not to consider this a screaming buy with blood on the streets, especially considering pending news announcements that could be quite significant in terms of shaping the company's direction going forward.
On a 1 month chart TNY bounced off the 200 Day MA & is currently trading above it.

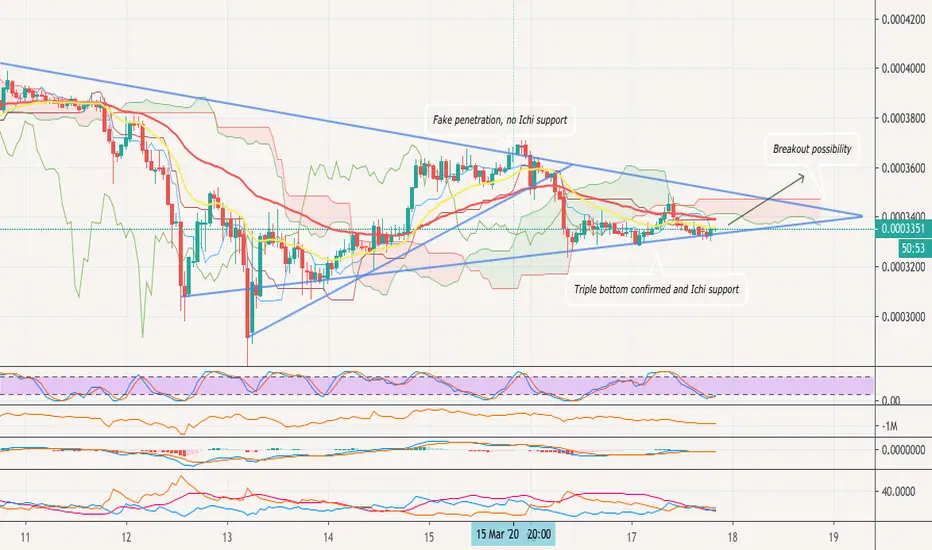
ATOMBTC | Triple bottom and breakout possibilityAt 1H timeframe chart we can see the price action in the Triangle. The first attempt to breakout was made in a local upward movement in a smaller triangle pattern. However there was not enough trade volume and long power support, which is represented by Ichimoku clouds attraction below price action zone on 15th of March.
Currently ATOMBTC formed a triple bottom pattern and accumulated for a bounce, moreover Ichi is now acts like a support and attracts the price action to the higher zone which can result in a massive breakout in the short-term
Entry zone, targets and stop loss are presented in the Premium and Basic channels. You can find Basic channel link in the signature below
Bear Flag? Inverse H&S / Triple Bottom?It appears as though Bitcoin is creating a "micro" series of higher lows forming a pennant pattern, similar to a descending triangle in appearance because of the downward sloping resistance.
Where I have placed the first two Bitcoin Icons represents the higher lows, I'm still watching the pattern develop as the consolidation is taking the shape of an Inverse Head & Shoulders.
An inverse head and shoulders is similar to the standard head and shoulders pattern, but inverted: with the head and shoulders top used to predict reversals in downtrends
An inverse head and shoulders pattern, upon completion, signals a bull market
Investors typically enter into a long position when the price rises above the resistance of the neckline.
After long bearish trends, the price falls to a trough and subsequently rises to form a peak.
The price falls again to form a second trough substantially below the initial low and rises yet again.
The price falls for a third time, but only to the level of the first trough, before rising once more and reversing the trend.
The RSI appears to be topping out, keep an eye on this.
Where I have placed the 3rd Bitcoin icon is a possible third bottom if downward sloping resistance is too bearish.

IOTA Accumulation channel Triple bottom U-turn Potential 60-120%IOTA / BTC Accumulation channel in increments of 60%.
The price is now at the bottom of the channel, for some time it will move in lateral movement, then most likely to the channel resistance + 60% and then working out the reversal pattern a triple bottom . If this happens, there will be a reversal of the main trend.
Target for local work.
The potential of this local work is from + 60-120%.
Stop loss
Under the accumulation channel support line.
During the development of the upward movement, move it up at key levels so that your profit does not turn into a loss. But keep in mind the volatility of the instrument.

BTC- Safe asset? The moment of reckoning! PA/OF analysistwitter.com
All these talks about BTC being the safe asset during the economic turmoil and Financial crisis...
It is now the perfect time for it to step up to the plate and rise to the occasion. Is it finally BTC's moment to shine?
Let's take a quick look at what happened during the weekend.
The fast and furious drop is the result of thin liquidity and IMO, a pure long liquidity grab move. The price did not get violently rejected at the 9.2k because of the extreme momentum, crazy volume, high volatility and overheated buying pressure.
In other words, it was not a blown-off top resulting from the overbought status. The price reversed because the lack of short liquidity (Lack of buyers at 9.2k or weak buying power relative to the strong limit sell orders/walls at 9.2k).
Therefore, I expect it to be the profit-taking move by whales and, whales are possibly building up more long position through split orders.
Fear index is below 20 and the the last time it happened BTC rebounded from 6.5k.
Fast and furious pullback with no bounce like this one BTC is currently experiencing cannot last long. I expect at least some relief rebound. If not, 7.2k here we come.
Proceed with caution and focus on the HTF when the volatility is high.
Please like and follow me if find my post helpful :)

SPY - Triple Bottom/Top ForecastSeen this behavior before and seems very likely to me to be a Triple Bottom.
Look at October 2018 or August 2019 for recent examples. In Oct '18 we had a Triple Top which broke to the downside. Aug '19 was a Triple Bot which broke to upside.
I think it's likely we run up to that red rectangle sell zone again, may not get quite as high as this is a predictable move and smart money wants to get their sell orders filled while prices are moving UP, not trying to chase them DOWN.
If this plays out and we hit the 3rd Bottom, I would be a bit patient because I could see this playing out either way. Buy a Straddle if the IV and premium isn't a killer, or wait for the move--
I have a hard time seeing a 3rd Top sticking, more likely a brief pause and pullback before a breakout and move UP. On the contrary, it would feel to me like a 3rd retest of support that fails will be swift and brutal.

Bull Flag after a Triple Bottom?Or, is ETH trading in a descending triangle that would continue the bearish momentum since the H&S pattern played out recently?


Short/Middle -term idea: BUY TALO @ 18.21Buy @ 18.21
Take @ 24.0 (+31%)
Stop @ 17.3 (-5%)
Due to impact of the coronavirus Energy sector plunged the most among the sectors. That's why it is a good idea to start watching for energy stocks.
Talos Energy highly sensitive to oil prices, therefore I recommend to place close stop order. However the return may be even over $24,0, but more probably that it will touch 24,0 and reverse for correction.
Talos Energy has an aggressive plans to enlarge margins and to cut costs. Please make an research by yourself to proof these statements.
In conclusion, I want to invest in energy sector stock due to the coronavirus impact and I choose one that has a high potential to surge till the year ends.
All energy stocks considered as risky investment, so I strongly recommend to put close stop orders.

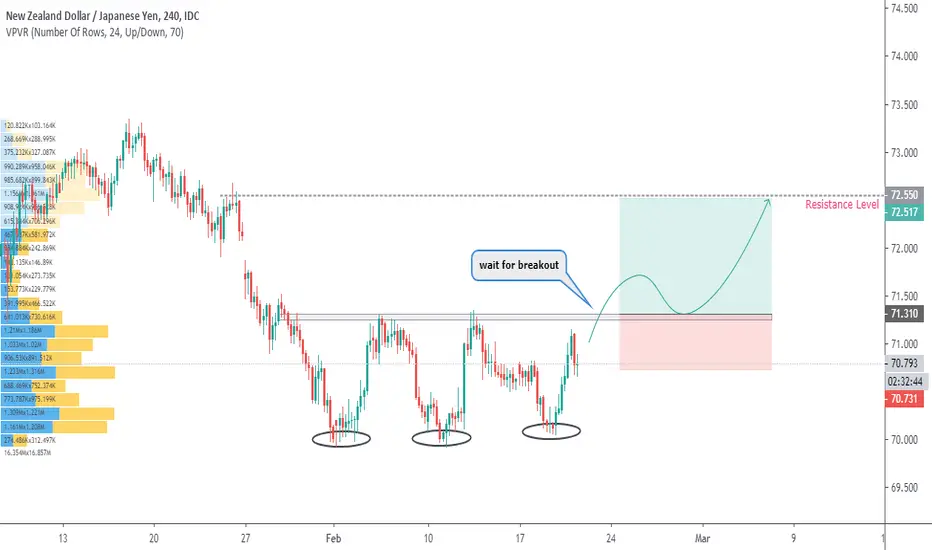
NZDJPY has formed triple bottom patternminor support level has brought price up on my previous analysis (link attached below!), now price formed triple bottom formation and might bring NZDJPY continue its upward movement, wait for horizontal resistance breakout before placing any buy order. be patient!
Plan : horizontal resistance breakout --> wait for prices to bounce off from horizontal support --> wait for the rejection candle pattern to form e.g. bullish engulfing, pinbar etc --> BUY
**Disclaimer** the content on this analysis is subject to change at any time without notice, and is provided for the sole purpose of assisting traders to make independent investment decisions.
Traders!! if you like my ideas and do take the same trade like i do, please write it in comment so we can manage the trade together.
_____________________________________________________________________________________________________________________
Thank you for your support ;)
GWBFX
ENCBTC - Enigma wants to join the BULL PARTYEnigma printed triple bottom 3500-3600 satoshi level. Volume is incresing. potential to test fibo levels 0.682.

CERAGON PatternsCERAGON has formed an Adam & Adam, a triple bottom with a bottom mirror level. RSI is looking for one move down before it enters oversold territory which has historically turned the stock bullish. Symmetry can also be observed on the RSI, which is quite nice.

Is APHA trading in a micro descending triangle?It' possible that if this pattern plays out to the downside Aphria sticks in a Triple Bottom some where equal to the previous two bottoms where I have the green volume icon, ideally the third bottom should be higher than the previous two.
Key Takeaways
A triple bottom is a visual pattern that shows the buyers (bulls) taking control of the price action from the sellers (bears).
A triple bottom is generally seen as three roughly equal lows bouncing off support followed by the price action breaching resistance.
There should be an existing downtrend in place before the pattern occurs.
The three lows should be roughly equal in price and spaced out from each other. While the price doesn't have to be exactly equal, it should be reasonably close to the same price, such that a trendline is horizontal.
Only time will tell, but on a five year chart there's merit for a giant bull flag, see attached chart, or it's possibly a descending triangle. But you can also see a inverse H&S, a lot of familiar bullish patterns.

Is TNY trading in a Ascending Triangle.Possibly a Symmetrical Triangle as well & coincidently upon breakout would negate the descending triangle pattern which started roughly Nov 19th 2019.
Key Takeaways
Symmetrical triangles occur when a security's price is consolidating in a way that generates two converging trend lines with similar slopes.
The breakout or breakdown targets for a symmetrical triangle is equal to the distance between the initial high and low applied to the breakout or breakdown point.
Many traders use symmetrical triangles in conjunction with other forms of technical analysis that act as a confirmation.
Ascending Triangle Key Takeaways
The trendlines of a triangle need to run along at least two swing highs and two swing lows.
Ascending triangles are considered a continuation pattern, as the price will typically breakout of the triangle in the price direction prevailing before the triangle. Although, this won't always occur. A breakout in any direction is noteworthy.
A profit target is calculated by taking the height of the triangle, at its thickest point, and adding or subtracting that to/from the breakout point.
TNY is also trading in what's called a Triple Bottom pattern with the first bottom starting roughly Oct 23rd 2019 where I have the red finger pointing right.
Key Takeaways
A triple bottom is a visual pattern that shows the buyers (bulls) taking control of the price action from the sellers (bears).
A triple bottom is generally seen as three roughly equal lows bouncing off support followed by the price action breaching resistance.
The formation of triple bottom is seen as an opportunity to enter a bullish position.
The triple bottom is similar to the double bottom chart pattern and may also look like ascending or descending triangles. Traders always look for confirmation of a triple bottom using other technical indicators or chart patterns. For example, traders might note that the stock has an oversold relative strength index ( RSI ) before a double bottom forms and/or look for a breakout to confirm that it's a triple bottom rather than a descending triangle or other bearish pattern .
The MA50&200 are the black lines, plus the 200 Day MA is black as well. TNY is trading between the MA50&200 at the moment. Roughly 48% away from the 200 Day MA, which is better than most cannabis related stocks.

WIT Parabolic uptrendWIT has formed a parabolic uptrend, with multiple touches on the uptrend line. Charts pattern formations include, Adam & Adam, Horn bottom, Diamond bottom, and a possible falling wedge. A triple bottom is also present on the uptrend line.

Possible long Keeping an eye on euraud, we are forming a possible double bottom formation and also retesting our trend line support for the third time. So we would be looking for a rejection of this level. Also keeping an eye on the AUD pairs to see if we have some strength.

Is COT trading in a giant Bull Flag?Maybe a descending triangle as well, but seeing the recent bullish upward since Goldman Sachs recommended a buy rating from neutral.
It actually appears as though COT has formed a Triple Bottom, which also appears slightly as a Ascending Triangle. The triple bottom is similar to the double bottom chart pattern and may also look like ascending or descending triangles.
When STZ entered the Cannabis space they used Goldman Sachs to broker the deal.
Goldman Sachs went bullish on Cott a in July, and why? Well, we know Goldman Sachs is supportive of cannabis via the previous brokered deal with STZ & Canopy. They'd be privy to any Safe Banking & States Act regulations, so that may simply be the answer, front running Cott's entry into the cannabis space?
Cott has sold off several assets over the past couple years & have some cash to spend, and seeing so many previous Cott employees in the Cannabis space leads me to believe they may make a surprise entrance into the sector..


USDCAD Triple bottom at supportPrice has stalled around the 1.31600 level again.
As you can see there is strong structural resistance.
There are two plays in mind,
1) A break through this resistance line, small retest and continual bearish movement.
2) A rebound from this line, and a bullish momemtum.
I have marked a minor trend line on the 15minute chart for a tight entry. Stops for a bullish move could be around the 1.31500 mark.
There is divergence on the RSI to support my preferred bullish movement. This has occurred on numerous charts.

XRPUSD forecast on H4, possible triple bottom formation !!Note : XRPUSD failed to breakout 0.23400 resistance (link below), now prices has the potential to form triple bottom pattern, wait for breakout !!
**Disclaimer** the content on this analysis is subject to change at any time without notice, and is provided for the sole purpose of assisting traders to make independent investment decisions.
Traders!! if you like my ideas and do take the same trade like i do, please write it in comment so we can manage the trade together.
_____________________________________________________________________________________________________________________
Thank you for your support ;)
GWBFX
