Triple Bottom for TNY?It appears as though $TNY may have formed a triple bottom where I have the red fingers pointing right on the chart.
In my previous post linked to this chart I spoke about the descending triangle & potentially testing .335c, clearly visible on this chart we can see .33c is about exactly where a new double bottom was created, and thus potentially creating the third bottom of a triple bottom. We will need to see continued bullish price action next week & break out of this pattern flush to the upside, maybe create a top at 44c & consolidate sideways before continuing, who knows, only time will tell.....
The RSI appears to be breaking out of a Bull Flag, and on 5 year & 1 year time frame the RSI is fairly low with lots of room to move to the upside, "if we're looking at a longer term trend reversal."
Key Takeaways
A triple bottom is a visual pattern that shows the buyers (bulls) taking control of the price action from the sellers (bears).
A triple bottom is generally seen as three roughly equal lows bouncing off support followed by the price action breaching resistance.
The formation of triple bottom is seen as an opportunity to enter a bullish position.
Triplebottom
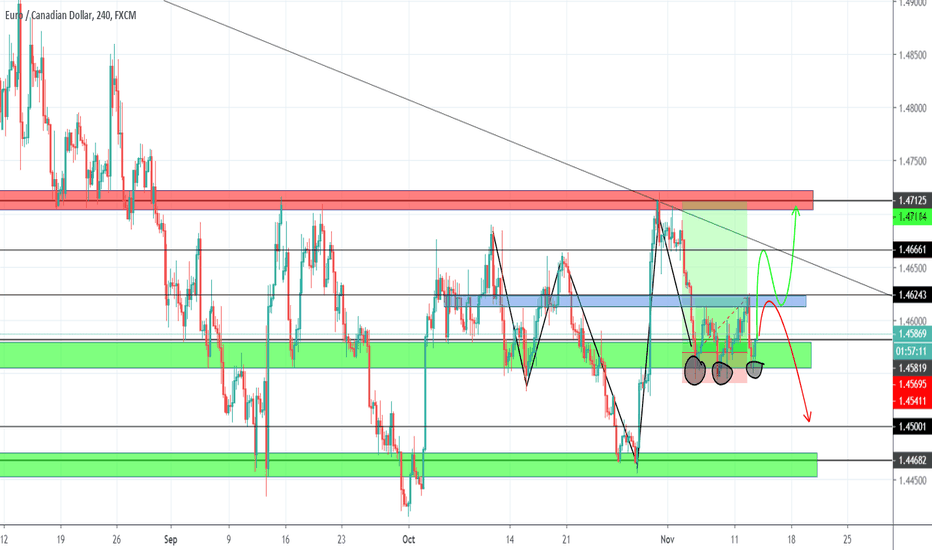
EURCAD Update and AnalysisThis buy has been a long wait. Now price has formed a TRIPLE BOTTOM and formed what looks like a miniature IH&S as it has failed to break above the area around 1.4631. Price could attempt to retest and hopefully break above it or just CRASH further down towards 1.45....
Gud Luck
CLSD - Triple Bottom. Huge Analyst Prediction Clearside Biomedical, Inc. is a clinical stage biopharmaceutical company, which engages in the development of drug therapies to treat blinding diseases of the eye. Its pipeline includes Suprachoroidal CLS-TA, Suprachoroidal, Suprachoroidal CLS-TA, and gene therapy. The company was founded by Samir Kumar Patel, Vladimir Zarnitsyn, Mark Prausnitz, Daniel H. White, and Henry F. Edelhauser in May 2011 and is headquartered in Alpharetta, GA.
Average Recommendation: OVERWEIGHT
Average Target Price: 5.50
SHORT INTEREST
2.26M 07/15/19
P/E Current
-0.48
P/E Ratio (with extraordinary items)
-0.72
HKEX:958 Potential profit 35%HKEX:958 has formed three bottom now. If it can successfully break the 2.5, the target would be 3.05, which will be around 35% return.
Now it has a bottom head and shoulder pattern with target 2.5. Let's see if it can break this resistance and head to our final target.
Cut loss @2.05
Target @3.05
Buy in @2.25
Intraday setup: USD/CAD analysisfocusing on the smaller time frame, the price has created its 3rd drive into that consolidation zone, the price has overextended into a key psych region. Am expecting a retracement towards the 1.32500 area
- Also, GDP for CAD is expected to be lower than previous stat, that could be the catalyst for the price to pick up momentum
great risk/reward of 1:4
Will ARK hold the triple bottom? Chart speaks for itself, can ARK remain in the horizontal channel?
Retesting the yearly lows between 650-700 sats
DRCBTC Is it a dream come true? Is it Near to break a bullish triple bottom pattern? MACD is positive from 2 days and I can see a bullish pattern on 2-4 hours frameset.
ETHBTC Ready to Make Up Ground!!Hello,
Just as I stated in my XRP analysis, that BTC pump caught me off guard just as it did many of you I'm sure.
BUT alts won't play. They are there for a reason.
Crypto veterans aren't going to sit around and hold all of their BTC and not capitalize on the pump.
They will look for good alts to gain even more wealth off of.
Expect ETH and XRP to get some love, as they are actually top players in crypto and on all major exchanges with the most liquidity in BTC pairs.
They are both showing signs of bottom against the BTC bleeding, so take a look!
Or who knows, maybe BTC pumps to 1 million and alts get left in the dust.
Seems... highly unlikely.
Good luck!
- CA$HLESS
Trade Ideas Analysis: EURJPY Triple Bottom2 ways of reading this trade setup, trend traders will read it as the bearish flag and counter-trend traders as triple bottom with RSI Divergence.
As a born counter-trend trader, I'm more into with the latter. I have already engaged the trade and see how this play out.
Great Reward: Risk and not all my decision is just based on that, for this trade there is no recent support level to allow me to have my sell targets to, hence, I will stick with my triple bottom.


