AKRO 4hr triple bottom ideaAkropolis is forming a descending triangle on the 4hr time frame, with a triple bottom on strong support. Money flow is increasing on a larger time frame. Be careful of the bearish divergence on the RSI and the bearish cross on the Stochastic RSI. Set alert and buy the breakout of the upper trend line. For a more aggressive move, buy the bottom of the pattern.
Triplebottom

Bitcoin BTC double bottom triple bottomBITCOIN has a powerful triple bottom! We're about to cross over the 100 day w/ the 50 day and then up to the 200 day and after that I don't know where! The moon maybe? What's to hold anyone back from being a buyer right here? Surely every analyst out there can see this powerful pattern with their own eyes!

ANC/USDT TRADE SETUP! 100% PROFIT POTENTIAL!!Hello everyone, if you like the idea, do not forget to support with a like and follow.
Welcome to this ANC/USDT TRADE setup. ANC looks great here.
Why you should buy ANC?
1. Breaks out from the falling wedge and currently retesting it.
2. Holding very important support of $2.64
3. Making a triple bottom-like structure.
4. Bullish divergence in RSI
It's a low-risk and high-reward trade setup. Buy some now and add more in dips.
Entry range:- $2.64-$2.78
Target1:- $3.22
Target2:- $3.42
Target3:- $4.32
Target4:- $5.80
SL:- $2.56
You can buy it on spot or you can also use low leverage(2x-4x)
If you like this idea then do support it with like and follow.
Also, share your views in the comment section.
Thank You!

GBPNZD LONG Hi Traders, I am happy to present a new idea.
GBPNZD has been plummeting throughout the week and has however met strong support at the current market price. To be precise, the market tested the support twice and has proven even times for me that the downtrend is unlikely to continue.
I am looking for buys because the market has created a triple bottom which means it is testing the current market price for the third time.
GOOD LUCK, RISK WISELY SHOULD YOU AGREE WITH WHAT I SEE.
DANK!!!!

Bitcoin (Falling Wedge - Triple Bottom) Go To Above 60KAccording to my studies, Bitcoin forms the falling wedge and triple bottom patterns, and if this pattern is maintained, it can touch the price above $60,000 again.
Follow me for more analysis...

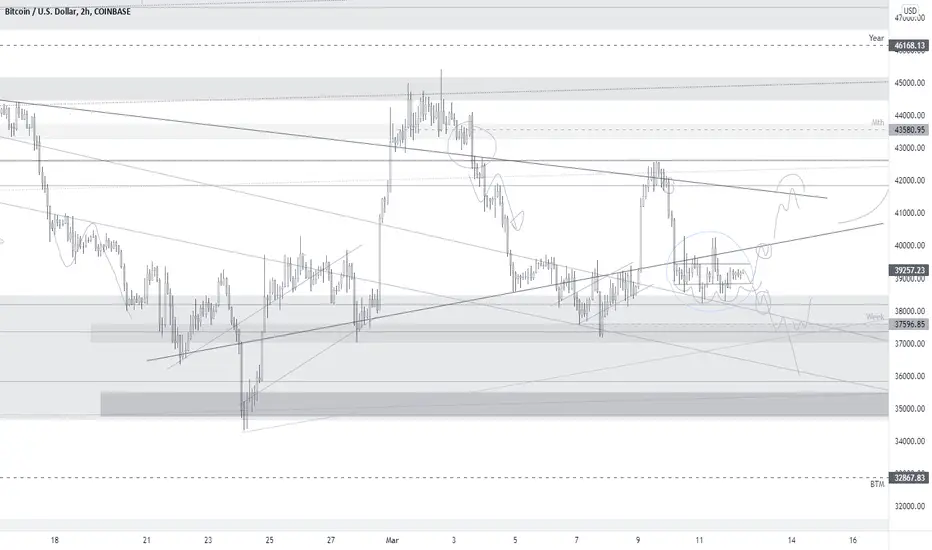
BTCUSD (12/03/2022)In today's analysis I bring two new basic notes on the (2h) BTC chart;
REVIEW :
We are going to make a brief review of the last publication in order to be able to base ourselves on the last analysis.
The latest BTC analysis published on the four-hour chart exposed the most likely of the bullish moves, and so it happened.
Through the reverse shoulder-head-shoulder pattern, the last "shoulder" was generated with a Higher Minimum and we returned to the Triangular Figure to test its top zone.
NEW :
On this time I bring two other notes and quite probable options to go very close, with some more zoom to the chart, (in 2h candles) for its compression in the top area of the triangulation.
- (NOTE1) : Double Bottom
The full price on the parallel channel that is forming a two-low structure, generates a higher minimum over them and attempts to retest the lower triangle area to try to break it and look again for its top zone.
It should also be noted that it is quite common in these situations also the generation of the same structure but with triple bottom on the parallel channel.
-(NOTE 2) : Lowest Low
The price goes beyond the two minimums generated in the Double Bottom, generating a break of the micro structure and going to look for new lows with greater freedom.
---
(It should be remembered anothertime that the situation in Ukraine is a geopolitical key factor for the supply of Raw Materials and Energy Trades in Europe and the entire World, any change in arms and military orders directly affects these markets and indirectly affects Bitcoin )
A greeting, I hope it would be helpful for some of you.
________________________________________________________________
Castellano:
En el análisis de hoy traigo dos nuevas notas básicas en el gráfico (2h) BTC;
REPASO :
Vamos a hacer un breve repaso de la última publicación para poder fundamentarnos en base a ella.
El último análisis de BTC publicado en el gráfico de cuatro horas exponía el más probable de los movimientos alcistas, y así sucedió.
Mediante el patrón de hombro-cabeza-hombro inverso, se generó el último "hombro" con un Mínimo Mas Alto y volvimos a entrar a la Figura Triangular para testear su zona alta.
NUEVO :
Esta vez traigo otros dos apuntes y opciones bastante probables para ir siguiendo de muy cerca, con algo más de zoom a la gráfica, (en velas de 2h) por su compresión en la zona punta de la triangulación:
- (NOTA1) : Doble Fondo
El precio completa en el canal paralelo que está formando una estructura de dos fondos, genera un mínimo más alto sobre ellos e intenta retestear la zona baja del triángulo para tratar de romperla y buscar de nuevo la parte alta. Además hay que tener en cuenta que es bastante común en estas situaciones la generación de la una estructura similar pero con triple fondo en el canal paralelo.
- (NOTA 2) : Mínimo más Bajo
El precio sobrepasa por la parte baja los dos mínimos generados en el Double Bottom, generando una rotura de la micro estructura y yendo a buscar nuevos mínimos con mayor libertad.
---
(Debe recordarse que la situación en Ucrania es un factor geopolítico clave para el suministro de materias primas y energía en Europa y en todo el mundo, cualquier cambio en las armas y las órdenes militares afecta directamente a estos mercados e indirectamente afecta a Bitcoin)
Un saludo, espero que sea útil para algunos de ustedes.
AUDUSD LONG
OANDA:AUDUSD
AUDUSD formed a triple bottom pattern on an uptrend on the 4H, broke the
neckline/resistance of the triple bottom pattern and is forming a retest,
a bullish reversal candle will be a confirmation to go long on AUDUSD

EURCHF | Perspective for the new weekMultiple rejections at the Fr1.0300 level after a year-long of bearish momentum appears to be a sign that we might be on the verge of a reversal that might lead into a corrective phase of the bearish leading price action that began in March 2021.
Tendency: Uptrend (Bullish)
Structure: Supply & Demand | Reversal pattern (Triple bottom/Breakout)
Observation: i.Since March 2021, the Swiss franc recorded 7.8% growth over the Euro to confirm a long term downtrend.
ii. But after testing Fr1.03200 at the beginning of this year - 2022, we have witnessed the sharp rejection of this area from buyers which informs us of the seller's weakness thereby insinuating a possible reversal or retracement is imminent.
iii. FR1.05000 level which has been a niche for selling opportunity was finally broken at the beginning of this month ( February) to emphasize some potentials for the buyers.
iv. The third rejection of the Fr1.03200 area during last week's trading session appears to be the icing on the cake to go long
v. However, considering the long term downtrend involved in this situation, a conscious approach is required to take advantage of a bullish momentum when it finally happens.
vi. In this regard, a breakout/retest of the key level @ Fr1.04500 shall be a confirmation to join the rally... Trade consciously!😊
Trading plan: BUY confirmation with a minimum potential profit of 300 pips.
Risk/Reward : 1:5
Potential Duration: 5 to 10days
NB: This speculation might be considered to make individual decisions on the lower timeframe.
Watch this space for updates as price action is been monitored.
Risk Disclaimer:
Margin trading in the foreign exchange market (including commodity trading, CFDs, stocks etc.) has a high risk and is not suitable for all investors. The content of this speculation (including all data) is organized and published by me for the sole purpose of education and assistance in making independent investment decisions. All information herein is for your reference only and I take no responsibility.
You are hereby advised to carefully consider your investment experience, financial situation, investment objective, risk tolerance level, and consult your independent financial adviser as to the suitability of your situation prior to making any investment.
I do not guarantee its accuracy and is not liable for any loss or damage which may result directly or indirectly from such content or the receipt of any instruction or notification therewith.
Past performance is not necessarily indicative of future results.

GBPCHF a turn at the 0.618 🦐GBPCHF on the daily chart is testing a confluence zone between the weekly resistance and a descending trendline.
The price after a triple bottom over the monthly support started a bullish move with an impulse to the upside and retraced back to the 0.618 Fibonacci level.
How can we approach this scenario?
We will wait for the European market to open and check if the bulls will have enough strength to break above the resistance area.
In that case, we will move on the 4h timeframe and if the price will break and retest the structure we will check for the application of the Plancton academy rules to set a nice long order.
--––
Follow the Shrimp 🦐
Keep in mind.
🟣 Purple structure -> Monthly structure.
🔴 Red structure -> Weekly structure.
🔵 Blue structure -> Daily structure.
🟡 Yellow structure -> 4h structure.
⚫️ Black structure -> <4h structure.
Here is the Plancton0618 technical analysis , please comment below if you have any question.
The ENTRY in the market will be taken only if the condition of the Plancton0618 strategy will trigger.

TATASTEELDetail explanation provided in the chart.
Disc - Am not a SEBI registered. Please do your own analyses before taking any position. This post is only for educations purpose.

KOG - BASIC CHART PATTERNSThis is our first post in a series of posts about chart patterns. Followers of KOG will know we are technical traders so we are always looking out for candlestick and chart patterns as part of our trading plans and analyses.
These are what we feel the 6 most common and basic chart patterns that you will find almost daily on the smaller time frames. During the course of this series we will look at each and everyone in more detail and give you live examples of how they work.
TIP: When trading chart patterns its always best to wait for the neckline of the pattern to break, this confirms the movement in the chosen direction. Chart patters also work best at key levels of support and resistance and at the top or bottom of trends. For example, if you see the price is at the top of the trend and a Head and Shoulders pattern is forming, this is the first sign of a reversal on price.
Below is a live example of one of our favorite chart patterns, the Adam and Eve. You can see how we identified the pattern and looked for the neckline to break which confirmed the movement in the direction we wanted.
Hope this helps traders.
As always, trade safe.
KOG

Triple Bottom Pattern in Weekly kandleIn the weekly time frame in dogecoin a triple bottom pattern is formed.Also after the second collision with the neckline,a Cup pattern has been formed.If the neckline breaks upwards,we will have a price increase as indicated in the chart.

That darn crypto playing games But for real though I see it’s going to pop back down and test that support spot but not before some normal level of the Fibonacci like .618 or .5 or maybe but I feel is not likely is hitting the .382
Be reactive traders! Never predictive! Your not a fortune teller because if you were you wouldn’t be reading this lol

EURO possible forming triple bottom. 25/Jan/22EURO stock's price currently seating near @ Long Term Parallel Channel (Cyan) Median Line ( Dashed Line ) possible forming a triple bottom near the long term demand zone.

Triple Bottom Pattern for dogecoinIn the one-hour time frame in dogecoin.a triple bottom pattern is formed.If the neckline breaks upwards,we will have a price increase as indicated in the chart.

NZDCHF looking up 🦐NZDCHF on the daily attempt 3 times to break the weekly support creating a triple bottom.
The market took the liquidity and is now moving upward, with a test of a resistance area.
According to Plancton's strategy IF the price will break above the structure and the academy conditions will be satisfied we will set a nice long order.
––––
Follow the Shrimp 🦐
Keep in mind.
🟣 Purple structure -> Monthly structure.
🔴 Red structure -> Weekly structure.
🔵 Blue structure -> Daily structure.
🟡 Yellow structure -> 4h structure.
⚫️ Black structure -> >4h structure.
Here is the Plancton0618 technical analysis , please comment below if you have any question.
The ENTRY in the market will be taken only if the condition of the Plancton0618 strategy will trigger.

BP: on watch for breakoutIf you're bullish oil, watch BP for potential break out.
Initial target between 28 and 30, then 34-35

Atom Cosmos Next Triple Bottom?BINANCE:LINKUSDT
Hello Traders,
Atom is trading in ascending channel making higher highs and higher lows. Atom formed triple bottom during may-august and price increased 150% after breaking out of 16-17 support zone. Atom has been trading between 18-44 starting from September and forming a potential triple top or triple bottom which are reversal patterns. There was a 130% price difference between support and resistance zone bak in May-August period and we are observing approximately the same difference between support and resistance zones September-January period.
If the price breaks above 45 I would open a long position and would expect at 100-150% increase in prices (80-100 USD).
First TP 55
Second TP 75
Third TP 100
If not we could see new higher low somewhere around 25-26 USD, again which would be a good price levels to open a long position.
Overall, Atom Is strong against Bitcoin and if there is a minor increase in bitcoin prices we could see 2-3x in Atom prices.
Good luck and trade smart! (not a financial advice)
Please like and share if you like my idea.

PSB broke out of the flag pattern and is ready to march higherNYSE:PSB triple bottomed and now broke out of the flag continuation pattern. Anticipated price action and targets are shown on the chart, stop loss daily close below 148$.
Hit the like button please if you find this useful :)
This is only my own view and not financial advice, do your own analysis before buying or selling
Happy Trading!

BTC.DBitcoin dominance is forming a triple floor pattern in daily timeframes
In the 4-hour timeframe, it broke its downward trend line and completed the pullback
I think it can grow well

REEFBTC TO BE FORMING TRIPLE BOOTOM seems to be forming a triple bottom pattern.
As can be seen, it has broken its dynamic resistance upwards and is a good sign to move upwards.
You can buy in Pol back!!!
tp1: 94
tp2:116
sl:31

$SE extreme oversold levels, strong bounce in next few days $SE extremely oversold, looking for a long out of demand around this 200 level for a mean reversion to 250 in the short term. Strong growth stock backed with fundamentals, short covering rally is coming. Also to mention we are directly at the 100MA on this weekly chart, green day in the market will send this thing up quickly.

POLYCAB LTD. - Strong triple bottom formation on its wayFSP - POLYCAB LTD.
positive - a strong triple bottom formation on the way, wait till it bounces off, once take support it will rise back or even give a breakout.
negative - if it breaks support it will dip to the bottom support or create a new support below the current one.
