AUDNZD 30m Reversal at Major Daily Resistance ZoneAUDNZD has a major resistance at the 1.0750 area, and it has broken a support trendline after testing 1.0750.
You can also say that a triple top has formed on the chart, with a slightly strange support (neckline), but nothing in the forex market is like they say it is in the textbooks.
Tripletop


Eur/Yen Short triple topTriple touch at the top. Resistance at 121.000 right now, waiting for break downwards.


USD/CAD broke support and retested broken supportUSD/CAD has broken through support and has been rested three times, I've used the 4h timeframe to check the prediction and also used the 2hr/2hr timeframe to enter my trade.
I have used a XACBD pattern which shows a bearish cypher pattern. A new triple top has emerged which would indicate that the market will fall heavily.
Hope this is beneficial and everyone hear that is trading, trade safely guys (y)

AUDUSD Triplet Top Patternpossible pullback ,
For the moment we are waiting for confirmation.
be careful traders!
our sl and tp
As you can see:
SL:0.76495
TP:0.75596

GBPCAD 4h Short off Broken Support TrendlineSupport TL broken during a strong bearish move by the GBP today
Also looks like a triple top on the 1h chart.
Price may retest broken support Tl as resistance, and likely go down from there

Lean HogsApril Lean Hogs is fighting lower prices. The last 3 days were crazy. We may continue uptrend on Monday as Feb Lean Hog (see below) has created a Harami pattern suggesting higher prices. The USDA index for Lean Hog is 68.11 area and has been rising. If we get a triple top, we may be looking at even higher prices. Next USDA index comes out at 8:45 Chicago time. This market is also under the 20 day moving average.

USDCAD 1H Triple Top/Head & ShouldersOn the 1H chart we have a pretty nice formation, whatever you want to call it, they both mean the same thing.
It signifies that the trend is coming to an end.
Most importantly is the third impulse - third top or the second shoulder - and that it is the lowest of the three.
To me, that shows that bulls are slowing down and bears are entering the market.

Bearish AUDUSDon the 240 time frame there is a wedge pattern an this can possibly break to the downside becasue RSI is showing divergence whilst the market showing a upward moving wedge this can led to the market falling

Engulfing kicker at daily resistanceHey guys,
today i want to share a traditional structure based trade that's on my watchlist today. On the left hand side of the chart you can see on NZDUSD we are fronting a key resistance level that may stop price action's rally. If you follow me for a while you know i'm a conservative trader and that i need additional reasons for entry in order to set my orders.
On the 4 hr chart (on the right hand side) you can see a closer look to the last price action's movements. Price's forming a triple top right now with RSI divergence. From my bigger view i know i want to be bearish and then i'm considering only shorting opportunities.
Price is also putting an engulfing kicker which i sometimes use as reason for entry. And that's the case!
If the current candle will close below the previous opening i'm going to sell this. With targets and stops as indicated above.
Let me know if you have any doubt.
Otherwise, see you in the next chart!

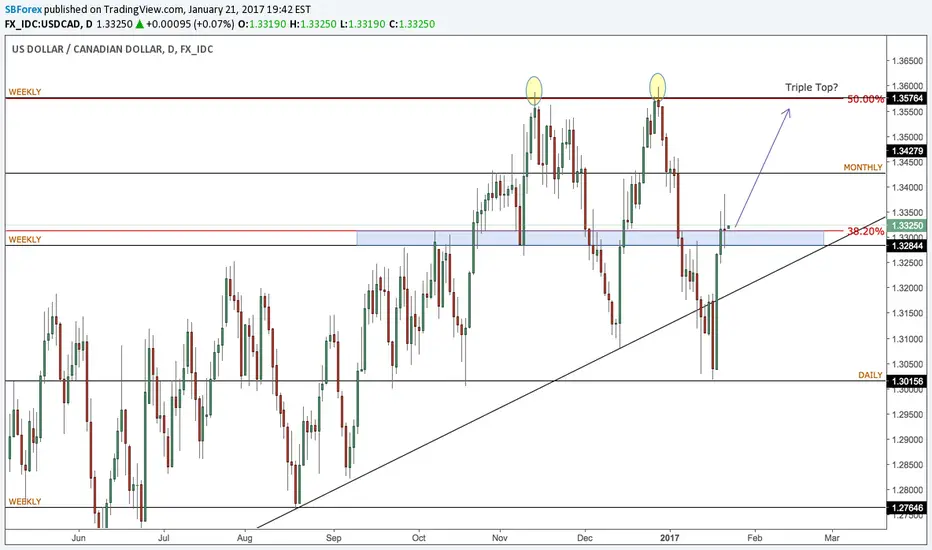
USD/CAD bullish weekly close, potential triple topThis chart is really interesting. USD/CAD faked out of this weekly trendline, with CAD weakening as BOC stated they are leaving the door open to near term rate cuts. This could see continued CAD weakness in the coming week and lead to prices testing the key 1.3580 level to the upside. Our overall bias is still short so we see a triple top forming at the .50 retracement, but this could present opportunities for intra-day buys.

usdchf - triple top USDCHF is at 78.6% gartley reversal level and could be a triple top here for safe entry short on breakout of neckline or possible retest

NZDCAD Daily Triple Top w/ Slanted Neckline3 times price on this pair retested the resistance zone surrounding 0.96 seen above. The first time price reacted bearishly (the first top), however it did not go far down as it did previously (see 2015-12-29 date on chart). The second time price broke above the zone but then fell some - forming a second top and then going down to make a higher low. Then again, the third time it formed ANOTHER higher high and is currently going down from that.
The fact that there has not been a lower high followed by a lower low suggests that this pair is technically still up trending. This is key, however, because that means that we can get a position in on time.
The white support trendline is in fact the formation neckline. Price will definitely head to the TL next week, and then maybe to the 0.9290 area. We must wait for a lower low and then for a lower high to short this pair, or at least I am, you do what you like.

AUDJPY Shorting Possibilities AUDJPY has a lot of shorting potential at the moment, however any position we are going to take needs to be confirmed due to the subjectivity of the trades on offer - meaning I am expecting an overall selling direction but there are more than a couple of things price can do first which can be seen on the chart.
Sell any breakout as and when it occurs - this is not my ideal setup but one I would like to get into IF it occurs before our other, more idealistic setups which I am going to mention now:
My ideal setup consists of either getting in short at the red resistance level or, preferably, at the higher trend line at sell zone 2. The latter of the 2 will give us more confidence that price wont continue up any further allowing for tighter stops and better RR = more profitability.
We will be expecting a breakout of this downtrend in the future (we have a lot of divergence on the daily to suggest this is the case) just like on other JPY pairs however we will not be looking for this long set up yet.
As usual, take trades only after confirmation & good luck!

Markets Alert: TSLAA dreaded triple top?
Entry alert on Tesla Motors. TSLA when the price break the triple top ... Please be careful, feelings and emotions in the market
"An investment in knowledge pays the best interest" - Benjamin Franklin
Stay tuned for more, visit: www.southment.com
Sign up for The Big News


USDCAD: Triple Top Reversal?!Hi Traders,
I have been eyeing this setup for most of the week. There is a 2618 selling opportunity very close to market.
This pair has made a triple top (see marked on chart), which is a sign that we may see a bearish reversal and downside continuation in the coming week. I have a position ready to sell at the 61.8% fibonacci retracement, it has extra confirmation as this level comes in line with previous support turned resistance.
I place my stop above the triple top highs, because if price breaks this level I will be wrong.
Targets are at the 100% and 127.2% extensions of the move (See green boxes)
Good trading and have a great weekend all.
Luke

NZD/USD Triple TopThis is my View for NZD/USD so far. This Pair is moving within an ascending Channel and formed a triple top. I'm waiting for a breakout to the downside and enter a short position after a confirmation.
Trade safe, Daniel
Likes and Comments would keep me motivated.

OIL TRIPLE TOP Hi guys, so we got another oil triple top. We should easily see 44 and below and even onwards of 40s (likely), what i would advise is enter a sell and switch to a 4hr Heikin grapgh to use to take profit, anyways enjoy and good luck.

NZDUSD Analysis Week of August 14, 2016Price had a hard time making a HH for the week. The TDI has crossed upwards but seems to be lagging. Downside is upon us.
On the 4H chart there are two key confluences to look to short this pair.
1. Triple Top
2. Divergence
Support should be a good area where price will mee for the week.
Trade safe!
