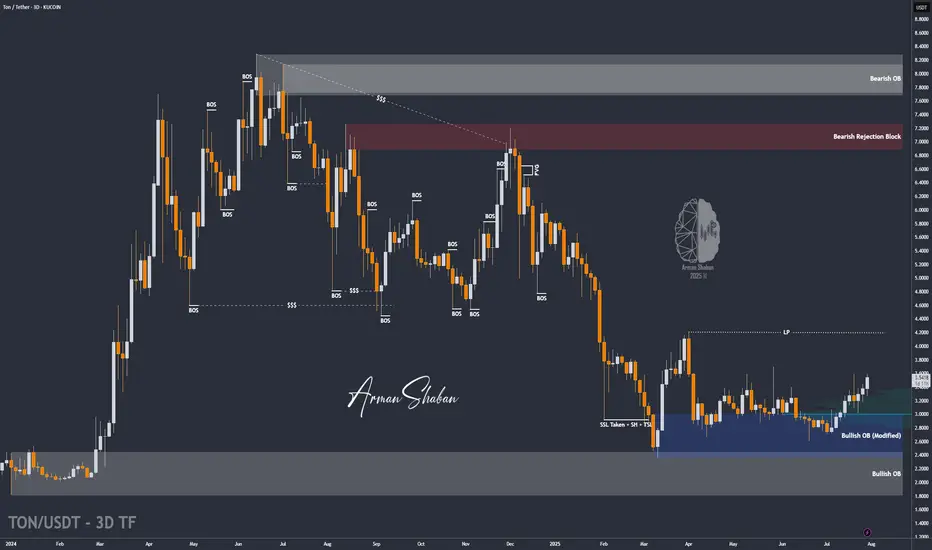
TON/USDT | Surges 18% – Eyes on $3.63, Then $4.20 and $4.68!By analyzing the Toncoin chart on the 3-day timeframe, we can see that after a pullback to the $3 area, strong demand kicked in, and within just one week, the price surged over 18%, reaching above $3.5. Toncoin is currently trading around $3.53, and I expect it to hit the $3.63 target soon. The next bullish targets after that are $4.20 and $4.68.
Please support me with your likes and comments to motivate me to share more analysis with you and share your opinion about the possible trend of this chart with me !
Best Regards , Arman Shaban
TRON
DOGE/USDT | Eyes Bounce from Key Support – Next Targets Ahead!By analyzing the Dogecoin chart on the daily timeframe, we can see that after reaching the $0.29 area, the price entered a correction and is now trading around $0.22. If DOGE dips into the key support zone between $0.19–$0.21, we could expect a strong bullish reaction. The next potential targets are $0.287, $0.32, $0.41, and $0.70.
Please support me with your likes and comments to motivate me to share more analysis with you and share your opinion about the possible trend of this chart with me !
Best Regards , Arman Shaban

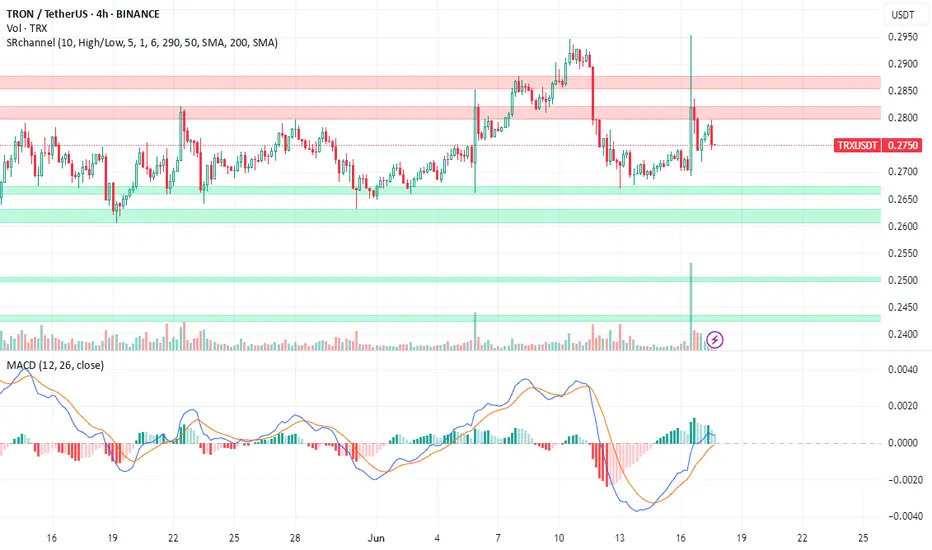
$TRX — "The Samurai Path" of Crypto? Long-term TRON outlook In a market where coins spike and crash from every tweet, CRYPTOCAP:TRX behaves like a stoic monk.
The price of OKX:TRXUSDT moves steadily, avoiding wild dumps and pumps — as if it exists in a parallel reality.
Now consider two events that would usually explode any altcoin’s chart — but not CRYPTOCAP:TRX :
📅 July 24 — Justin Sun’s TRON Inc gets listed on NASDAQ.
📅 July 28 — TRON Inc announces plans to raise $1B to buy back CRYPTOCAP:TRX and hold it on their balance sheet.
🔍 And yet… the chart remains calm. No hysteria. No euphoria.
Why?
Either CRYPTOCAP:TRX is so predictable that all news is already priced in —
or we simply don’t fully understand the inner mechanics of this ecosystem.
🧭 We call this "The Samurai Path":
Silent. Stable. Emotionless. But with serious long-term potential.
On the chart, we outlined how OKX:TRXUSDT has been moving — and what we expect next.
Because a market cap of $31B is already massive.
But $161B? That’s a statement...
📊 Can #TRON become the next “stable giant” of crypto — or will it surge when no one expects?

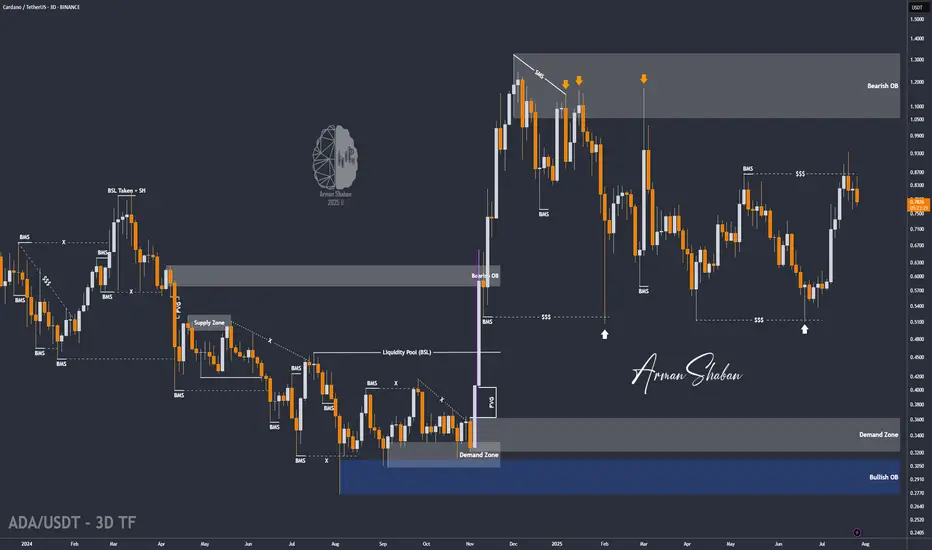
ADA/USDT | Pullback to Key Support – Can It Rebound Toward $1.32By analyzing the Cardano chart on the 3-day timeframe, we can see that after reaching $0.935, the price faced selling pressure and dropped by 18% to the $0.76 area. Now, the key is whether ADA can hold above the $0.75 level by the end of the week. If it succeeds, we could expect further bullish continuation. The next potential targets are $0.86, $0.93, $1.02, and $1.32.
Please support me with your likes and comments to motivate me to share more analysis with you and share your opinion about the possible trend of this chart with me !
Best Regards , Arman Shaban
Check if the second step-up trend can be maintained
Hello, traders.
If you "Follow" us, you'll always get the latest information quickly.
Have a great day.
-------------------------------------
(TRXUSDT 1M Chart)
We need to see if the price can sustain itself by rising above the left Fibonacci level 3.618 (0.3607) and the right Fibonacci level 1 (0.3742).
When the next monthly candlestick is formed, we need to check the movements of the supporting indicators.
-
(1W Chart)
The DOM (60) indicator on the 1W chart is showing signs of forming a new trend.
Accordingly, we need to examine whether a rise above the left Fibonacci level of 3.618 (0.3607) will trigger a new wave.
The left Fibonacci level was created during the first rising wave.
Therefore, if the price rises above the left Fibonacci level of 3.618 (0.3607), a new wave is expected to form.
Since the HA-High indicator on the 1W chart is formed at 0.2683, if the price declines, support near 0.2683 will be crucial.
-
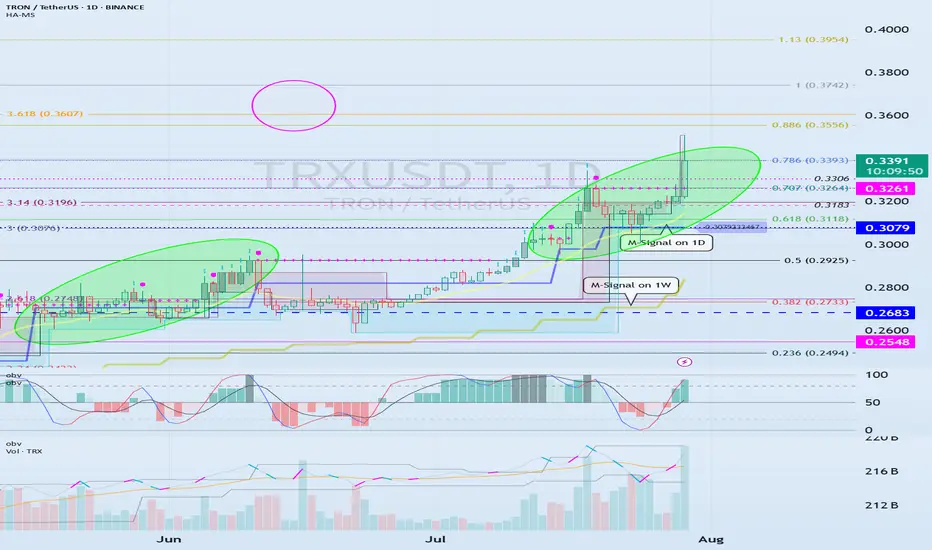
(1D chart)
If the price maintains above the 0.3079-0.3261 range, further upside is expected.
For the price to rise above the left Fibonacci ratio of 3.618 (0.3607) and the right Fibonacci ratio of 1 (0.3742), the OBV indicator of the Low Line ~ High Line channel must rise above the High Line and remain above it.
However, since the StochRSI indicator has entered an overbought zone, the upward movement may be limited.
Therefore, we need to consider how to reset the indicator.
-
The price is continuing a stepwise upward trend, rising above the HA-HIgh indicator.
It is currently in its second stepwise upward movement.
Therefore, the key is whether the price can sustain above the HA-High indicator.
Whether a third stepwise upward movement occurs will depend on whether the price can sustain itself around or above the 0.3079-0.3261 level.
-
Thank you for reading to the end.
I wish you successful trading.
--------------------------------------------------
- Here's an explanation of the big picture.
(3-year bull market, 1-year bear market pattern)
I'll explain more in detail when the bear market begins.
------------------------------------------------------
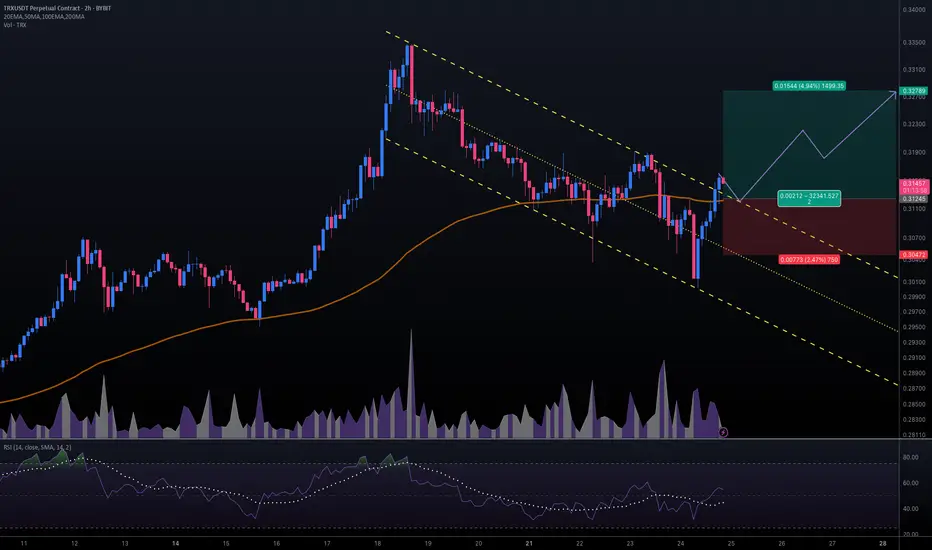
#TRXUSDT #2h (ByBit) Descending channel breakout and retestTron just regained 100EMA support and seems ready for bullish continuation after a pullback to it.
⚡️⚡️ #TRX/USDT ⚡️⚡️
Exchanges: ByBit USDT
Signal Type: Regular (Long)
Leverage: Isolated (16.0X)
Amount: 5.1%
Entry Targets:
1) 0.31245
Take-Profit Targets:
1) 0.32789
Stop Targets:
1) 0.30472
Published By: @Zblaba
CRYPTOCAP:TRX BYBIT:TRXUSDT.P #2h #TRON #DPoS #L1 #Web3 trondao.org tron.network
Risk/Reward= 1:2.0
Expected Profit= +79.1%
Possible Loss= -39.6%
TRX Grinding Higher – Are These the Next Targets?📈🔥 TRX Grinding Higher – Are These the Next Targets? 🧱🚀
Continuing the Altcoin Series, let’s take a look at TRX (Tron) — quietly grinding higher while the crowd stays distracted elsewhere.
As I’ve said before: I’m preparing to divorce altcoins at the top of this cycle. But until then, I’m a trader — and TRX is a chart that deserves our attention right now.
🔍 Two Perspectives, One Message
The 1H intraday chart shows clear structure within an ascending channel, holding its higher lows beautifully.
Meanwhile, the 2D macro chart reveals a long-term channel breakout, now pressing up into key resistance.
📊 Levels That Matter
Short-Term Support (1H):
🔹 $0.29926
🔹 Mid-channel trendline
Macro Zones (2D):
🔸 Current Price: $0.30991
🔸 Next key levels:
$0.38540
$0.46122
Structure to Watch:
Price remains well-supported by the orange trendline — a multi-year diagonal that’s been acting as dynamic support. As long as that holds, TRX remains on the offense.
⚠️ Narrative-Free Trading
Let’s be real — Tron isn’t the sexiest narrative play.
But the chart doesn't lie: structure is intact, trend is up, and targets are in sight.
This is the kind of setup where emotion gets left at the door — we trade the level, not the label.
Buy over support
Exit near resistance
Control risk — always
TRX may not trend forever — but for now, it’s trending just fine.
One Love,
The FXPROFESSOR 💙
Disclosure: I am happy to be part of the Trade Nation's Influencer program and receive a monthly fee for using their TradingView charts in my analysis. Awesome broker, where the trader really comes first! 🌟🤝📈

TRON TRX Eying New ATH📈 After 6 months of sideways accumulation, CRYPTOCAP:TRX is finally picking up momentum. A weekly close above $0.317 could trigger acceleration toward the next targets at $0.50–$0.60 🚀

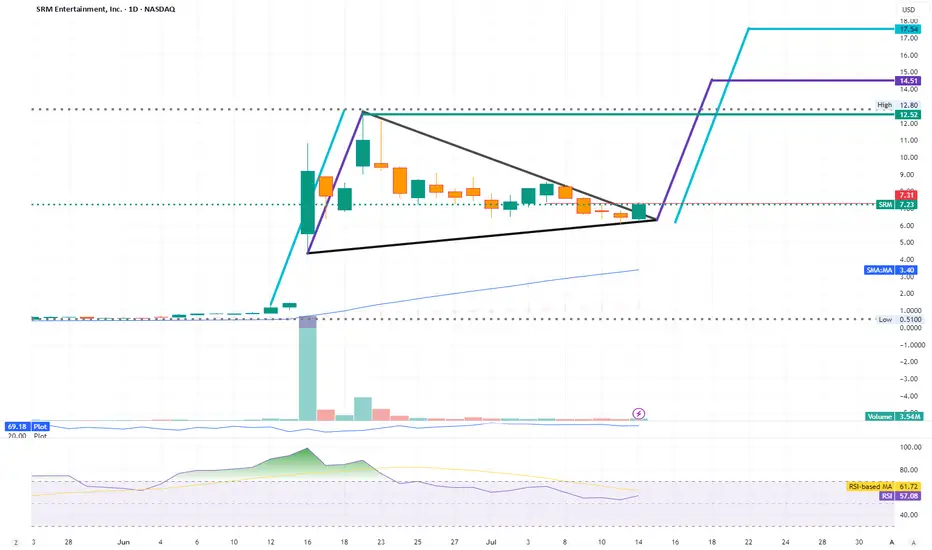
SRM - SRM Entertainment Inc (Soon to be TRON INC.)SRM Entertainment (SRM) used to design, development, and delivery of toys and themed merchandise for the global amusement and entertainment industry. They work with popular brands like Harry Potter, Frozen, Marvel, and Star Wars to create exclusive products found in various venues. However, through a reverse takeover they're are planning to change their name to Tron Inc.
The main reason for this shift is a $100 million equity investment dedicated to a new TRON Token Treasury Strategy. Justin Sun, the founder of the TRON blockchain, is also coming on board as an advisor. This move means they're completely shifting away from their prior business to focus on revenue generation within the blockchain space, with plans to implement a dividend policy through TRX staking.
Financially, SRM's past performance showed some weaknesses, with negative net income. However, what they did in the past is meaningless and has nothing to do with what they are doing now. The new $100 million investment significantly changes their financial outlook, providing substantial capital for their new direction. Currently, they report around $1.09 million in cash and short term investments, with total assets at about $5.81 million and liabilities around $828K.
The move into blockchain with a significant investment and Justin Sun's involvement could position them in a growing technology sector. If the TRON Token Treasury Strategy is successful and the blockchain market expands, there's potential for upside and a dividend policy from TRX staking could attract investors.
Their new model focuses on the TRON Token Treasury Strategy. They plan to generate revenue by acquiring and holding TRON (TRX) tokens, benefiting if the TRX value increases. They'll also earn staking rewards by locking up their TRX holdings to support the TRON network, and, once stable, they intend to distribute a portion of these staking rewards as dividends to shareholders. This strategy ties their financial performance directly to the TRON blockchain ecosystem.
Overall, this is a high risk, high reward situation. It will requires careful monitoring given volatility of the crypto market. It's not a typical long term, low maintenance investment at this stage.
TRX's situation+ Target PredictionFinally, the price broke the wedge, and the price experienced a significant drop. I think is the time for TR to rise again to 0.73 after more correction . STRONG SUPPORT 0.26.
Previous analysis
Give me some energy !!
✨We spend hours finding potential opportunities and writing useful ideas, we would be happy if you support us.
Best regards CobraVanguard.💚
_ _ _ _ __ _ _ _ _ _ _ _ _ _ _ _ _ _ _ _ _ _ _ _ _ _ _ _ _ _ _ _
✅Thank you, and for more ideas, hit ❤️Like❤️ and 🌟Follow🌟!
⚠️Things can change...
The markets are always changing and even with all these signals, the market changes tend to

Tron (TRX) Price Prediction: Nasdaq Deal Fuels Bullish ForecastThe $210 Million Nasdaq Rumor: Deconstructing the Hype for a Realistic Tron (TRX) Price Prediction
In the volatile theater of cryptocurrency, headlines can ignite market-moving frenzies, and few have been as potent as the recent whirlwind of news surrounding Tron (TRX). The prospect of a planned Nasdaq listing via a $210 million reverse merger, intertwined with the enigmatic presence of the Trump family, sent shockwaves through the community, promising a new era of mainstream legitimacy and sparking wildly bullish price predictions. However, as the dust settles, a clearer, more nuanced picture emerges—one that separates explosive rumors from the fundamental drivers that will truly dictate the future of Tron's price.
The core of the excitement stemmed from a strategic deal involving SRM Entertainment, a Nasdaq-listed company specializing in theme park merchandise. In a stunning pivot, SRM announced it would rebrand as Tron Inc., initiate a substantial TRX treasury funded by a $100 million private equity investment, and appoint Tron's founder, Justin Sun, as an adviser. This "reverse merger" was widely interpreted as a backdoor for the Tron blockchain to gain a coveted spot on a major U.S. stock exchange, a move that would grant it unprecedented access to traditional capital and validation. Adding a layer of political intrigue, the deal was facilitated by an investment bank where Eric Trump and Donald Trump Jr. serve on the advisory board.
This confluence of high finance, crypto ambition, and political association created a perfect storm for speculation. The stock price of SRM Entertainment skyrocketed over 500%, and the price of TRX saw a notable jump. However, the narrative quickly became more complex. Eric Trump clarified his position, denying any direct "public involvement" in the new company, despite expressing his admiration for Justin Sun and their established business connections.
While the deal with SRM Entertainment is very real, its direct implications for the TRX token are more complex than a simple "Nasdaq listing." The transaction is for the corporate entity, which will hold TRX in its treasury, not for the decentralized TRX asset itself to be traded on Nasdaq like a stock. This distinction is critical. The move provides Tron with a publicly-traded vehicle and significant capital, but the ultimate value of TRX still hinges on the utility and adoption of the Tron network itself. Therefore, a realistic price prediction must look beyond the initial hype and analyze the bedrock of Tron's fundamentals.
Deconstructing the Hype: The Nasdaq Deal and Trump Connection
The plan for SRM Entertainment, a Florida-based supplier of toys and souvenirs, to morph into Tron Inc. is a masterclass in financial engineering. Through a reverse merger, a private company (in spirit, Tron) can go public by merging with an existing publicly-traded company (SRM), bypassing the rigorous and lengthy process of a traditional Initial Public Offering (IPO).
The deal, valued at up to $210 million upon full exercise of warrants, involves SRM receiving a $100 million equity investment from a private investor to initiate a "TRX Treasury Strategy." This strategy mirrors the approach of companies like MicroStrategy with Bitcoin, where the public company's assets are heavily invested in a specific cryptocurrency, making its stock a proxy for that asset. With Justin Sun serving as an adviser, the new Tron Inc. plans to implement a TRX staking program and even a dividend policy for its shareholders, further intertwining its fate with the Tron ecosystem.
The involvement of the investment bank brokering the deal brought the Trump name into the headlines. Eric Trump and Donald Trump Jr.'s roles on the bank's advisory board led to speculation about their involvement in the new Tron Inc. However, Eric Trump later clarified his position, separating his personal and business relationships from a formal executive role in the public venture, though the connection undeniably added to the initial media frenzy.
Beyond the Rumors: Tron's True Fundamental Strengths
With the Nasdaq hype contextualized, the real question for investors is: what is the intrinsic value of the Tron network? The answer lies in its undeniable dominance in one of the most crucial sectors of the digital economy: stablecoins.
The Undisputed King of USDT
The Tron network has become the world's primary settlement layer for Tether (USDT), the largest stablecoin by market capitalization. The network hosts over $78 billion in USDT, a figure that has surpassed the amount on its main rival, Ethereum. This dominance is not accidental. Tron's architecture, which allows for high throughput and extremely low transaction fees, makes it the preferred network for USDT transfers, especially for retail users and in emerging markets.
During a single month in mid-2025, the Tron network processed over $694 billion in USDT transfers through nearly 90 million contract interactions. The vast majority of USDT holders on Tron are retail users with balances under $1,000, highlighting the network's deep penetration into everyday peer-to-peer and remittance use cases. This immense and consistent utility generates real, sustained demand for the network, forming the most solid pillar of its valuation.
A Growing DeFi and dApp Ecosystem
While stablecoins are its main draw, Tron's Decentralized Finance (DeFi) ecosystem is also substantial. The network holds a Total Value Locked (TVL) of over $8 billion, placing it among the top layer-1 blockchains. Platforms like the lending protocol JustLend and the decentralized exchange SunSwap are key contributors to this activity.
The network has processed over 10.5 billion transactions from more than 313 million user accounts, demonstrating a vibrant and active user base. Although a recent decline in TVL from its peak and slowing DEX volume has been observed, the sheer number of daily active users and transactions suggests a pivot towards non-DeFi dApps and peer-to-peer transfers, reinforcing its utility beyond pure financial speculation.
Tron (TRX) Price Prediction: Technical Analysis and Future Outlook
Given the strong fundamentals, particularly its role as the leading stablecoin platform, what can be expected from the TRX price?
Technical Indicators
As of mid-2025, TRX has shown resilience. Technical analysis reveals a generally neutral to bullish sentiment. The price has been consolidating in a horizontal channel, with key resistance and support levels being closely watched. Bullish signals, such as a "golden cross" and a bullish MACD crossover, suggest potential for upward momentum. A key indicator of its potential is its market-cap-to-TVL ratio, which, at 0.26, suggests the coin may be significantly undervalued compared to the value of the assets secured on its network.
Price Forecasts for 2025 and Beyond
Price forecasts for the end of 2025 vary but are generally optimistic, contingent on broader market conditions.
• Conservative Outlook: A conservative forecast places the potential price of TRX in a range between $0.18 and $0.35 for 2025. A move toward the upper end of this range would depend on a sustained crypto bull market and continued growth in Tron's user base.
• Bullish Scenario: An optimistic forecast suggests that if a full-blown "altseason" takes hold, TRX could surpass its previous highs and target levels between $0.45 and $0.70. Some long-term models even project a path toward $1.00 or higher by 2030, assuming Tron maintains its competitive edge and expands its use cases.
• Bearish Scenario: Risks remain. A regulatory crackdown on stablecoins, particularly Tether, could disproportionately impact Tron. Furthermore, a recent $2 billion drop in its DeFi TVL, despite user growth, suggests a potential weakness in its financial ecosystem that warrants monitoring. In a bearish turn, TRX could fall back to support levels around $0.21 or lower.
The "100x Gem" Fallacy
The headlines promoting Tron's Nasdaq deal were often accompanied by mentions of speculative new tokens like "BTC Bull Token," promising astronomical 100x returns. It is crucial for investors to recognize this as a common marketing tactic that leeches onto legitimate news to promote highly speculative and often worthless assets. The future success of Tron will not be found in chasing such gambles, but in the sustained growth of its core network. The real "alpha" is in understanding the fundamental utility that drives billions of dollars in transactions daily, not in lottery-ticket tokens.
Conclusion: A Bullish Continuation Built on Reality, Not Rumor
The story of Tron's Nasdaq listing is a potent reminder of the crypto market's susceptibility to hype. While the reverse merger with SRM Entertainment is a significant strategic maneuver that provides Justin Sun's ecosystem with a public-facing entity and a war chest, it is not the magic bullet that guarantees a higher TRX price.
The true bullish case for Tron is more mundane but far more powerful. It is the network's unparalleled dominance as the world's preferred highway for stablecoin transactions. This utility provides a constant, powerful demand for the network's resources. As long as Tron remains the fastest, cheapest, and most accessible platform for billions of dollars in daily USDT transfers, its intrinsic value will continue to grow.
The Nasdaq deal is a catalyst, but the engine is the ecosystem. Investors looking for a bullish continuation should focus on the steady hum of that engine—the growth in active wallets, transaction counts, and stablecoin volume—rather than the fleeting roar of market rumors. Based on these fundamentals, a steady, upward trajectory for TRX seems not only possible but probable, with the potential to retest and surpass previous highs as the digital asset market matures.
TRX Analysis - What Shall we Expect !!!We have a descending wedge, which may suggest a potential price drop. If the price breaks below the wedge, it could fall to the PRZ zone and then potentially rise.
Volume is decreasing, indicating a possible imminent breakout, which could go either way.
Best regards CobraVanguard.💚

#TRX Ready for a Recovery or Another Fall Ahead? Key LevelsYello Paradisers! Are you watching the #Tron's recent moves in the market? Let's look at the latest setup of #TRXUSDT to see what could be the next move:
💎After forming a textbook Ascending Channel over the past few months, #TRX just got rejected hard from the upper boundary near the $0.29–$0.30 zone. That rejection didn’t just happen anywhere—it came right at the major resistance zone, which has acted as a key reversal point since early May. This kind of rejection, especially after multiple touchpoints, isn't just noise—it's a sign of momentum exhaustion at the top.
💎From an Elliott Wave perspective, it’s very likely that the first major impulse wave (Wave 1) has just been completed with this recent peak, and what comes next could be the start of Wave 2—a corrective phase that typically retraces deep and fast before the market resumes its larger trend. That means any weakness below the channel support could mark the beginning of a more prolonged decline, trapping breakout buyers and squeezing late longs out of their positions.
💎Price is now hovering dangerously close to the lower boundary of the channel, trading at $0.274 at the time of writing. This is where things start to get interesting. A decisive breakdown from this ascending support would not only confirm a bearish structural shift but would also trigger a cascade effect—invalidating the bullish channel and opening the door for a larger move to the downside.
💎If that breakdown plays out, the first meaningful support sits at the $0.2433 level. But that’s just the beginning. The next major demand lies down around $0.2259—a level loaded with historical volume and likely to attract strong buying interest. Until then, any small bounce is just noise in what could become a significant trend reversal.
Trade smart, Paradisers. This setup will reward only the disciplined.
MyCryptoParadise
iFeel the success🌴

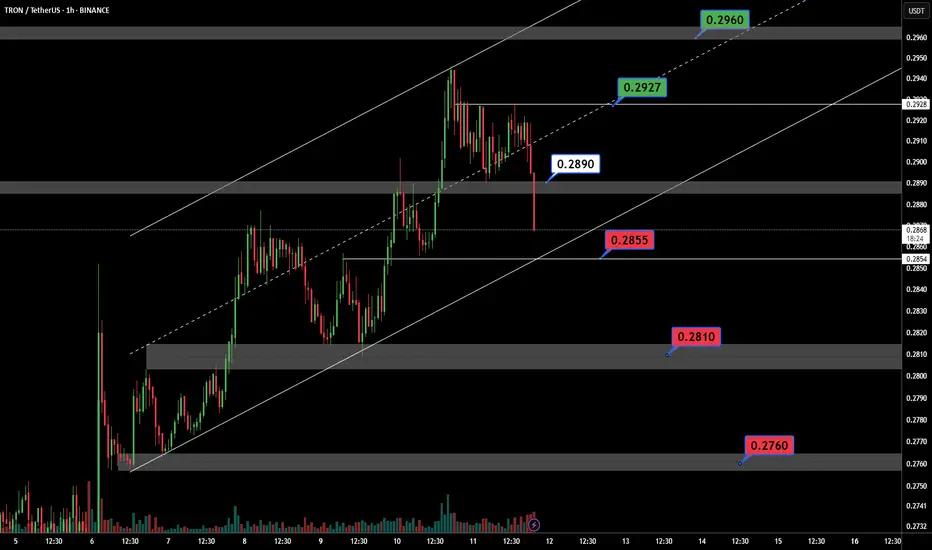
TRXUSDT In the 1-hour timeframe BINANCE:TRXUSDT , it shows an overall upward trend that has recently experienced a price drop near the 0.2855 level but remains within the main upward channel. If the price stays above 0.2890, there is a likelihood of the upward trend continuing toward 0.2960.
Key Support and Resistance Levels:
Support: 0.2760, 0.2810, 0.2855
Resistance: 0.2890, 0.2927, 0.2960
⚠️Contorl Risk management for trades.
Public trade #15 - #TRX price analysis ( Tron )Earlier we wrote that if you want a stable crypto deposit growth, then invest in CRYPTOCAP:TRX
And although the fate of the project, roughly speaking, depends on one person, this person loves his creation!)
📊 Instead of a thousand words, just compare what happened to the alts in 2020 or 2022 and how stable the course and price vector of OKX:TRXUSDT was.
So, if you don't have #Tron in your investment portfolio yet, you should probably buy it at around $0.23. And buckets for “what if” in the range of $0.165-0.18
💰 Justin Sun - Just do it - #TRX to $1.7 !)
_____________________
Did you like our analysis? Leave a comment, like, and follow to get more

TRXUSDT at the Crossroads: Breakout or Stall?TRX is currently in the multi-leg Wave 4 consolidation, a classic corrective phase before the anticipated final Wave 5 impulsive.
This consolidation phase is healthy within the larger trend, allowing for overbought to fade before the next move higher.
A clear breakout above the $0.28–$0.30 range would affirm the Elliott Wave forecast, targeting $0.30 → $0.31 → $0.33. A confirmed close above $0.30 would unequivocally solidify the Wave 5 scenario, paving the way for these upside objectives.
The 81.77 monthly RSI suggests an overbought market, supporting the anticipation of continuous consolidation within Wave 4, potentially retracing back to the $0.25–$0.27 support zone before resuming higher.
Long-term trend indicators are firmly bullish, with the Monthly EMA (20) at $0.1911 and SMA (20) at $0.1769, both considerably below current price action, confirming unbroken upward momentum within the greater timeframes.
So while short-term price action suggests consolidation, technical stance favors continuation to the higher side, and a breakout above $0.30 would signal Wave 5's beginning and continued momentum towards $0.33.

The key is whether it can find support near 0.2705 and rise
Hello, traders.
If you "Follow", you can always get new information quickly.
Have a nice day today.
-------------------------------------
(TRXUSDT 1D chart)
The key is whether it can find support near 0.2705 and rise to 0.3183
If it goes down, the support range is expected to be around 0.1712-1967.
If it shows a downtrend, if the HA-Low indicator is generated, you can create a trading strategy depending on whether there is support around that area.
-
(30m chart)
Since the M-Signal indicator on the 1D chart is rising, if it goes down, it is expected that support around 0.2705 will be important.
If it is supported around 0.2734,
1st: 0.2772
2nd: 0.2811
You should respond depending on whether there is support around the 1st and 2nd areas above.
-
Thank you for reading to the end.
I hope you have a successful trade.
--------------------------------------------------
- This is an explanation of the big picture.
(3-year bull market, 1-year bear market pattern)
I will explain more details when the bear market starts.
------------------------------------------------------

TRON TRON (TRX) is a decentralized blockchain platform designed for smart contracts, decentralized applications (DApps), and digital content sharing. It aims to create a fast, scalable, and low-cost ecosystem for users and developers.
Key Features of TRON:
- High Transaction Speed: TRON can process up to 2,000 transactions per second, making it much faster than Bitcoin and Ethereum.
- Low Fees: Transactions on TRON are almost free, making it ideal for payments and transfers.
- Smart Contracts & DApps: Developers can build decentralized applications using TRON’s TRC-20 and TRC-10 token standards.
- TRC-20 USDT: TRON hosts a large portion of Tether (USDT) transactions, offering fast and cheap stablecoin transfers.
- Decentralized Finance (DeFi): TRON supports various DeFi projects, including JustLend DAO and SunSwap.
TRON was founded by Justin Sun in 2017 and has grown into one of the largest blockchain ecosystems

TRX/USDT Trade Setup & Why This Fibonacci Level Matters🚨 TRX/USDT Trade Breakdown 🔍💹
Taking a close look at TRX/USDT (Tron) — the chart is showing a strong, sustained bullish trend on the 4H timeframe 📈🔥.
At the moment, I’m waiting for a pullback into equilibrium ⚖️. If we apply a Fibonacci retracement from the current swing low to the recent high, the 50% level stands out as a key area of interest for a potential entry 🎯.
🧠 This zone offers a high-probability area to look for trend continuation, provided price respects it and holds structure. My Fibonacci tool also outlines projected targets, and I walk you through everything in the video 📽️🗺️.
📌 This is NOT financial advice — just my personal analysis and approach. Always do your own research and manage your risk accordingly. ⚠️
👇 Let me know your thoughts in the comments and don’t forget to like & subscribe for more setups!
TRX/USDT Trade Setup & Why This Fibonacci Level Matters

TRX/USDT Potential UpsidesHey Traders, in today's trading session we are monitoring TRX/USDT for a buying opportunity around 0.2680 zone, TRX/USDT is trading in an uptrend and currently is in a correction phase in which it is approaching the trend at 0.2680 support and resistance area.
Trade safe, Joe.

TronTrx usdt Daily analysis
Time frame hourly
Short time Target 0.278 $
Risk rewards ratio >3.5 👈👌
This short time analysis is in the big Daily analysis that you can see in my forecasts before

TRXUSDTTRX Price Analysis – Key Levels to Watch
🔍 Current Price Action:
TRX is currently trading within a tight range, with key resistance at 0.2431 and support at 0.2275. The recent close near 0.2418 indicates a strong battle near the upper resistance zone. A confirmed breakout above 0.2431 could pave the way for bullish continuation. However, failure to break through may trigger a pullback toward 0.2340 or even retest the 0.2275 support level.
📉 Trend Outlook & Next Moves:
A breakout above resistance may drive TRX toward higher price targets with strong bullish momentum.
Conversely, a breakdown below support could indicate a deeper correction ahead.
👉 Keep an eye on price reactions at these critical levels for confirmation of the next trend direction.

Tron Built a Fresh Down Trend!!!Hey Traders, in today's trading session we are monitoring TRX/USDT for a selling opportunity around 0.2530 zone, Tron is trading in a down trend and currently is in a correction phase in which iti s approaching the trend at 0.2530 support and resistance area.
Trade safe, Joe.
