Weekly Double Bottom With Class C Bullish DivergenceWe have Class C Hidden Bullish Divergence on the RSI and Class C Bullish Divergence on the MACD along with a Weekly Bullish Crossing. We also have a Bullish Shark on the weekly that could put us on the path to rallying to the PCZ of a Bearish Shark at the 0.886-1.13
We also have a Bullish Gartley that can be seen on the Daily timeframe as shown on this chart from awhile ago that we may be making a type 2 confirmation on:
TRON

TRON - Update ✅Let's see how TRX is behaving.
This is a 1D chart. (Mid Term)
TRX is now the first trend on Twitter.
It looks like it has safely passed the support/resistance level on the chart and, after confirmation, will turn it into a local support level. This can start a new uptrend for TRON.
Support levels: 0.06342
Resistance Area: 0.08169
Bollinger Bands can work as support and resistance too. Here is an example:
The market is showing BUY volumes for TRX.
Two resistance levels push down on value, and one support level holds the price high and shows strength. The higher band can work as resistance.
The Middle Bollinger Band can push down the value, and the Lower band pushes the price up.
If the price crosses the local resistance and stays above it for confirmation, we can open our long positions, aim for the next resistance, and use it as a TP point.
The RSI shows that TRX is above the 50 levels, the center.
If you want to know how the RSI indicator works, take a look at this Educational Idea. It'll help you have better readings:
Current Market Price: $0.07171
Let me know your ideas.
Good luck.

TRX longTron is bouncing off the support level. Continuation of bullish movement to resistance level at 0,722 $ is likely to happen.

Wink, the Best OracleWink is one of the most valuable cryptocurrencies in the market that has extreme potential to peak a new ATH. Static and dynamic resistances are shown in the diagram. The Wink market is expected to reach at least $ 3 billion. If Bitcoin touches a new target as ATH, then $ 0.01 Wink is not far off at the end of this year.
The main Fibonacci and Expansion indicators both pursue the same goal for Wink, which is $ 0.1.

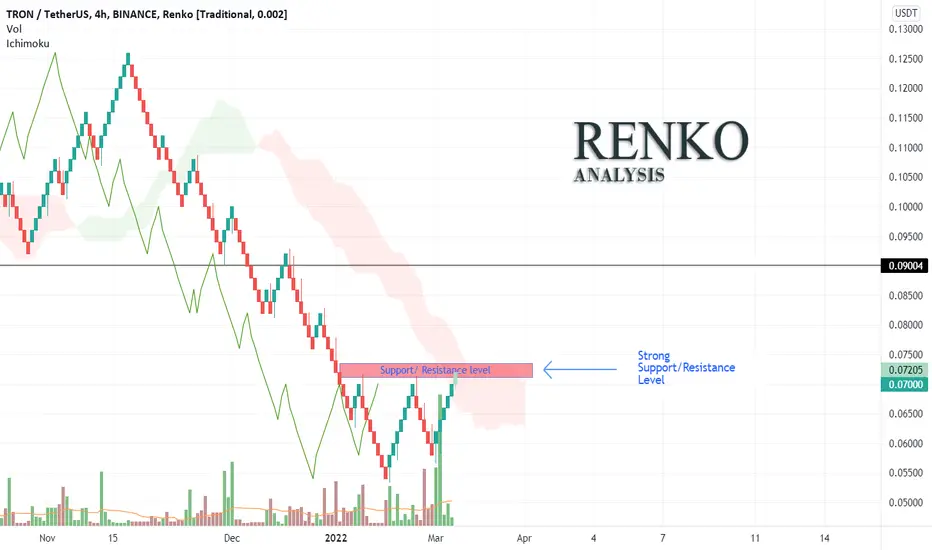
Tron below the resistance levelTron is below a strong resistance level that has been repeatedly respected. Tron, on the other hand, has entered the Kumo cloud. To decide on a position, one has to wait for the reaction to this level of resistance as well as its exit from the Kumo cloud.
TRX adam & eve pattern#TRX/USDT
$TRX shaped adam and eve pattern and try to break out from resistance of this pattern.
🐮 close above this resistance can head up price as high as the height of eve.

TRON (TRX) OUT OF LONG TERM TREND BOXHello trading friends,
This is an update for TRX - Tron is out of the trend zone - this could be interesting for the TA trend, and with the possible new increase that can come on TRX. we will follow this coin coming time for a possible breakout.
With long-term box, means that Trx did stay for the long term into the stable trend - and now it seems this could be a new trend for a new move.
Have good time
# this is not a trading call - Trade only depending on your setups.

KLV - THREE DIMENSIONAL PROJECTION @ DAILYVery interesting projection for the near future on KLV.
This is IMHO a very good buy and a very solid project!

TRX - TRONIX - TRON network on the move higherTronix, also known as TRX, is the native cryptocurrency of Tron: a blockchain-based platform with two main functions. First, it serves as a global online content sharing platform, and secondly, it allows developers to create their own autonomous applications that operate without the need for intermediaries (* information from CoinDesk).
This asset hit .1805 back in April 2021 and looks to be headed to much higher ground.
Having broken north of the wedge pattern holding it down for several weeks, the price of TRX has climbed steadily.
Resistance at .0714 looks a likely target.
2 days ago the 50 EMA crossed the 200 EMA which is known as a Golden Cross and this is a very BULLISH sign.
With plenty of support below the currenct price with the 50 EMA and 200 EMA, this asset looks a banker LONG trade.

TRON: GEARING UP FOR HIGHER RALLY.Welcome members to this update on TRX/USDT.
If you are viewing my post for the first time then do not forget to like and follow. I share updates on the crypto market including margin trading, futures, spot, and scalping. All ideas are my biased opinion and I invest in my own risk. I don't force anyone to buy or sell, I simply share my ideas absolutely for free and it is your sole decision whether to trade on it or use it to understand the market.
Let's get back to the chart.
TRX broke out and currently retesting. It is holding good support here and if the market goes bullish then 10% to 15% rally from the current price level.
The entry-level will be between $0.06 to $0.061.
Stop Loss: $0.058
Targets:
$0.0632
$0.0647
$0.0662
$0.0672
Note: This is not financial advice. This trade setup is based on my T.A and I am risking my own money on this trade. I am reliable for my own losses and profits. So, trade as per your preference.
Let me know what you think about this idea. Do like and share.
I will cover more on this in the coming days until then stay safe and trade well.
Thank you.


TRON Analysis + 2023 CrashWe can see how it is close to the "ground" of Tron. Due to the great crisis that is coming for 2023, I cannot deduce if the crypto market is going to benefit from this, but what I am sure is that all the markets are going to fall.
It is impossible to predict a crash correctly and whether it will affect the "crypto market".
For Tron I see a bullish and neutral trend (staying on the ground correcting for a while)

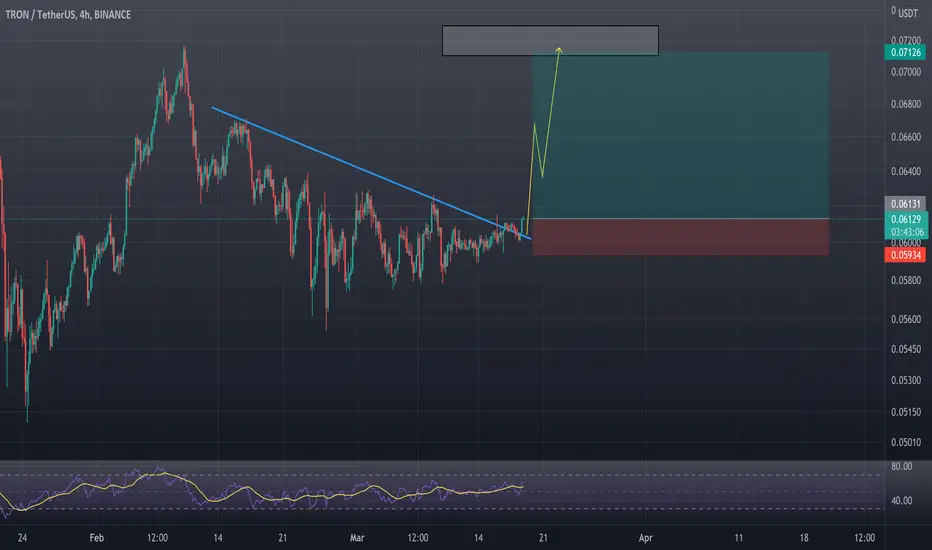
TRX, key level BREAKOUT! Is it a chance to open LONG?Tron(TRX)is now squeezing to a key level after testing the trend line several times.
Each test of the trend line was followed by an increase in volumes. This means that the bulls are buying and waiting for a break up.
A break-up is very possible now, because we are approaching the level in small candles, which is a bullish signal.
After the FALSE breakout it will be possible to open long positions with the minimum target of $0.66-0.68.
Friends, push the like button, write a comment, and share with your mates - that would be the best THANK YOU.
P.S. I personally will open entry if the price will show it according to my strategy.
Always make your analysis before a trade.

TRX, where will the price go? TWO scenarios!Tron (TRX) are consolidating in the area of the biggest horizontal volumes and a large triangle. How to know where the price will go?/
It is necessary to pay attention to exactly where the price will start to squeeze - that's the key!
If we see a squeeze to the upper trend line and Bitcoin also shows strength, we will continue strong growth.
If we see a squeeze to the lower trend line, most likely, the price will go down.
We need to be very careful now, as the TRX are in consolidation and a breakout in any direction, can trigger a strong rise/fall.
Friends, push the like button, write a comment, and share with your mates - that would be the best THANK YOU.
P.S. I personally will open entry if the price will show it according to my strategy.
Always make your analysis before a trade.

TRX, i like this coin. Pump is going to happen TRX, i like this coin. Pump is going to happen
Trade ideas

TRON MOST UNDERVALUED COIN TIME HAS COME FOR MEGA PUMPBitcoin going bullish on April will pump tron to all time high.
As from my prediction and having patience. I am successful increase my massive portfolio to tenfold within a year.
Almost every coin is on bottom... it's wise to choose TRON cz it's a utility coin. TRC is used by almost all small to medium traders for transferring the asset.
It's obvious in recent time tron is worst performers. 6 months back I literally bet on UNISWAP despite the technical analysis is not in favour cause this coin was fundamentally strong.
If today I have to bet on something despite the technical. I will bet on TRON, as it's on trading zone. 0.060 Dollars.
Technical analysis till now is neutral for TRC. IT'S IN Huge symmetrical triangle, which is likely to break upward and giving no time for retail investors to buy.
When it's come to fundamental... technical analysis rarely predict it.
Last time even knowing Shib has no value, I bettted on it.
Buy The Rumor Sell The News.
Already Enjoyed The Waves...Now It's Train(Tron Time)

TRON Grand Hackathon 2022 WINNERSTRON Grand Hackathon 2022 announced the winners of its Season 1 event. The panel of judges, which consists of eminent industry leaders, said they were pleased with the projects they received this season. They already await Season 2, where registration will begin on May 16, 2022.
Running from March 8 to March 11, Season 1 amassed over 120 submissions, all vying for the aggregate prize money of $500M spread between four tracks, Web 3.0, NFT, GameFi, and DeFi.
Season 1 Winners
In the GameFi Track, the winner is TronNinja Arcade by the TronNinja Team. TronNinja is an NFT GameFi project on the TRON blockchain where users will be able to use their NFTs as characters in-game while earning in-game tokens. Their goal is to bring back the social aspect that arcades had.
In the Web3 track, the winner is dCloud by Cctechmx. Their mission is to create an Open Source Web3 Cloud storage mobile app enabling its own ecosystem to enjoy a self-sustainable and shared economy.

TRXUSDTHello Crypto Lovers,
Mars Signals team wishes you high profits.
We are in the daily time frame. The price has hit our support line two times and was supported. Now it is moving between the support line and the first resistance. We expect the price to come down to the support line and move back up to the resistance zone. But if the price does not receive support, it will move further down. If any of the resistances are broken, the price will move up higher.
Warning: This is just a suggestion and we do not guarantee profits. We advise you to analyze the chart before opening any positions.
Wish you luck

Tron Is Trying To Turn Bullish (+ 70% Target)Tron (TRXBTC) is printing some weird price action while it tries to break above EMA50.
Above EMA50 (0.00000155) it can easily grow.
You can see the targets and additional information on the chart.
Namaste.

Tron 0.18$ Tron can be 0.18$ again
You can take a Buy limit on 0.05$
Tron Technical analysis basically on elliott waves Principles and Priceaction Strategy
Wait and Watch

TRX/USDT: AT THE RESISTANCE.Welcome folks to my new update on TRX/USDT.
If you are viewing my post for the first time then do hit the like button and graciously follow as well. I share updates on the crypto market including margin trading, futures, spot, and scalping. All ideas are my biased opinion and I invest in my own risk. I don't force anyone to buy or sell, I simply share my ideas absolutely for free and it is your sole decision whether to trade on it or use it to understand the market.
TRX is trying hard to break above the resistance level. If TRX manages to break this level then I am expecting an 8%-10% rally. A rejection on the other hand will drop the price back to $0.058 where we can have a good buying zone keeping in mind the invalidation point.
In both scenarios, I am gonna accumulate TRX. Let's see where the market leads.
What do you think about TRX? Let me know in the comments.
Do like, and follow for more updates.
Thank you.

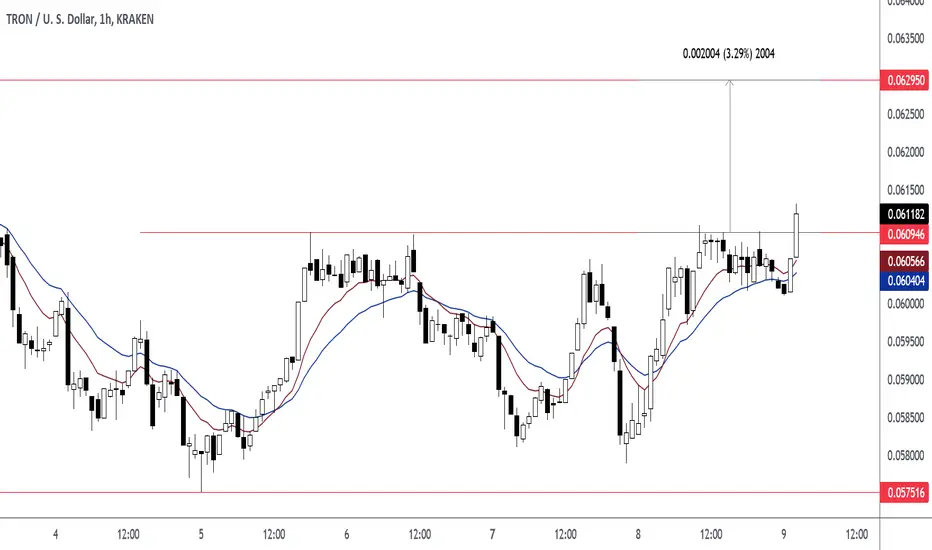
Take Profit: 0.062950 (TRXUSD)Price closed above 0.060946. A close above 0.060946 exposed 0.062950 resistance level as the take profit target level. Entry at 0.061182. Take Profit at 0.062950.