Tron Is Trying To Turn Bullish (+ 70% Target)Tron (TRXBTC) is printing some weird price action while it tries to break above EMA50.
Above EMA50 (0.00000155) it can easily grow.
You can see the targets and additional information on the chart.
Namaste.
TRON

Tron 0.18$ Tron can be 0.18$ again
You can take a Buy limit on 0.05$
Tron Technical analysis basically on elliott waves Principles and Priceaction Strategy
Wait and Watch

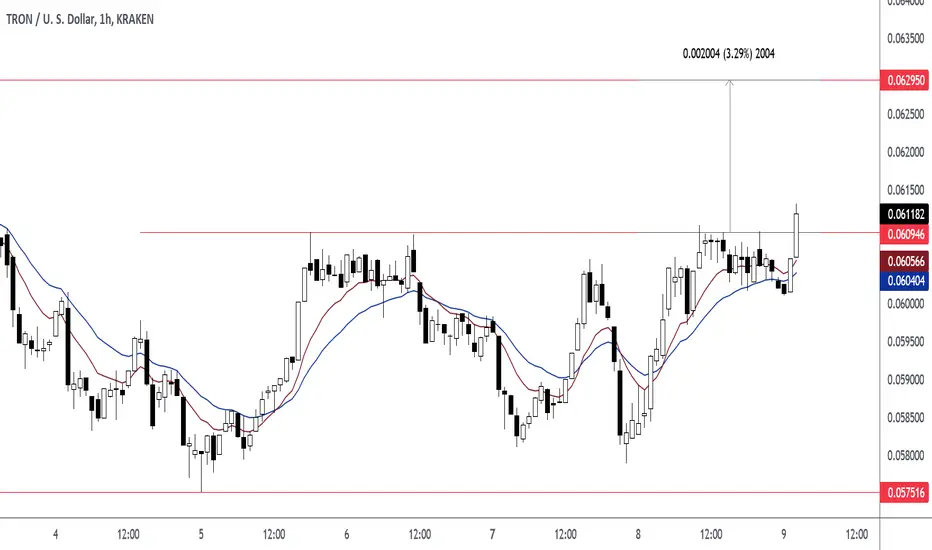
Take Profit: 0.062950 (TRXUSD)Price closed above 0.060946. A close above 0.060946 exposed 0.062950 resistance level as the take profit target level. Entry at 0.061182. Take Profit at 0.062950.
Trading opportunity in TRXUSDTBased on technical factors there is a short position in :
📊 TRXUSDT Tron
🔴 Short Now 0.06035
🧯 Stop loss 0.06180
🏹 Target 1 0.05940
🏹 Target 2 0.05785
🏹 Target 3 0.05560
💸Capital : 1%
We hope it is profitable for you ❤️
Please support our activity with your likes👍 and comments📝

🔝 TRXUSDT 💥 Do not follow this trade manuallyTRON was founded by Justin Sun in 2017. The TRON Foundation was established in July 2017 in Singapore. The TRON Foundation raised $70 million in 2017 through an initial coin offering shortly before China outlawed the digital tokens. The testnet, Blockchain Explorer, and Web Wallet were all launched by March 2018. TRON Mainnet launched shortly afterward in May 2018, marking the Odyssey 2.0 release as a technical milestone for TRON. In June 2018, TRON switched its protocol from an ERC-20 token on top of Ethereum to an independent peer-to-peer network. On 25 July 2018, the TRON Foundation announced it had finished the acquisition of BitTorrent, a peer-to-peer file sharing service. With this, TRON declared its independence with the creation of the Genesis block, along with July 2018 acquisition of BitTorrent. Upon this acquisition, in August 2018, BitTorrent Founder Bram Cohen also disclosed that he was leaving the company to found Chia, an alternative to bitcoin created to be a less energy-intensive cryptocurrency.
By January 2019, TRON had a total market cap of about $1.6 billion. Despite this market performance, some authors viewed TRON as a typical case of the complex and disordered nature of cryptocurrencies. In February 2019, after being acquired by Tron Foundation, BitTorrent started its own token sale based on the TRON network.

TRON longTRON bounced off the ascending trendline. Asset broke through the descending trendline. Bullish movement to resistance level at 0.669 is possible.

TRXBTCHello Crypto Lovers,
Mars Signals team wishes you high profits.
We are in the daily time frame. The price is fluctuating below the first resistance line which has rejected the price several times. We expect this line to be broken and if so, it will move up to the first resistance zone. After hitting the second resistance, it can form an inverse H&S pattern. If the first resistance is not broken, it will move down to the first support line.
Warning: This is just a suggestion and we do not guarantee profits. We advise you to analyze the chart before opening any positions.
Wish you luck

🔴TRX is retaining the support floor still ▶️ TRON
⏰ Time Frame : 1D
✴️ If the correction is finish, this range can be considered for drawing fibo ( 0.12933 - 0.05101 )
Resistances has shown by Fibonacci numbers.
🔴 and has shown support zone . It is important to maintain this area
❓ What Do you think about Continue of trend?
Please tell me
⚠️ (This isn't a signal for buy or sell)
#️⃣ 2022 / 04 / March
👸 Analyzed by : Parisa_Alipoor

TRON Could Test 5.5 cents before going to $10+ next yearWave-B has formed into a double combination which are normally retraced 80%. Wave-E from beginning to end should also be related to wave-C by 61.8% in price, and C+D in time. This leaves us with a target of 5.5 cents for TRX, which could happen around February or March.
Following this correction we should see an explosive rally which will take TRX well above all time highs because this will be the actual end of the 4 year bear market pattern. It could go higher than $10 next year and then even higher in the following year.
Positive regulations from the US will be a major driver of crypto prices next year as new institutional money starts entering because of regulatory clarity. High inflation will also be a major driver of higher prices in later 2022.

TRON - Medium TermOn a daily timeframe, Tron is in a position that is suitable for medium-term arrivals, with 0.068 and 0.075 targets. Be sure to observe your input volume so that if we are in a critical situation, we can transfer the average purchase to lower prices by increasing the input volume.

Trading opportunity in TRXUSDTBased on technical factors there is a long position in :
📊 TRXUSDT
🔵 Long Now 0.06000
🧯 Stop loss 0.05700
🏹 Target 1 0.06230
🏹 Target 2 0.06660
🏹 Target 3 0.07140
💸Capital : 1%
We hope it is profitable for you ❤️
Please support our activity with your likes 👍 and comments 📝

#TRX is going to a good position for #SHORT in15M
TRX/USDT is GET the good setup for SHORT POSITION by BREAKING DOWN the trend line in 15M Time F
You Can get This Position With 10X LEV
GOOD LUCK & Don't Forget to set the SL & TP

TRX, TRON, local long idea. Trend line break up patternTRX, TRON, local long idea. Trend line break up pattern
Coin follow BTC

TRXUSDT - Falling Wedge PatternTRXUSDT (4h Chart) Technical analysis
TRXUSDT (4h Chart) Currently trading at $0.0628
Buy level: Above $0.0626
Stop loss: Below $0.059
Target 1: $0.0644
Target 2: $0.0668
Target 3: $0.070
Target 4: $0.074
Max Leverage 3x
Always keep Stop loss
Follow Our Tradingview Account for More Technical Analysis Updates, | Like, Share and Comment Your thoughts

BTC at Resistance, Potential Pull Back Incoming (Elliott Wave)BTC has formed into a clear zigzag pattern and it appears we're at the end of wave-c. Wave-b is an irregular failure flat which means wave-c had to be at minimum larger than wave-a in price. This minimum target has been reached and we've also reached the time target for wave-c (0.5(a+b)=c). Short-term momentum, harmonics and fractals are also indicating a top has formed.
Difficult to say what comes next other than that this looks like at the very least we'll get an x-wave and go under 40k. Worst case scenario for bulls would be a full retracement of this bounce but that seems unlikely. I am leaning more towards a higher low before we really start to climb back towards 50k+

TRXUSDT TECHNICAL ANALYSISTRON lost over 65% last year April till now and $TRX hasn't reached out last ATH yet. The candles are staying on Support level and whole candles are in triangle. If recent candle open-close completely above to support line, it might be an opportunity for buy. One of the coming candle break out down trend-line and later candle open-close completely above down trend-line, it may another opportunity to buy as well. We haven't got buy signal from @EngineeringRobo daily time frame yet but we have got multiples buy signals in 3H time frame. MA7&25 changed direction on negative way but when we look at the MA20&50, it changed direction on positive way as well. We haven't got any buy signals on MA20 or MA50 yet. Also, if candles stay above to up trend line, it may gain more. But do not do any trade while candles are in triangle. Wait for clear out then move forward. Let's follow our chart together.
"NFA"

TRXUSDT 3D TA : Next MOVEIn the 3-day timeframe, it is on the dynamic resistance of its downtrend line. If the trend line breaks upwards, an uptrend will be formed, but according to the current market trend, the possibility of falling to the support range and then the trend line support is not far from expectation.
Its not Buy or Sell SIGNAL
DYOR
@AtonicShark

USDT.D Check the chartHello, by examining the chart, we come to three different scenarios.
1- The first scenario is to complete the price action and break the pattern inside the image and withdraw the money to the fixed assets of the dollar.
2- The second scenario is that with the withdrawal of bitcoin from the exchange and looting by market whales, more volume of liquidity has entered the market to buy more bits and other cryptocurrencies.
3- Suffering within the same limits for all currency codes.
4- The phase of intense fear and monopoly of most whales in the market for cryptocurrencies and Dominance Tetra reaches 8 to 10, which becomes very interesting.

TRON probably will breakdown the support areaTRON probably will break down the support area. as we can see on the chart, TSI broke down the zero line.
In the historical chart of Thron, breakout the zero level in TSI oscillator was associated with a breakout of support/resistance in the chart

TRXUSDT LongHey traders, we are monitoring TRON for a buying opportunity arounnd 0.064 zone, once we will receive any bullish confirmation the trade will be executed.
don't forget to supports with like and comments for more contents!
Trade safe, Joe.

TORNUSDT SETUPTORNUSDT price emerge as a strong amongst other after posting a breakout and now bulls are showing some positive momentum, So we are expecting that they will try to retain their dominance.

TRON (TRX) - February 15Hello?
Traders, welcome.
If you "follow", you can always get new information quickly.
Please also click "Like".
Have a nice day.
-------------------------------------
(TRXUSD 1W Chart)
(Full: )
Above 0.0441 3840 point: Expected to create a new wave.
It must rise above the 0.0750 0028 point to turn into an uptrend.
However, in order to continue the uptrend, it must break out of the downtrend line.
If it declines from the 0.0441 3840 point, it is likely to enter the mid- to long-term investment zone, so you need to trade cautiously.
As the CCI line failed to rise above the EMA line in the CCI-RC indicator, the TRX entered a sideways section.
On the 1W chart, when the CCI line rises above the EMA line and above the +100 point, it is most likely showing a large uptrend.
(1D chart)
First resistance section: around 0.0864 4692
Second resistance section: 0.1124 3825 - 0.1254 3392
Support period: 0.0474 5992 - 0.0604 5559
-------------------------------------
(TRXBTC 1W Chart)
0.0000 0259 - 0.0000 0318 or higher: Expected to create a new wave.
It must move above the 0.0000 0194 point to turn into an uptrend.
------------------------------------------
We recommend that you trade with your average unit price.
This is because, if the price is below your average unit price, whether the price trend is in an upward trend or a downward trend, there is a high possibility that you will not be able to get a big profit due to the psychological burden.
The center of all trading starts with the average unit price at which you start trading.
If you ignore this, you may be trading in the wrong direction.
Therefore, it is important to find a way to lower the average unit price and adjust the proportion of the investment, ultimately allowing the funds corresponding to the profits to be able to regenerate themselves.
------------------------------------------------------------ -----------------------------------------------------
** All indicators are lagging indicators.
Therefore, it is important to be aware that the indicator moves accordingly with the movement of price and volume.
However, for convenience, we are talking in reverse for the interpretation of the indicator.
** The MRHAB-O and MRHAB-B indicators used in the chart are indicators of our channel that have not been released yet.
(Since it was not disclosed, you can use this chart without any restrictions by sharing this chart and copying and pasting the indicators.)
** The wRSI_SR indicator is an indicator created by adding settings and options to the existing Stochastic RSI indicator.
Therefore, the interpretation is the same as the traditional Stochastic RSI indicator. (K, D line -> R, S line)
** The OBV indicator was re-created by applying a formula to the DepthHouse Trading indicator, an indicator disclosed by oh92. (Thanks for this.)
** Support or resistance is based on the closing price of the 1D chart.
** All descriptions are for reference only and do not guarantee a profit or loss in investment.
(Short-term Stop Loss can be said to be a point where profit and loss can be preserved or additional entry can be made through split trading. It is a short-term investment perspective.)
---------------------------------

TRX/BTC 1W. Potential Inversed head and shoulders.TRX/BTC 1W consolidating in small range. Price can't go lower 152 satoshi level.
Potential falling wedge is forming inside the right shoulder of potential IH&S(Inversed head and shoulders).
Potential zones, where the price can fall, or where it can come, I've showed on chart.
