TRX to the moon?🔥🌙hi guys hope you doing great ,as you can see on the chart trxusdt has broken upward the long term trendline and now its going to make a pullback and start for an uptrend.
TRON


Cryptocurrencies, Bitcoin, Daily Chart, Trading Signal, BTC,TRXOn special request from TRX holders. Head and shoulders on the 4HR timeframe not looking good. Best to exit and repurchase at lower price targets. TRX likely to bottom out at $.05

TRON TRXUSDTTRX, as you can see, has been in an uptrend channel, basically the uptrend channels are breaking from the floor. Which is clear here.
TRX can pullback on the break line marked on the chart and correct again.
That is why we have to wait. Because it may return to its uptrend channel. Then this exit from the channel is not considered a failure and there they will say we had a fake breakout.
So we are waiting to see what he does with the break line and pullback! If approved, Goals 1 and 2 could be our target destinations.
First the load signal, then the confirmation signal, then the trade.
Be profitable.

TRX/USD - global. The point is that price has 2 phases (aka Wyckoff theory) : accumulation and distribution.
Previous cycle of phases the prica has passed. So current phase is accumulation.
Using 200MA we can see some similiarities with last phase.
Also Fib circles used for searching possible ressistence.
I am long for Tron.
vs BTC :

WinkLink must give some reward after botheringWink disappointed me after it lost $0.0005 support but still has a chance to grow up.

TRON & AlTCOINS IN MAX PAIN EVENTHello traders!
If we will break recent low on May 19th - we are heading much lower to test important monthly/weekly supports :)
That is that :) Accumulating more alts if we get to these targets!
Stay focused! This is not financial advice

🔥 TRX Still In A Bullish Channel: Two PossibilitiesSince the major reversal of crypto late July, TRX has seen a strong uptrend. As of early this morning, TRX has bounced off the lower trend line of the channel. This might be a temporary bounce.
The overall view on the market is quite bearish. Add the turmoil in the stock market to this, and we've got a potentially strong bearish on our hands.
In case of a bearish break out of the channel, I'm targeting $0.775, which is placed at the last significant low. In a bullish scenario, I'm looking at the $0.105 resistance. In case the stock market shrugs this move off, we might see a rebound fairly soon.
Happy trading!

TRON - Overlook ✅TRON has two main supports on the way down: one local for short term and one key support for long term which is the area we've consolidated on for a while.
I said on the way down because TRX also is going through corrections, just like the whole market, and we're not sure when it'll stop since there are strong sell volumes on the market.
Not a good time for opening long positions at all, not safe at all.
Use this chart as your trade setup for now.
Current Market Price: $0.09321
Good Luck
Tell me your ideas. Like and Share

trxusdThe TRX currency is used to power programs running on the Tron network. One of the most sought-after uses for this type of tech is to create social platforms that reward users directly for content creation and curation

TRX/USD - Path to $0.20 🚀TRON macro view looks bullish as the trend is clearly up (higher lows).
If we count the waves, we seem to have completed all waves apart from the last fifth wave up. Once that is done, we may have a longer cool-off.
Price appears to be around half-way towards the top on this last wave. It's hard to guess the top, but I'd bet anywhere around $0.20 is a good place to secure profit. Some possible resistance levels are on the chart.
I don't exclude another re-test of support which would present a good buy opportunity before the last pump up. Then we need to re-assess the chart.
On weekly timeframe, indicators are bullish but I don't like the lacking volume. Hence, why on daily it does look like tron wants to re-test our support before we push higher again. So best to buy then if you are interested in longing Tron. If this plays through, you can double your entry, not bad.
Like and follow if you liked this idea!

TRXUSDT BUY/LONGHi guys trxusdt in his channel make good position
and one of the position this one I were share
Hope Good Profits...
Thanks all
Cherchilm

TRONGreat news and start of a different co - operation with BTT
But the chart is basically the need to correct all things depending on the white space of one hour.

TRON at a 13% Discount - Potential Entries Before Next Leg UpA quick post that I thought was worth mentioning. Tron reset the RSI correcting ~13% since last night. When I saw that it was sitting on a confluence of support level from several different trends, I couldn't control myself and bought some more TRX at this 222 sat level. Bitcoin just had a little shakeout to $46750, but maintained it's bull flag. If it can show some strength and have a solid breakout beyond $48,000, I think we can expect a bullish continuation from TRX. The price could really fly if it breaks out against BTC.

TRX will see high prices when it breaks out!Here's a quick look at TRX 2 days chart. As we can see, the price has been going sideways and has printed a big symmetrical triangle. The price will probably revisit previous ATH when it breaks out. Definitely one to keep an eye on.
The best entry would be, when the price breaks above the symmetrical triangle with good amount of volume .
-------------------------------------------
The idea is: Buy the breakout from the symmetrical triangle and take profits at the levels shown in the chart.
Targets:
- Profits can be taken in the resistance zone .
1. 0.14$
2. 0.148$
3. 0.18$
-------------------------------------------
If you like the content, then make sure to comment and like the post :D
Follow me for daily profitable trading setups
BTC dictates the market. If BTC falls, then Alts will fall as well. Trade safe!

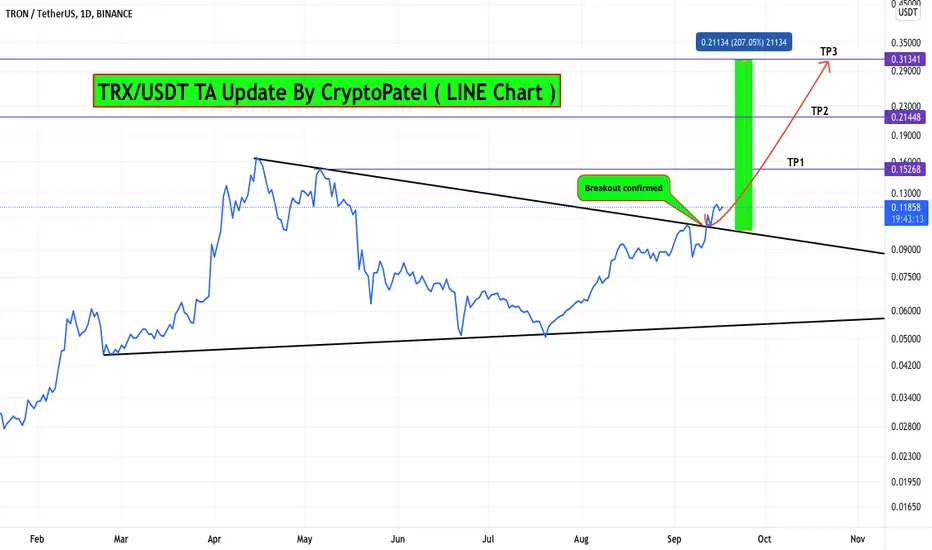
TRON Ready for another 200% move from here..?#TRX/USDT TA Update:-
$TRON currently trading at $0.119
Which is 18% up from our lower entry.
In the LINE chart also breakout and Retest also confirmed.
Now Waiting for Big move from here.
Stop Loss same at :- $0.09
Targets:- $0.152/$0.214/$0.313
If break $0.152 then we can see new All time high.
Support:- $0.1
Resistance:- $0.152
Tron AKA TRX Analysis #TRX Bullish setup //
- Broke DownTrend line
- Above EMA 200 ( long term )
- Retesting previous support
70% of successful trade

₿ TRXUSDT 1D ₿ : 16.Sep.2021 (Update)Still Powerful ... BINANCE:TRXUSDT
⚠️ This Analysis will be updated ...
👤 Arman Shaban : @Ar_M_An_4
📅 16.Sep.2021
⚠️(DYOR)

TRXUSD formed a 1D Golden Cross and aims at $0.30The Fibonacci Channel since the COVID market bottom fits perfectly on Tron. The latest key technical formation is the Golden Cross (MA50 crossing above the MA200) on the 1D chart. Last time we saw this pattern was in June 07/08 2020. That draws inevitable comparisons with that fractal.
See the similarities of then and now:
* The Golden Cross was formed after the price broke above the Lower Highs trend-line
* The Golden Cross was formed after the price broke above the 0.618 Fibonacci retracement level
* Since the bottom, the price has been trading within the 0.5 and 1.0 Fibonacci levels of the Channel (blue Channel)
* The LMACD on both is identical
What happened after the Golden Cross in 2020 was a sustainable 2 month rise within the 0.5 and 1.0 Fibonacci levels of the Channel supported by the 1D MA50 (blue trend-line) and then when the Resistance (previous High) broke, an aggressive rally followed just below the 1.5 Fib extension from the bottom and the 2.0 Fib extension of the Channel. Currently that's a little over $0.30 and that's what we are targeting on TRXUSD.
** Please support this idea with your likes and comments, it is the best way to keep it relevant and support me. **
--------------------------------------------------------------------------------------------------------
!! Donations via TradingView coins also help me a great deal at posting more free trading content and signals here !!
🎉 👍 Shout-out to TradingShot's 💰 top TradingView Coin donor 💰 this week ==> Vergnes
--------------------------------------------------------------------------------------------------------

TRON - Will it manage to overcome, or fall back?TRON on a significant level. WIl it push through? Volume and price action pushed e to open a long. Let's see.

The volcano is offHi guys
As you know, the TRX currency has grown well over the past few days. But now it is in a resistance zone. But the 4-hour trend line is very strong. I think he will see the previous ceiling soon.😉😉❤
It is not a buy or sell offer🤣🤣

Tron TRXUSD - Ascending channel + Elliott Wave- On the chart we can see an incomplete Impulse Elliott Wawe (5th wave).
- Rounding bottom or cup and handle is also printing on the chart.
- Volume is very bullish and also RSI is prepared for another pump!
- Target is 1:1 fib trend-based extension + top of the ascending channel + 5th elliott wave
- For expected duration of the trade, probability, stop loss, profit target, entry price and risk to reward ratio ( RRR ) - please check my signature below ↓
- Huge bullish volume is also one of the positive signs!
- If you want to see more of these ideas, hit "Like" & "Follow"!

Tron TRX Ready to MOON LONG NOW !!??? TRON TRXTaking a look at price action you can see that the most recent pullback was a retest of key support and resistance and on top of that we formed hidden bullish divergence on the daily time frame !!
A short term break and rest of our most recent high which lines up with an area of support is holding strong
In my view holding this level could allow us to run up to the next level of resistance
If we execeed that level expect TRX to ATH 30 cents !!!!!
