TRXUSDT trend continuationTRXUSDT has pulled back following a recent surge. The market recently broke and closed above a flag pattern, with the price retracing about 38.2% of the previous bullish move. It has now reached a resistance zone last tested in 2021. Additionally, the price has pulled back to the previous higher high zone, from which it has already started to bounce. On the weekly timeframe, the market has broken through a large triangle pattern, suggesting a potential continuation of the trend. The target is the resistance zone around 0.1670
Dear traders, if you like this trading idea or you have an oppinion on it, we would love to hear it in the comments :)
TRON

TRX (TRON): Overbought at ResistanceTrade setup : Price remains in an Uptrend. It bounced off of its long-term up trendline and 200-day MA, and resumed its uptrend. We removed it from our HOT list because it's overbought (RSI > 70) near $0.17 resistance, hence we're likely to see some profit taking near-term. We'd wait for a pullback. Nearest Fibonacci Retracement levels (possible support) are $0.16 (23.60%), $.15 (38.20%), and $0.14 (50%). Learn risk management in Lesson 9.
Pattern : Price is Overbought at Resistance . This trading strategy finds assets that are overbought (RSI > 70) and are near a resistance area, which means there's a high probability that price will get rejected and pull back near-term. Overbought conditions are typically reached when RSI hits 70 or more. Learn this trading strategy in Lesson 5.
Trend : Short-term trend is Strong Up, Medium-term trend is Strong Up and Long-term trend is Strong Up.
Momentum is Bullish but inflecting. MACD Line is still above MACD Signal Line but momentum may have peaked since MACD Histogram bars are declining, which suggests that momentum could be nearing a downswing. Price is neither overbought nor oversold currently, based on RSI-14 levels (RSI > 30 and RSI < 70).
Support and Resistance : Nearest Support Zone is $0.14, then $0.128. Nearest Resistance Zone is $0.17, then $0.20.

TRON’s $4 Billion Ambition: Justin Sun’s Bold Bet on Meme CoinsIn a move that could redefine the trajectory of the TRON network, Justin Sun, the founder and CEO of TRON ( BINANCE:TRXUSDT ), has forecasted an ambitious revenue target of $4 billion for the coming year. This projection, if realized, would be a landmark achievement for the blockchain platform, driven by a strategic pivot towards meme coins and adjustments to network fees.
The $4 Billion Revenue Peak
Justin Sun’s bold prediction isn’t just a number plucked out of thin air. The $4 billion target is rooted in a comprehensive strategy that leverages TRON’s strengths while embracing the growing influence of meme coins in the cryptocurrency market. Sun anticipates that $3 billion in revenue is a conservative estimate, with the potential to exceed $4 billion through network optimizations and community-driven initiatives.
Sun has laid out a plan where $1 billion of this revenue will be ‘burned’—a practice that effectively reduces the supply of CRYPTOCAP:TRX , potentially increasing its value. The remaining $2 billion is earmarked for stakers and to cover transaction fees, creating a more attractive ecosystem for users and investors alike.
The Meme Strategy: A New Frontier
Central to Sun’s revenue forecast is TRON’s renewed focus on meme coins—a category of cryptocurrency that has gained significant traction in recent years. Sun believes that the community-driven nature of meme coins aligns well with the decentralized ethos of TRON ( BINANCE:TRXUSDT ), making it a strategic growth area.
The launch of SunPump, a meme token launchpad on the TRON network, is a testament to this strategy. Despite being just 11 days old, SunPump has already generated over $1.1 million in sales, indicating strong market interest and potential for further growth.
Network Adjustments: Lower Fees, Higher Capacity
To support this ambitious growth, Sun has proposed lowering transaction fees and raising the energy limit on the TRON network. These adjustments are expected to increase daily transactions to over 20 million within three months, significantly boosting TRON’s market share.
By increasing the network’s energy capacity, more TRX tokens will be staked, enabling free transfers and enhancing the network’s overall profitability. These measures are designed to make TRON a more attractive platform for developers and users, fostering long-term growth.
TRON’s Integration with Dex Screener
In addition to its meme coin strategy, TRON ( BINANCE:TRXUSDT ) has recently achieved a significant milestone with its integration into Dex Screener, a leading decentralized exchange tracking service. This listing is expected to enhance TRON’s visibility in the decentralized finance (DeFi) space, attracting more users and liquidity to the network.
The integration with Dex Screener is seen as a critical step in TRON’s broader strategy to expand its ecosystem and capitalize on the growing DeFi market. Coupled with the recent minting of one billion USDT tokens on the TRON network by Tether, TRON’s liquidity and market presence are set to strengthen further.
TRX Price Forecast: Bullish Trends with Caution
As of the latest market analysis, CRYPTOCAP:TRX , the native cryptocurrency of the TRON network, is trading at $0.1572 down by 2.54%. Despite a minor correction, TRX is showing signs of a bullish trend, with the potential to reach $0.20 in the near term. If this momentum continues, CRYPTOCAP:TRX could even achieve a new all-time high of $0.50.
However, the market is not without risks. In a bearish scenario, TRX could stabilize around $0.14, with the possibility of further declines to approximately $0.135 if negative trends persist.
Conclusion: A High-Stakes Gamble
Justin Sun’s $4 billion revenue forecast and strategic pivot towards meme coins represent a high-stakes gamble for TRON. While the potential rewards are significant, the path to success is fraught with challenges. However, with Sun’s track record of bold moves and the network’s growing ecosystem, TRON could very well be on the cusp of a new era of growth and innovation.
As the crypto market continues to evolve, TRON’s ability to adapt and capitalize on emerging trends will determine whether Sun’s ambitious vision becomes a reality. For now, all eyes are on TRON as it navigates this exciting yet uncertain future.

TRON: Cup & Handle Fulfilled and Magic Happened.After the last post, TRON move up with confident to the level of resistant of 0.618 and this is really one of the best move so far. Note that this is the usual level of pullback and possible to re-test level of 0.5 or 0.382. We are near the last week of August, 2024.

TRON breaks out of the cup & handle pattern, just as predicted!TRON is on the move, and has made some massive gains today. There could be some massive gains in this crypto over the next few months. This is a great sign!

(TRX) tronThis has to be the biggest candle I've ever seen Tron produce. I've never seen the price go higher than the 0.15 cents barrier. Looks like this year might be different. I don't own any tron anymore.

Tron triggering the inv h&s breakoutThis ascending solid white line s the neckline to an inverse head and shoulders pattern that tron is finally confirming the breakout from. Target is .1628 . *not financial advice*

Tron TRX price goes against the marketWhile the entire crypto market is falling, the TRX price is rising!)
Maybe this is the reaction of the #TRXUSDT price to the "rumors" that Justin Sun is working on a full-scale launch of #TRON-based memecoins?)
We will find out soon...
Nevertheless, as long as the #TRXUSD price is kept above $0.115-0.12, it will remain in a "long phase".
_____________________
Did you like our analysis? Leave a comment, like, and follow to get more

TRX Cup & Handle breakout on the daily chart.Tron has been on a massive run as of late, and it appears that it may just be getting started. Tron has just surpassed Cardano and taken a spot on the top 10 list of cryptocurrencies.
I see good things coming for Tron, at least from a trading perspective.
Good luck!

Tron Overtakes Cardano: Is This the Beginning of a Bullish Run?The cryptocurrency market has been a rollercoaster in recent times, with various digital assets experiencing significant price fluctuations. In a surprising turn of events, Tron (TRX) has managed to outperform its rival, Cardano (ADA), with a remarkable price surge in the past week. This unexpected development has caught the attention of investors and analysts alike, sparking speculation about TRX's potential for further growth.
One of the most compelling indicators of investor interest is the open interest, which represents the total number of outstanding derivative contracts for a particular asset. In the case of Tron, the open interest has skyrocketed by a staggering 52% in the last 24 hours. This substantial increase suggests a growing appetite for TRX among traders, potentially fueling further price appreciation.
The surge in open interest could be attributed to several factors. Firstly, the recent price rally of TRX has undoubtedly attracted the attention of investors seeking outperforming assets. Secondly, the underlying fundamentals of the Tron network, such as its focus on scalability and decentralized applications (dApps), may be gaining traction among developers and users.
If TRX manages to close a weekly candle above the crucial $0.15 resistance level, it could signal a significant shift in market sentiment and potentially trigger a more extended bullish trend. Breaking through this resistance would indicate strong buying pressure and could pave the way for TRX to challenge higher price levels.
However, it's essential to approach this development with caution. The cryptocurrency market is highly volatile, and past performance is not indicative of future results. While the current trends for TRX appear promising, several factors could impact its price trajectory. These include broader market conditions, regulatory developments, and the overall adoption of blockchain technology.
As with any investment, conducting thorough research and due diligence is crucial before making any decisions. Investors should carefully evaluate the risks and rewards associated with TRX and consider diversifying their portfolios to manage exposure to market volatility.
In conclusion, Tron's recent outperformance of Cardano and the surge in open interest have generated excitement among investors. While the potential for a bullish breakout exists, it's essential to maintain a balanced perspective and consider all factors before making investment decisions. The cryptocurrency market remains unpredictable, and staying informed about market trends and fundamental analysis is vital for navigating its complexities.

TRX (Crypto TRON-USD) BUY TF H1 TP = 0.1354On the H1 chart the trend started on Aug. 05 (linear regression channel).
There is a high probability of profit taking. Possible take profit level is 0.1354
Using a trailing stop is also a good idea!
Please leave your feedback, your opinion. I am very interested in it. Thank you!
Good luck!
Regards, WeBelievelnTrading

Tron (TRX) Chart Analysis — One Of The Most Exciting Charts!In this video, I deep dive into the Tron (TRX) chart. Starting on the 1D chart, we discover the incredible long-term uptrend Tron has been delivering. I discuss crucial levels and why Tron is an interesting investing opportunity.
Afterwards, we move one level lower and discuss short-term trade options on the 4H chart.
Would love to get your feedback and opinions. Share it in the comments!

TRX - Slow and easy trade#TRX/USDT #Analysis
Description
---------------------------------------------------------------
+ Price has hit the support line and successfully bounced back from it with a long wick.
+ Overall trend is looking strong and we can expect the price to hit the next resistance line
---------------------------------------------------------------
VectorAlgo Trade Details
------------------------------
Entry Price: 0.1262
Stop Loss: 0.1156
------------------------------
Target 1: 0.1298
Target 2: 0.1333
Target 3: 0.1391
------------------------------
Timeframe:
Capital Risk: 1-2% of trading amount
Leverage: 5-10x
---------------------------------------------------------------
Enhance, Trade, Grow
---------------------------------------------------------------
Feel free to share your thoughts and insights.
Don't forget to like and follow us for more trading ideas and discussions.
Best Regards,
VectorAlgo

Rebounding from the support levelTRON is currently rebounding from the support level, but the upcoming resistance levels could hinder further price growth. Examining these key levels can provide a better understanding of future market behavior.
Support Levels:
$0.1190 Level: This level acted as initial support and the price has rebounded from it.
$0.1120 Level: The second support level, acting as a stronger backup.
Resistance Levels:
$0.1260 Level: This level acts as the first resistance and might prevent further price growth.
$0.1300 Level: The second resistance level, breaking which could indicate a trend change.
$0.1370 Level: The final resistance level, reaching which could confirm a new upward trend.

TRXUSDT Idea longBINANCE:TRXUSDT
Bullish setup on a 1Day timeframe.
Going for a new higher high first target 0.1440 and the 2nd target is 0.1500.
NOT A FINANCIAL ADVISE DYOR

Tron (TRX) completed a setup for upto 20.50% pumpHi dear friends, hope you are well and welcome to the new trade setup of Tron (TRX).
Previously we caught 10% pump of TRX as below:
Now on a daily time frame, TRX with Bitcoin pair has formed a bullish Cypher move for the next pump.
Note: Above idea is for educational purpose only. It is advised to diversify and strictly follow the stop loss, and don't get stuck with trade.

Is TRXUSDT About to Skyrocket? Potential Bullish Move Ahead!Yello Paradisers! Have you noticed how #TRXUSDT is following the symmetrical triangle trajectory? This indicates a high probability of a bullish move!
💎TRXUSDT has consistently followed this pattern. Currently, a bullish double bottom pattern is forming at the support zone around $0.11050. If the price sustains its momentum, there's a great chance it will make a bullish move above the supply area.
💎Watch for the price to sustain momentum here for a bullish breakout at support $0.11050. If the price fails to hold momentum and breaks below the ascending support, we anticipate a bullish rebound from the lower support level at $0.10759.
💎Should TRXUSDT break below the strong support at $0.10759, it would invalidate the bullish outlook, leading to a significant price drop.
If you want to be consistently profitable, you need to be extremely patient and always wait only for the best, highest-probability trading opportunities. Stay focused, patient, and disciplined, Paradisers.
MyCryptoParadise
iFeel the success🌴

TRX → be sure! buy it!hello guys...
I think TRX will be bullish for these reasons:
1- it made a quasimodo pattern!
2- it is on the flip area!
3- It somehow reacted to the bottom line of the channel!
the target will be $0.133 and $0.19.
___________________________
✓✓✓ always do your research.
❒❒❒ If you have any questions, you can write them in the comments below, and I will answer them.
❤︎ ❤︎ ❤︎And please don't forget to support this idea with your likes and comment

TRX (TRON): Overbought at ResistanceTrade setup : Price is in an Uptrend. It made Higher Lows (see blue trendline) and broke back above 200-day MA ($0.12) to signal trend reversal to uptrend. It's now approaching $0.145 resistance and getting overbought (RSI > 75), hence, we could see some profit taking in this area. Now we look for the right entry opportunity in Uptrend. We wait for price to either 1) break above $0.145 to signal continuation of uptrend, or 2) pull back near $0.12 support for another swing trade entry in Uptrend with +20% upside potential back to $0.145.
Pattern : Price is Overbought at Resistance. This trading strategy finds assets that are overbought (RSI > 70) and are near a resistance area, which means there's a high probability that price will get rejected and pull back near-term. Overbought conditions are typically reached when RSI hits 70 or more. Learn this trading strategy in Lesson 5.
Trend : Short-term trend is Strong Up, Medium-term trend is Strong Up and Long-term trend is Strong Up.
Momentum is Bullish (MACD Line crossed above MACD Signal Line) ABOVE days ago. Price is Overbought currently, based on RSI-14 levels (RSI > 70).
Support and Resistance : Nearest Support Zone is $0.11, then $0.10. Nearest Resistance Zone is $0.145.

TRON Breakout And Potential RetraceHey Traders, in today's trading session we are monitroing TRXUSDT for a selling opportunity around 0.12600 zone, TRX was trading in an uptrend and successfully managed to break it out. Currently is in a correction phase in which it is approaching the retrace area at 0.12600 support and resistance area.
Trade safe, Joe.

Is #TRXUSDT Set for a Bullish Breakout? Don’t Miss This Key MoveYello, Paradisers! Have you been tracking #TRXUSDT lately? It’s showing some strong signals that could lead to a major bullish continuation. Let’s dive into the details!
💎After a careful analysis of #TRON's price action, we’ve observed a promising pattern. For a long time, NASDAQ:TRON has been adhering to a descending trendline. Recently, it has successfully retested this descending resistance, indicating a potential bullish move. If #TRX breaks above the $0.11806 resistance and sustains its momentum, we could see a significant bullish continuation.
💎Due to previous strong bearish pressure, there’s an imbalance in the price. It’s likely that the price might revisit this level to fill the imbalance. If #TRX fails to initiate an upward movement from the retest level, we should look for a bullish rebound from the lower support at $0.11507. However, if the price breaks below the $0.11507 support, this could invalidate the bullish setup and lead to further declines.
Stay disciplined and focused on your trading strategy. If you master these principles, you will already be ahead of most traders.
MyCryptoParadise
iFeel the success🌴

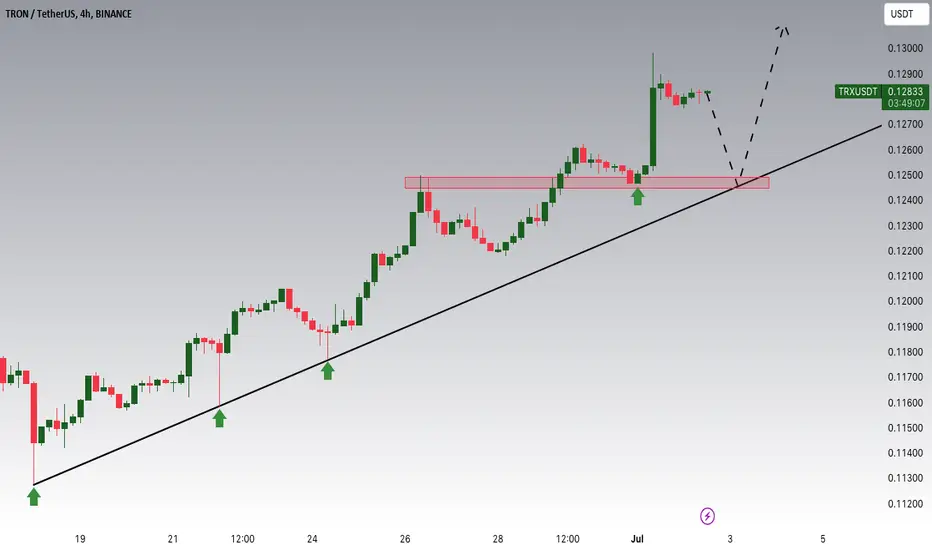
Tron is approaching a significant Support areaHey Traders, in today's trading session we are monitoring TRXUSDT for a buying opportunity around 0.12500 zone, Tron is trading in an uptrend and currently is in a correction phase in which it is approaching the trend at 0.12500 support and resistance area.
Trade safe, Joe.
TRON TRX in Immaculate Wyckoff Accumulation PatternTron painting a crystal clear Wyckoff Accumulation pattern on very high time frame charts. Due to the length of time this took - the upside breakout could be strong and sustained. However, wait for breakout from consolidation to put the trade on.
