TRX/UST : Ain't looking too good
TRX/USDT
Starting a potential mini Downtrend . Staying below 0.113 is not bullish for TRX in the immediate short term and essentially a breakdown below 0.10785 with 4hr-6hr candle closure gonna pull this thing back to 0.1-0.092
Tronusd

Don't miss it ... Tron about a huge pump
since 15 august till now 15 November, we can see Tron is struggling to break out n close above 12 cents.
after the dip in the market we can see clearly that Tron has slowed up, I think perfect time to have some right now.
I think a break out is coming we didn't get a complete rejection till now.
prices still above EMA 50 , EMA 100
Maybe u think u should buy on green box, but it is hard to fell there again as price is respecting the EMAs well.
✅ buy: 0.10 - 0.115✅
🎯TARGETS:
1- 0.1300
2- 0.1470
3- 0.1620
4- 0.1850
5- 0.2220 (worth wait)
6- 0.2600 (worth wait)
💵 Trade Size: 5-7% of Portfolio
🚫Invalidation(SL): daily close below 0.0760

Tron rabbit digital currency on turtle skin TRX
For TRON digital currency, the heart rate ceiling is not far from the mind. Why?
Because the volume is greatly increasing
It is the most backward digital currency
It is breaking the trend line
And Ichimoku Chico Span moves on the camouflage cloud and waits for the camouflage to break
And another beautiful reason that you will see on my chart

trx/usdt : What's next ?Hi friends .
as we see in the chart tron broke the daily trendline and retest it .
the 50 / 14 ema show the strength of bulls . for confirmation we need 4h candle close above 0.12$ to entry long .
☺☺
our target will be 0.15$ . after the breakout .
please support me with like and follow me for more ideas . ☺☺

TRX/USDT LongTron at a nice place after big consolidation is pure bullish reacting to lower band of daily pitchfork and breakout form big trend line also per btc looks good tron will be at much higher price but it moves slow .

Tron breakout, Nov 9This is my idea about TRXUSDT
Downward trend is broken, a pullback may happen or may not happen when it hits $0.123
The volume has increased

Crypto market 09/11: TRon Done target 2 : 0.11356 TRON is being pumped strongly, it is moving towards target 3:0.125 u
It has been operating as a stable coin for too long
This will still be a potential chart . The crypto market overview remains a good trend for altcoins this November.

TRX watch for a 50% moveTRX is in a nice consolidation pattern where MM100 daily slope is turning bullish and also provide support to prices.
MACD Daily and Weekly is green and the H4 is turning bullish, this situation could give momentum to TRX and i wouldn't be surprise to seem a more volatile increase in the coming days.
1st target would be above the 15ct area, if this is break then we would look at higher time frame in direction to ATH.
As long as the MM100 is not broken this scenario will remain and i would be looking a going long within this range.


TRX - NOW !Hello, how are you guys?
This is my analysis and prediction. Pay attention to the line of support and resistance!
If you like the idea, do not forget to support with a like and follow.

TRON DAY LONG FOR INVESTMENTTRON stays in the red for a few days and is a good time to buying
The range I consider may take up to 4 months
Well, this is an SIGNAL FOR investment
#REZA_VGR

NeutralHi guys, well, according to the analysis, we are in a triangle, we can not expect to climb until we get out of it. If we get out of the pattern safely, we will enter the long position. The intersection of the downtrend is with the support line, but the price may move before this intersection

Crypto Explainer - What is TRON (TRX)?Despite being in the shadows for a while now, TRON is a very interesting project that aims to decentralize entertainment applications. From file sharing all the way to gaming, this is definitely an interesting project.
TRX, the native coin in the TRON blockchain made big jumps lately and is eyeing its previous all-time high.
Will TRON breakthrough and prove to be better than Ethereum?
Cheers, from CryptoTicker

JST/USD: #JUST is committed to developing #TRON-based DeFi protoJUST price today is $0.061602569005 with a 24-hour trading volume of $31,577,522. JST price is up 1.8% in the last 24 hours. It has a circulating supply of 1.4 Billion JST coins and a total supply of 9.9 Billion. If you are looking to buy or sell JUST, Upbit is currently the most active exchange.
JUST is a smart contract-powered decentralized lending ecosystem on the TRON network. Acting as a decentralized stablecoin system, it has introduced the first decentralized stablecoin, USDJ, on the TRON network. Pegged at 1:1 with USD, USDJ is issued by collateralizing sufficient TRX on JUST, while the other token JST is used for decentralized governance and paying stability fees.

trxusdThe TRX currency is used to power programs running on the Tron network. One of the most sought-after uses for this type of tech is to create social platforms that reward users directly for content creation and curation

Tron AKA TRX Analysis #TRX Bullish setup //
- Broke DownTrend line
- Above EMA 200 ( long term )
- Retesting previous support
70% of successful trade

TRX 12h How much more to grow The last time we did a global idea for TRXUSDT was in May of this year, less than two weeks before crypto prices started to collapse (ohhh, then we read a lot of hate .... "what are you writing, this growth can't be stopped, etc." but :)
Since then, the price of TRXUSD has managed to fall by -65%:
The TRXUSD price has been rising almost uncorrected for the past two months and has almost worked off all of its losses.
The TRXUSDT price has been trading in a 20% corridor of $0.10-0.12 for the last few days and most likely, buyers are preparing for another upward momentum.
To confirm their strength, buyers should at least keep the TRX price upper $0.10 for the next few days and at most hold above $0.12.
We assume that the growth retardation can start in the range of $0.13-0.144 , in this zone fully compensates for the May fall. Deceleration in this area may be provoked by the fact that traders, who had been in a drawdown for 5 months, will want to fix position at break-even and forget about this negative experience.
If the area of $0.130-0.144 will not have critically large trading volumes, it will be a signal that the sell-off time has not come yet , and the growth itself may continue at low volumes, as it has been doing for the last months.
Targets for a move higher are shown on the chart — $0.155 and $0.169
_____________________
Do you like the idea fulfilment? Does it help you trade and make a profit?
Do you want more forecasts from us?
Give us motivation! (Like, comment and donate). These little things won't make us rich, but they will warm the trader's soul while writing the next idea!

TRXUSDTTRX is creating an ascending channel. It successfully broke the major resistance and retest was successful. IF TRX breaks the dynamic resistance (descending trendline) we could see a nice move to 0.18.
TRX looks really promising here, Keep an eye on it !

MINIMALIST ANALYSIS FOR $TRONLOOKING AT TARGETS $TRON
So far we have made it from the correction and now BUYERS from our ENTRIES at CORRECTION are looking at FIB REVERSAL EXTENTION. We may be able to achieve our exit and with luck, our MAXIMIZED TARGET AREA.

TRON - Decentralise the WebTRON is the world's fastest growing public chain.
I am LONG on TRON. Once we see a breakout around 0.15 AUD, TRON will RISE fast.


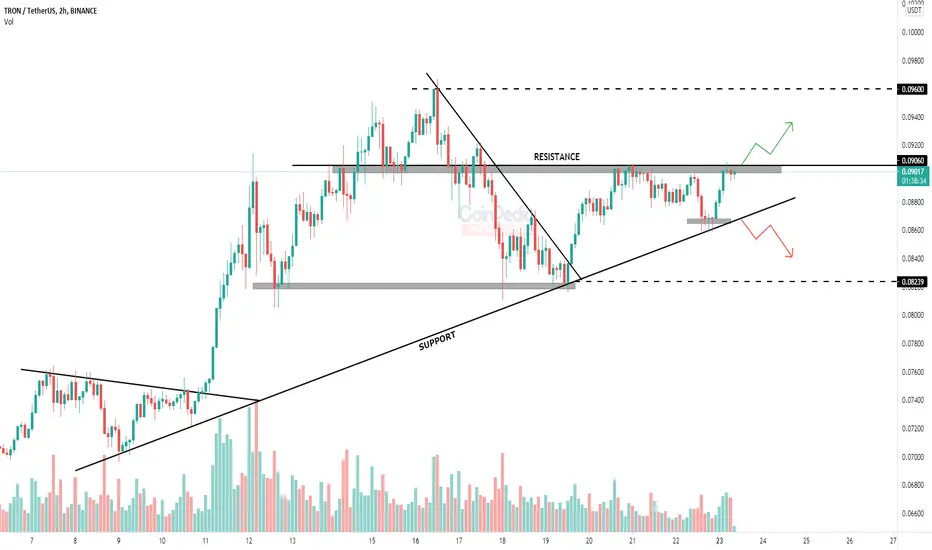
TRON analysis in 2H time frame* TRON is in a tight consolidation between it's resistance around $0.09060 and the below trend-line.
* The below trend-line is working as support for the price.
* If the price breaks the above resistance we can expect a rally till $0.0960.
* TRON is bearish below the lower trend-line (support).
TRX is going to be volatileTRX should go to the resistance zone. on its way, there's a redline. if price breaks this line, it can go up to the next target. although there's no clear analysis of what happens in this gap.
The red support shown in chart is really powerful and will not be easily broken.
Don't forget to follow and comment
