Troy

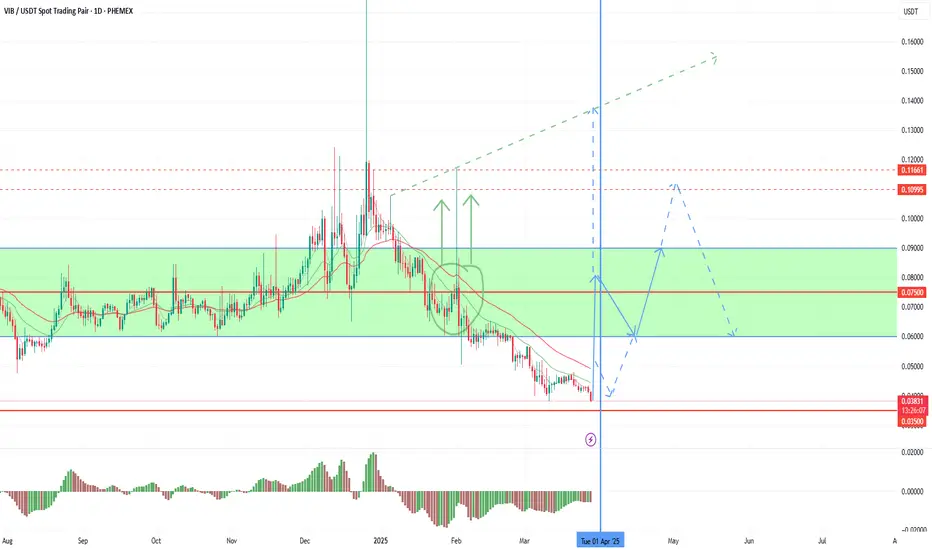
A new growth opportunity for VIBVIB is preparing a new growth momentum today. As I wrote in previous reviews, finding a token below the 0.035 level is appropriate when the ether is below 1500, even if there is a monitoring tag. At the moment, the breakdown is more likely caused by panic sales on tag assignment. However, the assignment of the tag was obviously already worked out by the price when it fell below the 0.075 support. At the moment, I expect to enter the more appropriate 0.050-75 zone, corresponding to both the current market position and the tag. The opportunity for a refund will appear as soon as the indicators stop extinguishing sales, which has already happened on small timeframes. That is, today and tomorrow there is a high probability of a weekly candle reversal above the key support of 0.0350–375, and in the case of a daily or weekly candle opening higher, attempts to grow to 0.075-100 are likely, which is the main non-closed retest zone after the January impulse and is highly likely to be worked out. A retest of 0.035-50 from the current level will bring up to 100%+ profit.

Consolidating the UFT trendApril is the month of the strongest seasonal growth in the first half of the year. In the first half of the month, the probability of purchase disruptions prevails against the background of the negative closing of the last quarter, however, as we approach the middle of the month, the probability of a stable bullish trend with a sharp reversal for individual coins will begin to increase.
Today I want to once again draw your attention to uft, which gave you two waves of 40-50% each and good opportunities to slip up. Unfortunately, we did not see a stable reversal on the quarterly candle due to the negative overall market dynamics and the falling altcoin index. However, the new quarter opened above the strong 0.075 support, which provides an opportunity for a hike to 0.15 and a stable trend. Purchases from the current 0.05 level can bring up to 3-5X in the absence of delisting and the beginning of a trend.Also, in the second wave, a breakout signal is left, and in the case of an exit above 0.11 from the third wave, there is a high probability of a trend to retest 0.21-25 with intermediate resistance at 0.150-175. A similar pattern has already worked out last week on a smaller timeframe.
Vib troy pda alpaca voxel cream can also show powerful growth impulses among coins with the monitoring tag and fio pivx bifi among coins without the tag. Coins with the monitoring tag often show good dynamics in the second half of the week due to the low probability of delisting. In the first half, it is worth keeping a stop loss close to the price in case of delisting until noon.

#TROY/USDT#TROY
The price is moving in a descending channel on the 1-hour frame and is expected to continue upward.
We have a trend to stabilize above the 100 moving average once again.
We have a downtrend on the RSI indicator that supports the upward move with a breakout.
We have a support area at the lower limit of the channel at 0.000804.
Entry price: 0.000848
First target: 0.000882
Second target: 0.000925
Third target: 0.000973

New opportunities for earning money on VIPTo date, we have come close to a change in the quarter and a high probability of increased volatility. The second half of the monthly candle on ether opened in the negative zone, which gives a signal to hold sales until the end of the quarter. However, in recent days, individual coins have the opportunity to work out their accumulated potential with a bullish reversal of the monthly candle. VIB is currently the most oversold coin without the monitoring tag. Against the background of the pinbar of the last monthly candle, there were few buyers this month, but technical buy signals were left up to a 0.1 retest even with the current market position.
In an optimistic scenario, today's daily candle may turn bullish with continued purchases until the end of the quarter. Negative statistics on the United States today may contribute to this. In the case of a reversal in the current quarter, the target may be a local breakout and retest of the trend line formed by the previous breakdown.
With less volatility and strong statistics coming out in the US today, the probability of a rebound from the retest of past hows in the range of 0.110-125 and a transition to a flat near the key long-term level of 0.075 +-15 prevails. In this case, the start of purchases may be delayed until the opening of a new quarter, or the next announcement on the assignment of the monitoring tag.
The main long-term support is 0.035, a hike below which is possible only under extraordinary circumstances with the withdrawal of ether by 1,500, the dominance of alcoins by 7.5% or the assignment of the monitoring tag. Given the current oversold conditions and high targets, assigning the tag will only give a temporary departure below 0.035 with further growth to 0.075, similar to vidt.
In addition to vib, among coins without the monitoring tag, so far I am considering only pda with a possible new wave of growth, especially if the tag is not assigned in the new month.
The coins that already have the monitoring tag are the most oversold on binance, due to which they have shown good growth impulses in the last two weeks against the background of attempts to reverse the quarter. Before the next delisting announcement, there is time for new waves to reverse the current quarter under an optimistic scenario, as vidt shows, and a pullback already in the new quarterly candle. The most interesting scalping companies among this group today are uft troy alpaca with a growth potential of up to 100%+ and cream nuls with a possible growth of up to 50%+.
TROYUSDT 1WTROY ~ 1W Analysis
#TROY Buy gradually from here with a short -term target of at least 20%+. This is the lowest support for now.

Quarter reversal from the weekendTo date, we are clearly moving along the scenario outlined in the last review and are approaching an important bifurcation point and the possibility of purchases or toppings by position. The market remains under the influence of multidirectional signals. On the one hand, the positive opening of the quarter gives rise to a powerful market buy-off for the reversal of the quarterly candle for coins. On the other hand, the negative opening of the second half of the quarter delays this wave of purchases. As a result, the growth wave in the middle of the quarter was rather weak, although it was comforted by good growth waves for individual coins. As a result, the main purchases, as mentioned in previous reviews, are expected in the last monthly candle of the quarter.
Against the background of the end of the sales period, the bears have the last opportunity to test 2600 on the air today and tomorrow. Sales attempts will be made against the background of the planned powerful statistics for the United States. Judging by the technical picture, the levels of 2500 and 2600 for ether will not be broken, and as we approach the end of the month, we will see an increase in purchases of altcoins from the weekend, with major breakouts in the new month.
In the most optimistic scenario, the statistics will be negative and will give an opportunity to hike above 2750 this month.
Among the coins to work with, I mainly consider vib og alpaca uft pda vidt in the medium term with likely growth waves up to 70-100%, according to which I will consider increasing the position by the weekend. Ast burger pivx wing quick looks just as good for scalping, with likely growth waves of up to 30%+ at least.
Among the coins with the monitoring tag, troy still looks the most interesting, with open targets in the range of 0.0032-35 and a possible breakout at a retest of 0.0050-75 with a positive market. I am also considering hard and cream for scalping.
According to vite, which unfortunately did not fulfill the technical goals left, there is a fairly high probability of an exit pump over the weekend with an attempt to reverse the weekly candle against the background of its opening above 0.0075 and the bullish last candle. In an optimistic scenario, especially in the case of negative statistics on the United States, there is a possibility of growth up to 0.0125-150-210 , similar to the exit pump of gft, which closed its intended targets before delisting. In a more negative scenario and low volatility, a pullback from the 0.0075-60 levels is likely over the weekend, which can already bring up to 150% profit. I recommend investing in this scenario after the statistics are released and the risk of additional drawdown is reduced. Today and tomorrow, the potential of the 0.0020-25 test remains before the pump. It is also worth weighing the extremely high risk of such an investment. Powerful technical signals remained for this token, up to a retest of 0.021-25, and therefore, after delisting from binance, there is a possibility that these goals will be fulfilled. If the coins remain in stock after delisting, it makes sense to hold them until the end of the attempt to reverse the quarter on the market until the end of April.

A new wave of VIB growthToday, another opportunity has formed for vib, which once again showed the best dynamics in January with a breakdown of 90%+. The year for the token opened quite positively above 0.0975, which gives a signal to consolidate above 0.01 in the future. The last impulse was given by the collapse of the last peaks, which gives a signal for at least a retest of strong resistance at 0.105, consolidation above which ensures an increase in volatility up to 0.15-25, especially considering the strong signal for a collapse left before the new year. At the moment, the price has traded near the long-term support of 0.055-625, a hike below which is likely only in the case of serious force majeure with a drop in ether by 1500-1750, bitcoin by 75k, or the assignment of the monitoring tag to the token (I expect the next tag changes in early April).
Given the successful opening of the second half of the quarter above the interim support at 0.06 and the time reserve before the possible assignment of the tag, there is a high probability of a repeat attempt to reverse the quarter. It is highly likely that we will see a strong resistance test at 0.075 by the end of the week with a likely breakdown, given the significantly higher final targets. If a new week opens above 0.075, there is a chance of stable support for purchases with breakouts at 0.0925, 0.105 and higher. To date, the token is the most oversold on binance and has the greatest growth potential of up to 100%+ among coins without the monitoring tag. There is also a possibility of adding futures, in which case growth up to 0.25 will not take long. In case of a fall below the 0.0550-625 support, a return to the retest of this resistance up to 0.075 is almost guaranteed, given the current oversold conditions, which makes investments quite reliable.
At the moment, the token is well suited for storing funds in an average amount along with og uft pda vidt.

Resumption of sales on the market before the end of the monthTo date, the market has passed an important boundary in the middle of the quarter, and therefore it is time to make another review of the prospects. Unfortunately, with a good opening of the year, there continues to be a deterrence of purchases in the market and the maintenance of the medium-term correction that has begun. The previous plan worked out according to the least volatile scenario with an increase in purchases only by the middle of the quarter. However, the activity of buyers was not enough even to open the second half of the quarter above 2750. Large investors are selective with investments and are in no hurry. With this picture, the probability of holding sales until the end of this month prevails, but the opening level of the quarter will play a role in the new monthly candle, on the basis of which I expect a good bull run on altcoins for the retest of the opening of the year along with ether aimed at 3250+.
There is no obvious sales signal, so I think the flat will remain quite technical. This week, I expect purchases to remain until the weekly candle closes. In the first days of the new week, it is also likely that purchases will continue based on the inertia of the current week, but from Tuesday to Wednesday, the probability of resuming sales to draw the second bottom on the daily chart around 2600 AETHER and resuming purchases as we approach the new month prevails. The main task of the bulls will be to keep the price above 2500 until the end of the month, which will be enough to turn the quarter around. There is still a possibility of a smooth release of ether above 3000 this month, however, the probability of this at the current opening of the second half of the month is rather weak in my opinion. Significant factors with a sharp drop in the dollar should contribute to this.
With the current picture of coins showing good growth, the probability of a pullback to the second bottom from the nearest resistances prevails. In particular, for alpaca from 0.175-190 or for OG from 4.75-90. Also, the probability of a pullback prevails for combo and slf, which is likely to make it possible to re-borrow more profitably with further higher levels in the medium term.
First of all, in the remaining time until the middle of the new week, I am considering coins that have not yet shown good growth, such as vib uft pda vidt ast with possible breakouts of up to 50%+ in the coming days. I can also show growth impulses for coins with the monitoring tag, which often give growth last on weekends. The most oversold among them are vite troy amb cream.

Preparing for powerful purchases at the turn of the quarterTo date, the market has come to a new opportunity for purchases and another market review. For the bear market, the pullback on the last monthly candle worked well, vib cream og troy performed well with growth impulses up to 30%+. However, as I emphasized, we still have the potential to go to 75k in bitcoin and below, and therefore we continue to catch only pullbacks on large charts against the bear market. I still recommend carefully weighing the top-up for large-cap coins, as such assets may continue to fall until the fall.
In the coming week, we are approaching the key bifurcation point – the middle of the quarter. There is still time before this day for the bears to attack, however, the opening of the month on ether above 3250 is likely to compensate for the attempt of a new loy test in the new week. Due to this picture, there is a fairly high probability of a pullback and an attempt to change the trend today. If the successful extinguishing of sales continues, we can expect an exit to 3100 on ether by the end of the week and in the case of opening a new weekly candle above 3000-3100, continued purchases with the aim of turning the monthly candle into a bullish one. In a more negative scenario, customer activity will remain rather weak with an increase in purchases as we approach the middle of the quarter. In this case, at the beginning of the week, there is a possibility of new sales attempts on the 2600 retest with an increase in purchases from the middle of the week.
Depending on the opening of the second half of the quarter above / below 3250, it will be possible to make a forecast about the further movement of the market.
To date, ether has tested the main medium-term support of 2500, for a fall below which there are no arguments yet when bitcoin is held above 90k, the euro above 1.025 and wti oil above 70. If one of the assets goes below one, there will be a risk of the alt market sinking to an additional 30-40% from current levels. At the moment, the probability of holding these assets above the levels with a gradual reversal of the altcoin market and attempts to turn the quarterly candle into a bullish one for individual coins prevails. That is, in the second half of the quarter, there is a probability of a large bull run with coin impulses up to 100%+.
To date, coins such as vib og alpaca pda vidt have reached the medium-term bottom, which I primarily consider for storing funds in the medium term and additional scalping. In case of market disruptions, drawdowns of no more than 20-25% are likely when tested with ether 2500-2600. The growth potential for these coins is to exceed the opening level of this month with an increase of up to 50% in the short term and a reversal of annual candles in the medium term with an increase of up to 100%+. We also reached powerful supports for uft wing combo slf quick pivx ast, which can slide to 30-35% lower in the event of ether disruptions, but they also look good in the mid-range with a growth potential of up to 70%+ in the event of a bullish reversal of the annual candle in the future.
Coins with the monitoring tag are still the most oversold. Among them, vite stands out, which gave good breakouts at every opportunity. The growth potential remains up to 0.021-25, which can give up to 300% profit. Cream troy amb hard remains in an extremely oversold position with a growth potential of up to 100%+. Troy stands out strongly, which, unlike cream, did not retest the drop level by 0.0031-35, this rebound can bring up to 150%+.
Let me remind you that coins with the monitoring tag are subject to the threat of delisting, which most often occur in the first half of the week, and therefore it is worth keeping short stops at the current price at the beginning of the week or taking assets into operation in the second half of the week.

TROYUSDT 1WTROY ~ 1W Analysis
#TROY This is the lowest support block for now. buy gradually from here with a minimum target of 20%++

TROY/USDT: Is the Market Ready for a Turnaround?Is This the Moment to Buy or Brace for More Drops?
TROY/USDT has been caught in a whirlwind lately, hovering just above its absolute low of 0.001869, set only hours ago. With the current price at 0.001922, the asset has rebounded slightly, marking a modest 2.8% climb from its lowest point. However, it remains a staggering -76.8% below its absolute high of 0.008272, recorded just 23 days ago.
Indicators reveal a mixed picture. The RSI14 currently sits at 33.6, signaling that the market is creeping out of oversold territory, while the MFI60 of 42.8 suggests there’s still room for increased buying pressure. Price action shows a series of sell-off patterns dominating recent sessions, including the "Increased Sell Volumes" pattern. This has left traders questioning whether the bottom is truly in.
Fascinatingly, some buy patterns like the "VSA Buy Pattern Extra 1st" hint at latent bullish energy. Could this signal the market's readiness to pivot upward? With moving averages such as the MA50 at 0.002069 and MA200 at 0.002331, TROY must first break key resistance at 0.001962 to build momentum.
This begs the critical question: Is this the calm before a reversal, or will bearish dominance drive new lows?
Stay tuned as we monitor whether bulls will step up to reclaim the narrative or if the sell-side momentum will drive prices to fresh lows. Let's trade smart and capitalize on these crucial levels!
Roadmap: TROY/USDT – Pattern Playbook for Recent Action
Step 1: Increased Sell Volumes – The Downward Warning (2025-01-25 00:00 UTC)
The roadmap begins with the “Increased Sell Volumes” pattern, signaling a clear sell direction. Price opened at 0.00196 and closed at 0.00187, firmly validating the bearish momentum. As expected, the low of this pattern (0.00187) was maintained in the subsequent pattern, confirming that sellers held control. The absence of an upward trigger point confirms this as a pivotal moment for short-term bears.
Step 2: VSA Buy Pattern Extra 1st – The Bullish Rebound That Could (2025-01-25 00:00 UTC)
This pattern introduced a buy signal, hinting at potential recovery. The price low remained stable at 0.00187, while the high saw no meaningful breakthrough at 0.00196, capping bullish aspirations. Unfortunately, the lack of follow-through in subsequent patterns suggests this was a false dawn, making it skippable from active considerations.
Step 3: Buy Volumes Takeover – The Bullish Crossroad (2025-01-23 21:00 UTC)
Following a sharp drop, the “Buy Volumes Takeover” pattern flagged a shift to buy momentum, with a promising move from 0.002061 to 0.002024. The upward confirmation in subsequent patterns reinforced this bullish shift. Importantly, this pattern laid the groundwork for further upward tests, earning its place in the roadmap.
Step 4: VSA Manipulation Buy – The Critical Test (2025-01-20 13:00 UTC)
The market shifted gears with the introduction of this pivotal buy pattern. Starting at 0.002103, prices climbed to 0.002125, supported by a solid trigger at the low of 0.002082. This pattern was pivotal in defining the bullish breakout zone and remained validated by subsequent upward movement. It served as a major opportunity for long positions.
Step 5: Sell Volumes Max – A Bearish Comeback (2025-01-20 00:00 UTC)
As bulls attempted to solidify control, bears struck back with the “Sell Volumes Max” pattern. From an open at 0.002171, the price dropped to 0.002055, resetting market sentiment. The failure of subsequent patterns to breach higher highs validated the bearish dominance of this move.
Key Observations and Lessons for Traders
Trigger Points Matter: Successful patterns consistently respected their trigger levels, while failed patterns often lacked proper follow-through.
Main Direction Clarity: Each validated pattern aligned its main direction with subsequent price action, demonstrating the value of sticking to technical confirmations.
Context Is King: Patterns alone don’t guarantee success; interpreting them in context with recent highs, lows, and market sentiment was crucial.
Final Word
This roadmap serves as your cheat sheet for understanding TROY/USDT’s latest moves. By focusing on trigger points and validated patterns, traders can ride the waves with confidence. Stay sharp, keep your levels tight, and let the patterns guide the way!
Technical & Price Action Analysis: Key Levels to Watch
Here’s the rundown of crucial support and resistance levels for TROY/USDT. Keep these in your toolkit – they’re your roadmap for potential moves. But remember, if these levels fail to hold, they’ll likely flip into resistance zones on the next test.
Support Levels
0.001922 – The current price level, sitting just above the absolute low. A failure here could spell deeper trouble for the bulls.
0.00187 – The all-time low. A make-or-break zone. If this cracks, expect bearish momentum to accelerate.
Resistance Levels
0.001962 – Immediate resistance. If the bulls can’t take this out, sellers might regain the upper hand quickly.
0.002155 – A mid-range level that could be the next test if the momentum builds.
0.002437 – Higher up, this zone would signal a shift toward more bullish control if broken.
0.002568 – Another step up, but it won’t come easy without a strong catalyst.
0.00283 – The top barrier, marking a significant psychological and structural resistance.
Powerful Support Levels
None identified – This underscores the fragility of the current price range. With no powerful support below, caution is key.
Powerful Resistance Levels
None identified – Resistance levels outlined above will be your focus for now.
If these levels don’t hold or break decisively, expect swift flips. As traders like to say: "Support turns resistance, and resistance becomes the ceiling that bulls have to punch through." Stay nimble, and watch the price action closely around these hotspots!
Concept of Rays: Precision Trading Strategies Based on Fibonacci Dynamics
The "Rays from the Beginning of Movement" concept brings a systematic, Fibonacci-based approach to analyzing price action. These dynamic levels are designed to capture the probabilities of price interaction, signaling either a reversal or continuation. Let’s dive into how traders can use these rays to enhance their strategies and target opportunities.
How Rays Work
Dynamic Fibonacci Rays: Each ray stems from the beginning of a price movement, representing natural angles of inclination.
Dynamic Adjustments: Rays adapt to new patterns, showing updated movement ranges and potential pivot points.
Interaction with Moving Averages: Combining rays with key moving averages (e.g., MA50, MA200) amplifies the precision of identifying trade opportunities.
These rays create zones of interaction, and once price moves beyond one ray, it often travels to the next, providing clear, actionable targets.
Optimistic Scenario: Bulls Step In
Price interacts with a Fibonacci ray and begins an upward movement, targeting the next levels. Supported by interaction with MA50 and MA200, the following trades are viable:
Entry: At 0.001962, after interaction with the lower Fibonacci ray.
First Target: 0.002155, aligning with the next ray and immediate resistance.
Second Target: 0.002437, mid-term resistance signaling continued bullish strength.
Third Target: 0.002568, testing a higher Fibonacci ray.
Pessimistic Scenario: Bears Take Charge
If price breaks below critical support levels and interacts with descending Fibonacci rays, the movement may extend lower:
Entry: At 0.001922, after failing to hold above the lower ray.
First Target: 0.00187, retesting the all-time low and Fibonacci support zone.
Second Target: Possible extension lower if volume increases, signaling continued bearish dominance.
Suggested Trades Based on Fibonacci Rays
Long from 0.001962 to 0.002155: Ideal for bulls looking for quick gains on ray interaction with MA50.
Short from 0.001922 to 0.00187: A straightforward bear trade targeting key support.
Long from 0.002155 to 0.002437: For breakout traders, leveraging momentum into the next ray zone.
Short from 0.002437 back to 0.002155: Profit-taking opportunity for mean-reversion strategies if momentum stalls.
These trades follow the principle that movement will continue between rays, with each level providing clear targets and decision points. As always, price action and volume at these key zones should confirm entries and exits.
This systematic approach ensures traders are aligned with the dynamic nature of the market, using Fibonacci rays and moving averages to guide precise entries and exits. Let the rays light your path to smarter trades!
Call to Action: Let’s Trade Smarter Together!
Traders, your thoughts and questions are always welcome—drop them right in the comments below! Whether it’s feedback on this analysis or an idea you’d like to explore further, I’m here to connect and discuss.
If you found this post helpful, don’t forget to Boost it and save it to track how the price plays out according to my markup. Watching levels in action is the key to mastering entry and exit strategies.
By the way, the rays and levels you see here are automatically plotted by my proprietary indicator-strategy. It’s available privately, so if you’d like access, feel free to reach out via direct message. Let’s talk about how it could work for you!
Have a specific asset in mind for analysis? I’m happy to create markups tailored to your needs. Some ideas I can share here for free, while others can be done privately if you prefer to keep them exclusive. Just let me know in the comments what you’re looking for, and I’ll see how I can help.
Rays work universally across all assets—crypto, stocks, forex, you name it. If there’s something you’d like me to map out, give this post a Boost and let me know in the comments.
Lastly, don’t miss out—follow me here on TradingView to stay updated on all my analyses and strategies. Together, we can navigate the market with confidence. Let’s trade safe and smart! 🚀

Today, determining the future direction of the marketTo date, we have passed the middle of the month, and I want to review the market situation. First of all, it is worth noting that the second half of the month opened below 3250 on the air, which gives a signal for new attempts to break 3000. That is, the predominance of altcoin sales remains until the end of the month. Due to this market situation today and tomorrow, there is a high probability of an impulse to 2900. Yesterday's growth wave is only a retest of the last resistance and an opportunity for buyers to exit. Today, statistics on the United States will play an important role. With negative data, it will be possible to hold 3250 until the end of the week, compensate for sales and reach above 3500. With strong statistics, sales are likely to be extremely aggressive and continue into the new week.
Bitcoin opened the second half of the month more positively, above 95k but below 97.5, which so far gives a signal to keep the flat in the range of 92.5 - 97.5 with new attempts to exit above 100k. According to the overall picture, the altcoin dominance index is likely to fall by the end of the month, up to 9% in a negative scenario, in order to maintain bitcoin and open a new month above 100k.
With the continuing negative picture on the market, most altcoins continue to move synchronously with the altcoin index and ether, waiting for further market dynamics to be determined. If 3150-3250 is held on ether and negative statistics for the United States are released today, we can expect new impulses for individual coins as part of an attempt to turn the monthly candle into a bullish one. The most oversold cream pda ast alpaca vidt bifi coins can show good impulses. Pivx slf uft wing pros have also returned to strong supports, which can also give major rebounds. Over the weekend, there is also a high probability of new impulses for coins with the monitoring tag due to the lack of delisting. First of all, the interests of vite and hard.
By default, deletions from binance loans were alerted this week. The binance opportunity is trying to bring down the price in this way.

Deceptive market at the beginning of the yearThe first week of the new year is coming to an end, I want to review the market situation. The year for ether and bitcoin opened in the 90-95k and 3250-3500 flat zones. Due to this, the new annual candle is swinging quite calmly. However, in my opinion, this lull is deceptive. The current wave of purchases is so far only a retest of the key 100k level for bitcoin, from where the probability of a bear attack is high. For many altcoins that have shown growth to date, this is also only a retest of the last resistance.
The foreign exchange market also closed the first week extremely negatively, with a steady rise in the dollar. In my opinion, from the current pullback in the crypt, there is a high probability of a resumption of sales, which we observed at the end of the year, with an attempt to continue the trend in bitcoin in order to work out a retest of 75-85k. In this case, today or tomorrow, the crypto market may align with the currency, with significant sales, up to the turning point of the week for individual coins.
In an optimistic scenario, ether will hold 3500 and open a new week higher, by increasing the gap in the eth/btc pair, due to the opening of the year above 0.0035. In this case, with smooth stable sales of bitcoin, altcoins will have opportunities for growth and a further 15% increase in the altcoin index. In my opinion, the probability of this scenario still prevails.
In a more negative scenario, sales of bitcoin and ether will be more aggressive. In this case, bitcoin can show a sharp increase in dominance and money from the market will be used to smooth out the fall of bitcoin. At the same time, the altcoin index may drop down to a 9% retest, which will lead to fractures for most coins.
With the current picture and the threat of a 75k hike in bitcoin, I still recommend carefully weighing money management and reducing positions for those who did not do so in the wake of growth before the new year. Next week, it will be possible to weigh the activity of sellers and make more confident forecasts.
As I expected, there was another manipulation of binance tags this week. It was not for nothing that before the change of year I recommended sales for troy with a likely hike to 0.0025, even then it became obvious that there was no working out of higher goals and a reversal to retest loyalties. After assigning the tag, a test of 0.0015-25 is likely.
As I wrote in the last article, if there is no assignment of the monitoring tag, vib becomes the most interesting tool in the current market. If binance did not consider the dynamics of the token too weak, there is a high probability of continued growth to reverse the medium-term bullish trend with an exit to 0.25+ and the addition of futures. There has already been a successful cancellation of year-end sales and an attempt to return to the trend. With an optimistic scenario and an exit above 0.00000100 for vib/btc, there is a possibility of a powerful impulse to break last week and pair with udt. In the current overbought market, vib remains the most oversold token on binance, which retains a high growth potential. There has also been a rise in vib against bitcoin more than once, creating a gap in vib/btc. A similar pattern could happen again this week. In case of a successful breakdown of vib, vite can also show pleasant dynamics, which also remains the most oversold on binance, having very high technical targets for retest. But because of the monitoring tag, vite growth attempts most often occur last before the week closes.
On average, for most altcoins, I still expect synchronous movement with the altcoin index, before determining further dynamics in the tops in the new week. In my opinion, the probability of fashionable breakouts or steady growth ahead of the altcoin index in the new week is rather weak.

TROY - LONGThis is a medium term trade, maybe in 2h or 4h timeframe. I think it is quite high risk. The stop is quite short, because it is not a good idea to stay in a fall in this currency. Be very careful.
T1: 0.0055~0.0060
T2: 0.0076~ 0.0080

TROYUSDT (TROY) Updated till 02-01-25TROYUSDT (TROY) Daily timeframe range. despite many alts retraced this thing holding real strong till now. if it can do that till money flows into alt market, it got good chances to run back atleast above midrange or higher. for now it needs to stay above 0.003704.


A new signal to maintain purchasesTo date, we have passed the middle of the month, I want to consider the prospects for the end of the year. The second half of the month opened positively on the air above 3750 and 3850, which gives signals to exit above 4000 in order to test the 4250-4500 range. This is a positive signal for altcoins, and therefore we have seen new growth impulses for coins for the upcoming continuation of the trend. Bitcoin opened the second half of the month above 100k, which reduces the probability of a retest of 75-85k in the near future. However, an opening below 102.5 gives a signal for a flat of about 100k with attempts to go lower. With this picture, it is likely to go to the 110-115k test with a further return to 100k by the end of the year, which will lead to a rollback on the air, even taking into account positive signals.
According to the overall picture, the probability of growth this week prevails as part of the continuation of the trend of the current month and quarter. But from next week until the end of the year, it is worth keeping in mind the likelihood of a new wave of pullback in the market according to the annual schedule, which may continue in January. With such a picture, it is worth being careful about overbought coins with large capitalization. As I wrote earlier, the rollback on such coins, which began at the first market disruption at the beginning of the month, may continue until the end of the year with the transition to active sales in the new year. More interesting are the oversold coins, which continue to turn the annual candle into a bullish one.
New waves of growth on the local market, in particular, can be expected for VIB. Signals have been left for further overshooting and in the event of a breakdown from the third wave of 0.125, the road to the range of 0.15-25 will open. Growth is still going against the entrenched bearish trend on the monthly chart, giving rebounds from key levels and new opportunities for safe earnings without excessive overbought.
A local replay can also show OG TROY AST. According to OG, there are clear signals for a retest of 7.5-9$ at least. The token has quite a lot of liquidity, which provides sharp breakouts.
TROY, along with OG, has signals for further overshooting. In the case of a 0.0075 breakdown, there is a probability of a powerful growth wave for the 0.0125-150 test. At the moment, we are working out the sales momentum of 0.0035, which occurred before the last wave of growth. From 0.035-40 from the third wave, there is already a chance to break above 0.0075. However, with a negative market, there is a probability of a breakdown to 0.0250-275 before the start of growth on the move.
AST has targets at 0.21-25, where it can break through in case of consolidation above 0.15. However, incomplete emission exerts additional pressure, which leads to trend disruptions and increases the likelihood of a breakdown as we approach the end of the year.
This month, there has not yet been a new delisting announcement, which threatens the dynamics of coins with the monitoring tag. If there is no announcement in the next couple of days, I will be looking at new AKRO and VITE purchases in the second half of the week. Also, with them, HARD can give a new impetus. However, the threat of delisting next week is likely to make the growth waves quite short-term.

TROY/USDT signal buy📈 Buy Signal for TROY/USDT
✅ Suggestion: You can buy now in the live market.
🎯 Growth Expectation: I anticipate a 10% to 22% increase in the spot market. 🚀
📊 This is a great opportunity to capitalize on TROY's upward potential.
💬 To manage this signal effectively and explore more signals:
1️⃣ Follow my TradingView page 📊
2️⃣ Send me a private message for further guidance.
💎 Let’s grow and profit together! 💰

New wave up to 80%+ on VITEToday, another delisting announcement was released, in connection with which I warned against working with coins of the monitoring tag in the first half of the week. Now the coins that were not included in the announcement are becoming interesting. First of all, this is VITE, which is the most oversold at the moment. Last week, a signal was left for further overshooting and a likely test of the key level of 0.025, opening the way to 0.035-50. Given the assignment of the monitoring tag, I do not think that the price will easily gain a foothold above this level, despite the strong signal for a retest of about 0.035.
So far, the most likely scenario is a test of the 0.0225-75 flat range with a further rebound and determination of the closing level of the year, depending on the overall market dynamics. The month opened above 0.014, the second half of the month above 0.015, which is also a signal for growth to 0.02+. The zone of the set of positions is the flat range of 0.014-16 near the key level of 0.015. In the absence of a deeper drawdown on the tops today, the weekly candle will begin to turn bullish today and we will not see prices below the current VITE. In the event of an additional market drawdown after the decision on the US interest rate, VITE will probably be quite effective in compensating for the market drawdown, due to the high growth potential and after the flat it will give a breakdown on Thursday-Friday against the background of the general market growth in the second half of the week.
On the 0.025 test, it is worth carefully monitoring the dynamics, since there is a probability of a breakdown immediately by 0.035 within the framework of the reversal of the annual candle. But even if there is no consolidation above the level, the current wave of growth can bring up to 75% profit.
Also, from coins with the monitoring tag, HARD and FIRO can show pleasant growth waves, although they currently have lower goals of up to 30-50%.
VITE with a target of growth to 0.025 and VIB with a target of 0.15 are the most oversold coins on the binance, which have not yet shown a reversal of the annual candle, which may return them to the top of growth in the coming days similar to last week. As I have repeatedly written, for most overbought coins that have been on the radar for the last two months and have shown significant growth, the probability of continued sales prevails until the beginning of the new year.

Probable move over VIBAgainst the background of maintaining purchases this week, there is a fairly high probability of moving over VIB, which has already given 6 waves of 25-70% over the past two months. Trying to grow against the established bearish trend on the monthly chart, technical rollbacks occur from most levels to the base of the previous figure, which gives new and new opportunities for scalping, despite the fact that the token remains in a rather oversold position with a small risk of drawdown. So far, the goal in the case of a calm market is to continue the reversal of the annual candle with an attempt to test the range of 0.15-25.
To date, we are drawing a shadow on a new weekly candle. The main reversal zone is the flat range of 0.0875-950 near the strong formed support level of 0.09. The opening of the month above 0.075 gives a signal for an attempt to consolidate above 0.1. The opening of the second half of the month above 0.09 supports this dynamic.
In an optimistic scenario and in the absence of a deeper pullback on the tops, a reversal and return to the bullish VIB trend is possible today with a reversal of the current daily candle into a bullish one. With less volatility and the closing of a new daily candle above 0.09, a return to the hay is likely within a couple of days. With a reversal today and tomorrow, there is a possibility of returning to the top of growth in the binance, even with a small percentage of price increase, given the low–volatility market. This could lead to a sharp influx of liquidity and a new breakdown, which we observed over the weekend. The new wave can give up to 50-70% growth at least.
With an extremely negative market and disruption of the tops, there is a probability of a deeper retest of 0.075-80. To date, a retest of this range is more likely at the end of the month after the breakout and in the absence of price consolidation above 0.125 or with a rebound from this level from the third wave.
Besides OG and TROY, VIB has the highest goals among coins without a monitoring tag.

OG is trying to return to the trendTo date, the market has consolidated in anticipation of passing the middle of the month and determining the direction for the end of the year. The decision on the US interest rate may have a big impact. But for now, there is still an opportunity for the growth of individual coins with technical signals. TROY is showing itself well, aiming for a breakout of 0.0075. But in this article I want to consider OG, which from the second bottom at the key support of $ 5 can give a trend and catch up with TROY in dynamics. With a successful exit above the previously formed trend line, the nearest target will be a test of the 7.5-9 range. With a successful opening of the second half of the month above 7.5, you can expect the trend to consolidate and further overshoot. For now, the pressure of the unprocessed targets of the bears at 3000-3100 on the ether and 75-85k on the cue ball remains, in connection with which a new wave of sales at the change of the week may be deeper, with a payback after the decision on the US interest rate, in case the dollar weakens. In this negative scenario, OG can test $3.5-$4 where it will be possible to make a top-up, as it was possible to do with TROY. In the medium term, both TROY and OG are good tools with probable.
VIB also gave a new opportunity to re-buy profitably, which, in an optimistic scenario, can turn a weekly candle into a bullish one in order to continue the trend by 0.15 due to the opening of the week above 0.1.

Signal processing by TROYAgainst the background of maintaining purchases in the first half of the month, in addition to vib, I want to pay attention to troy, which showed much more confident dynamics. At the last pulse, a clear signal was left for a breakdown of the 0.0075 level, which gives a signal for a hike up to 0.0125-150 in the future. At the moment, the re-trading on the daily chart has been completed with the successful cancellation of further sales. There is a high probability of an attempt to gain a foothold above 0.0075 before the middle of the month, which would allow sales to be repaid until the end of the year, regardless of market dynamics. With a negative market and a 75-85k btc reversal, you can count on at least a 0.0075 retest on troy, which will already give 50%+ profit. The main support at the moment is the 0.0025-35 range from both borders of which you can make toppings in addition to the main position.
